

Identification of Molecular Subtypes and a Prognostic Signature Based on Inflammation-Related Genes in Colon Adenocarcinoma
- PMID: 35003085
- PMCID: PMC8733947
- DOI: 10.3389/fimmu.2021.769685
Identification of Molecular Subtypes and a Prognostic Signature Based on Inflammation-Related Genes in Colon Adenocarcinoma
Abstract
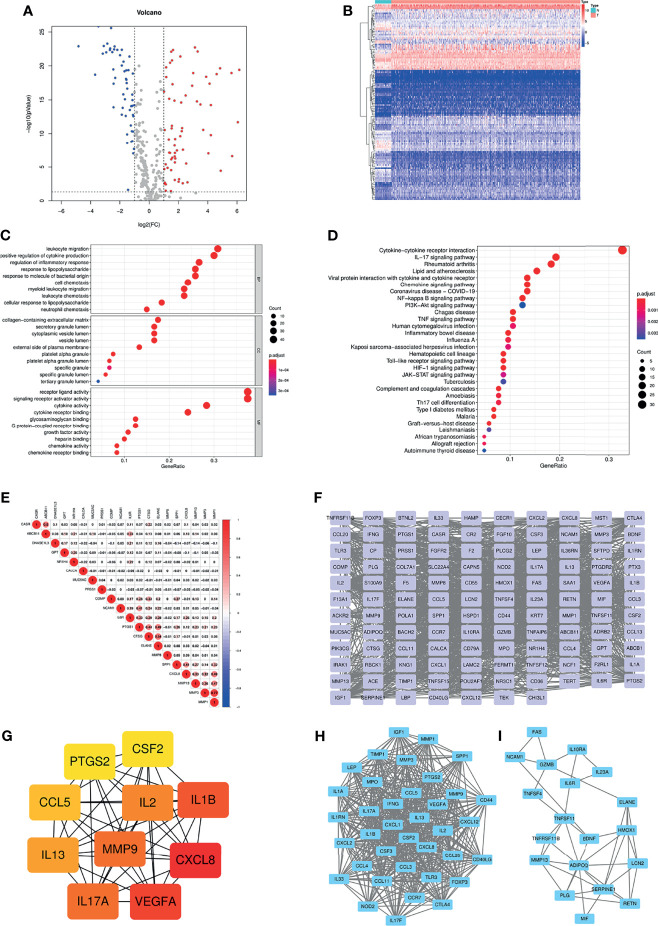
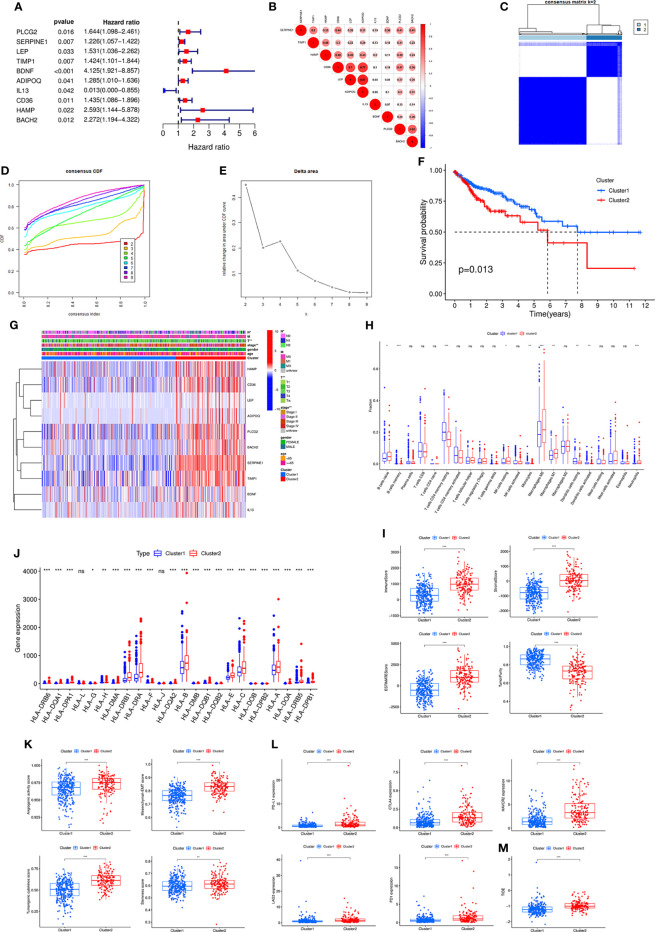
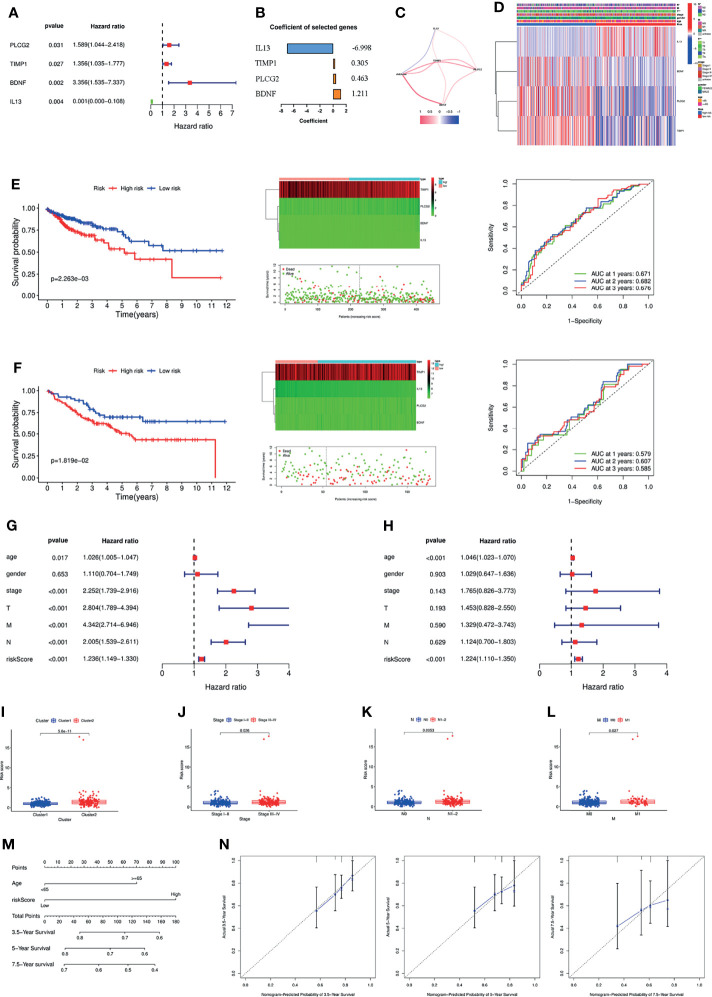
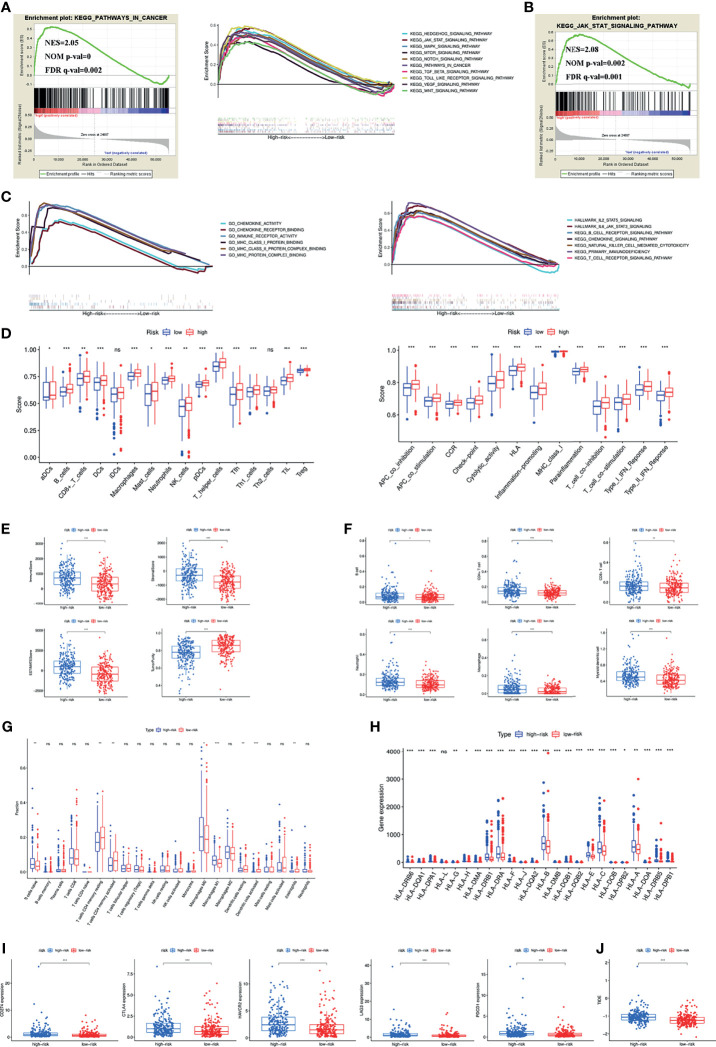
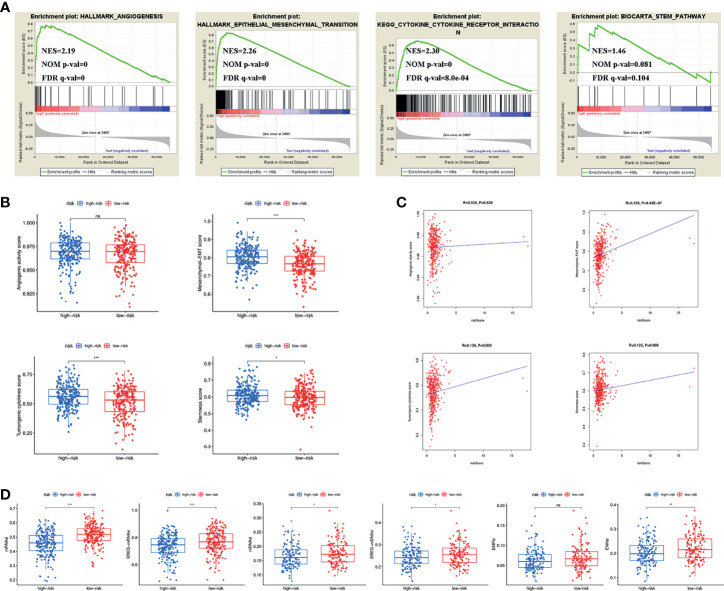
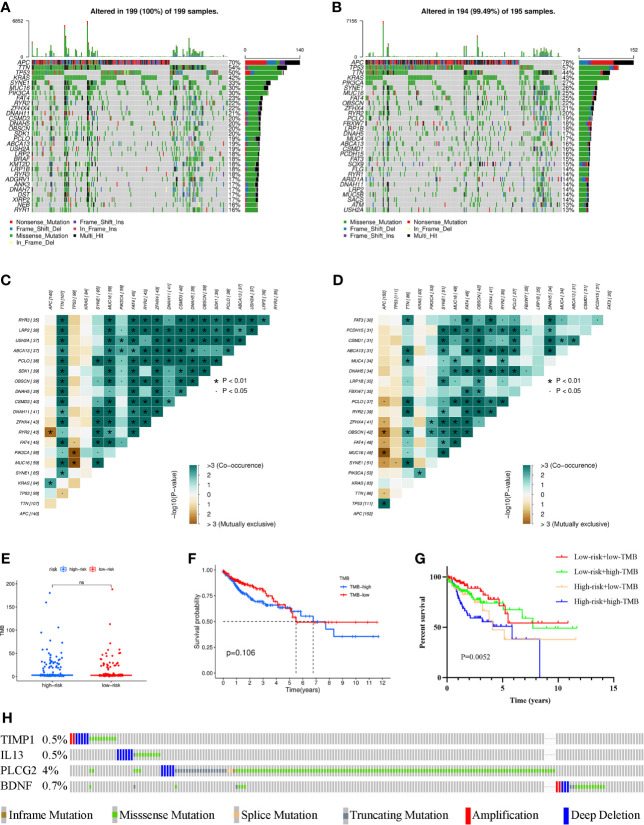
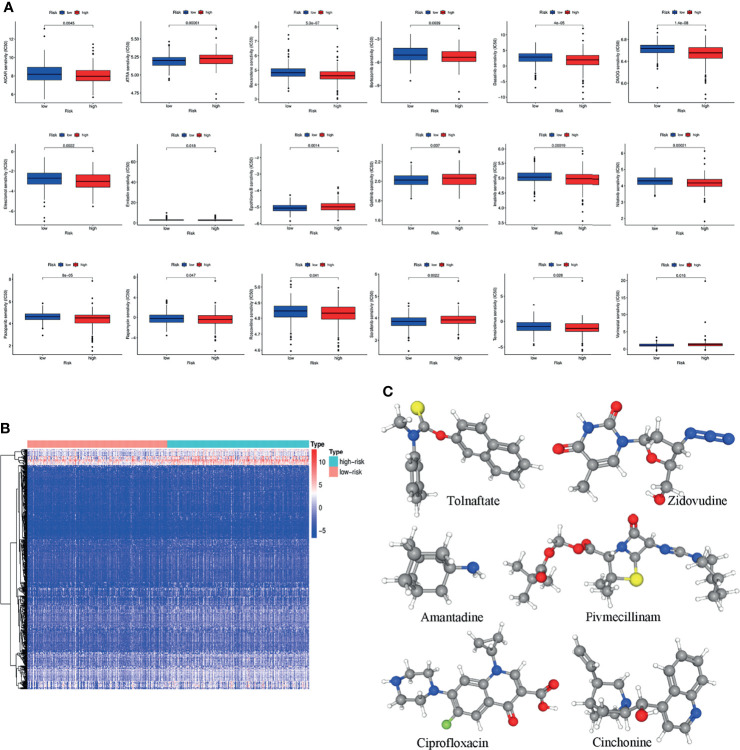
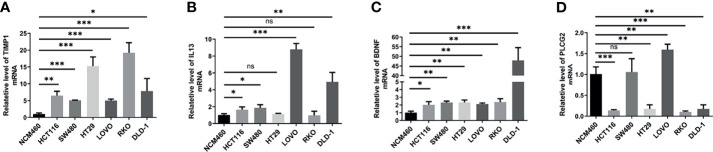
Both tumour-infiltrating immune cells and inflammation-related genes that can mediate immune infiltration contribute to the initiation and prognosis of patients with colon cancer. In this study, we developed a method to predict the survival outcomes among colon cancer patients and direct immunotherapy and chemotherapy. We obtained patient data from The Cancer Genome Atlas (TCGA) and captured inflammation-related genes from the GeneCards database. The package "ConsensusClusterPlus" was used to generate molecular subtypes based on inflammation-related genes obtained by differential expression analysis and univariate Cox analysis. A prognostic signature including four genes (PLCG2, TIMP1, BDNF and IL13) was also constructed and was an independent prognostic factor. Cluster 2 and higher risk scores meant worse overall survival and higher expression of human leukocyte antigen and immune checkpoints. Immune cell infiltration calculated by the estimate, CIBERSORT, TIMER, ssGSEA algorithms, tumour immune dysfunction and exclusion (TIDE), and tumour stemness indices (TSIs) were also compared on the basis of inflammation-related molecular subtypes and the risk signature. In addition, analyses of stratification, somatic mutation, nomogram construction, chemotherapeutic response prediction and small-molecule drug prediction were performed based on the risk signature. We finally used qRT-PCR to detect the expression levels of four genes in colon cancer cell lines and obtained results consistent with the prediction. Our findings demonstrated a four-gene prognostic signature that could be useful for prognostication in colon cancer patients and designing personalized treatments, which could provide new versions of personalized management for these patients.
Keywords: colon adenocarcinoma; immune infiltration; inflammation; molecule subtypes; signature.
Copyright © 2021 Qiu, Shi, Wu, Zou, Li, Wang, Liu, Song, Xu, Hu and Geng.
Conflict of interest statement
The authors declare that the research was conducted in the absence of any commercial or financial relationships that could be construed as a potential conflict of interest.
Figures
Similar articles
-
Identification of molecular subtypes and a prognostic signature based on m6A/m5C/m1A-related genes in lung adenocarcinoma.Sci Rep. 2024 Mar 30;14(1):7543. doi: 10.1038/s41598-024-57910-5. Sci Rep. 2024. PMID: 38555384 Free PMC article.
-
Identification of a PANoptosis-related long noncoding rna risk signature for prognosis and immunology in colon adenocarcinoma.BMC Cancer. 2025 Apr 10;25(1):662. doi: 10.1186/s12885-025-14021-2. BMC Cancer. 2025. PMID: 40211224 Free PMC article.
-
A gene signature related to programmed cell death to predict immunotherapy response and prognosis in colon adenocarcinoma.PeerJ. 2025 Feb 10;13:e18895. doi: 10.7717/peerj.18895. eCollection 2025. PeerJ. 2025. PMID: 39950044 Free PMC article.
-
Constructing and validating a risk model based on neutrophil-related genes for evaluating prognosis and guiding immunotherapy in colon cancer.J Gene Med. 2024 Apr;26(4):e3684. doi: 10.1002/jgm.3684. J Gene Med. 2024. PMID: 38618694 Review.
-
Advances in colon cancer research: in vitro and animal models.Curr Opin Genet Dev. 2021 Feb;66:50-56. doi: 10.1016/j.gde.2020.12.003. Epub 2021 Jan 7. Curr Opin Genet Dev. 2021. PMID: 33422950 Free PMC article. Review.
Cited by
-
RHOGTPase-Related Gene Signature Predicts Prognosis, Immunotherapy Response, and Chemotherapy Sensitivity in Colon Cancer.Appl Biochem Biotechnol. 2025 Jul;197(7):4702-4718. doi: 10.1007/s12010-025-05262-9. Epub 2025 May 10. Appl Biochem Biotechnol. 2025. PMID: 40347353
-
Revealing the pathogenesis of gastric intestinal metaplasia based on the mucosoid air-liquid interface.J Transl Med. 2024 May 17;22(1):468. doi: 10.1186/s12967-024-05276-7. J Transl Med. 2024. PMID: 38760813 Free PMC article.
-
Identification of an inflammation-related risk signature for prognosis and immunotherapeutic response prediction in bladder cancer.Sci Rep. 2024 Jan 12;14(1):1216. doi: 10.1038/s41598-024-51158-9. Sci Rep. 2024. PMID: 38216619 Free PMC article.
-
Acetylation model predicts prognosis of patients and affects immune microenvironment infiltration in epithelial ovarian carcinoma.J Ovarian Res. 2024 Jul 19;17(1):150. doi: 10.1186/s13048-024-01449-6. J Ovarian Res. 2024. PMID: 39030559 Free PMC article.
-
Prognostic and immune infiltration features of disulfidptosis-related subtypes in breast cancer.BMC Womens Health. 2024 Jan 2;24(1):6. doi: 10.1186/s12905-023-02823-0. BMC Womens Health. 2024. PMID: 38166898 Free PMC article.
References
MeSH terms
Substances
LinkOut - more resources
Full Text Sources
Research Materials
Miscellaneous