. 2021 Dec 24:12:810047.
doi: 10.3389/fimmu.2021.810047. eCollection 2021.

Development of an In Vivo Probe to Track SARS-CoV-2 Infection in Rhesus Macaques

Affiliations

Development of an In Vivo Probe to Track SARS-CoV-2 Infection in Rhesus Macaques

Patrick J Madden et al. Front Immunol. .

Abstract

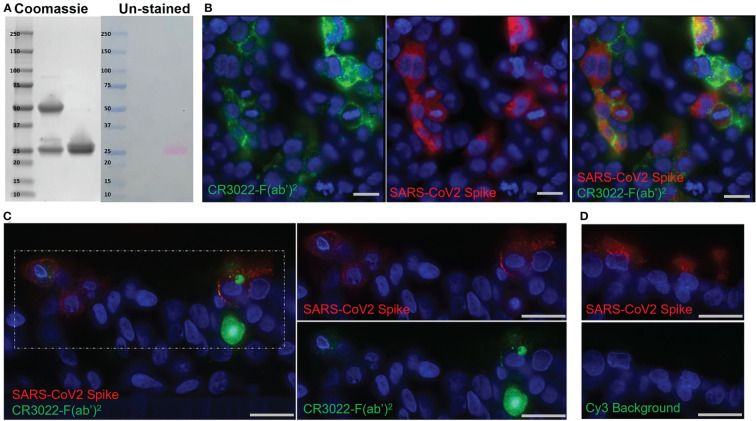
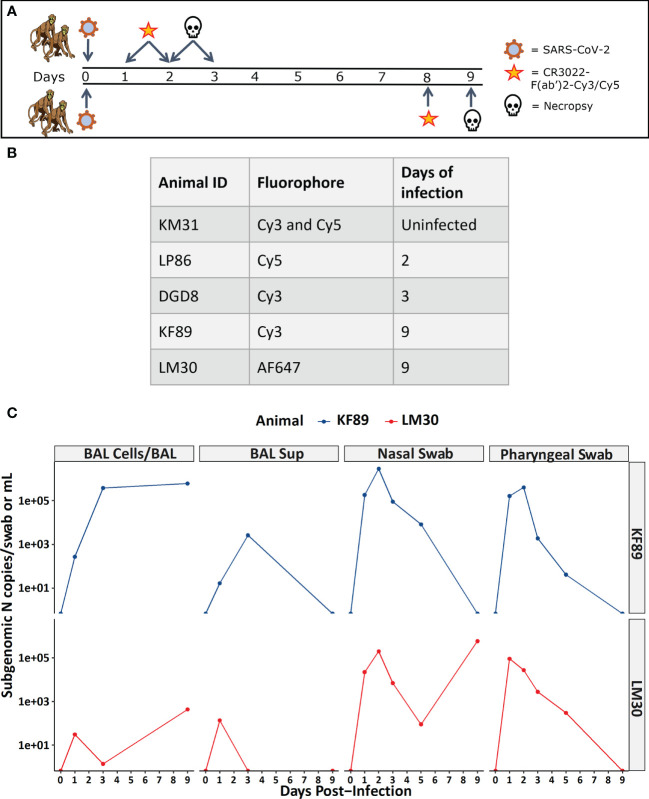
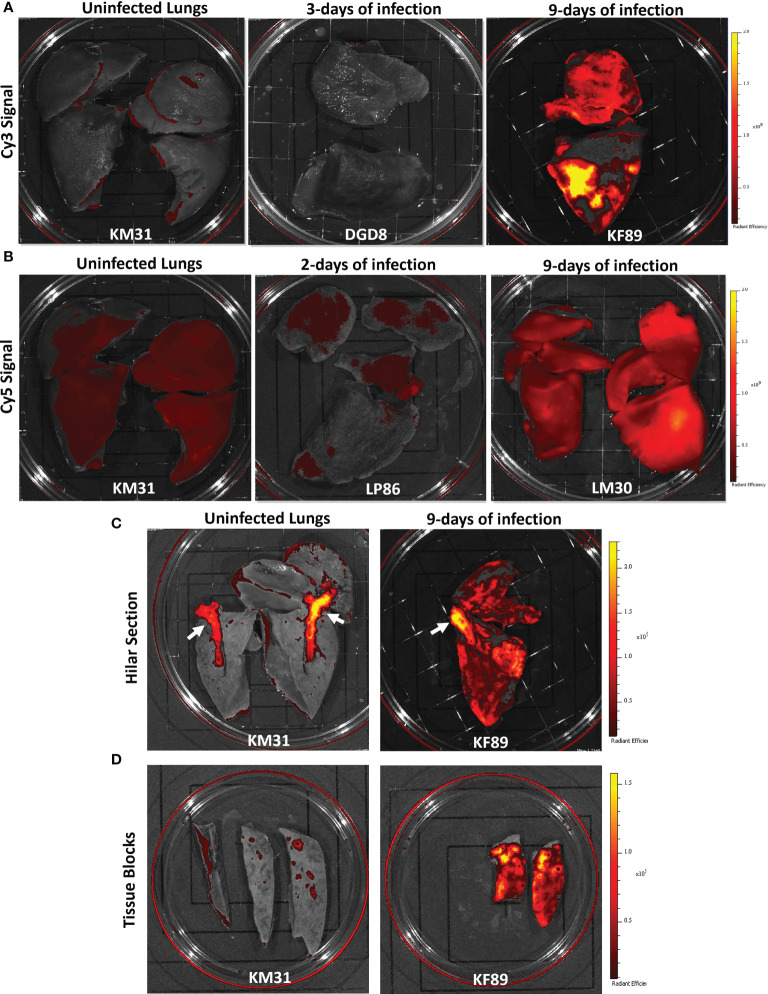
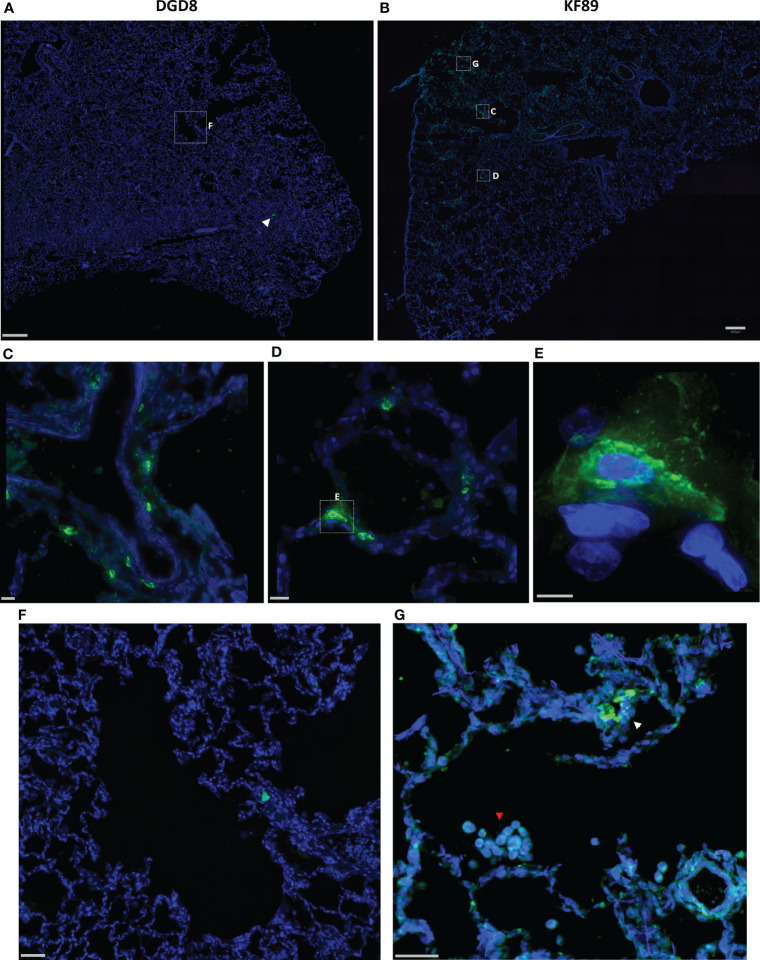
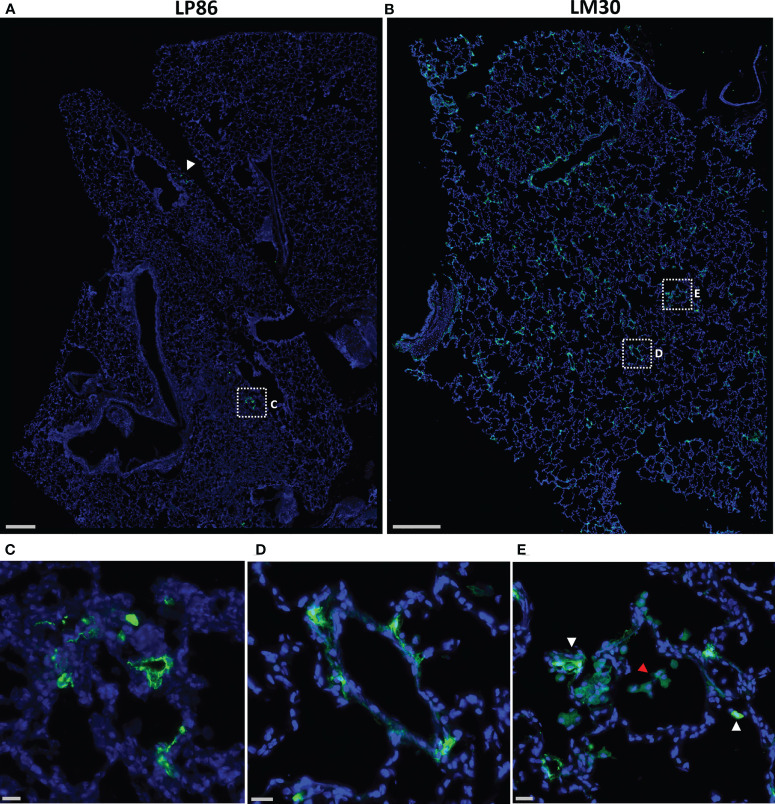
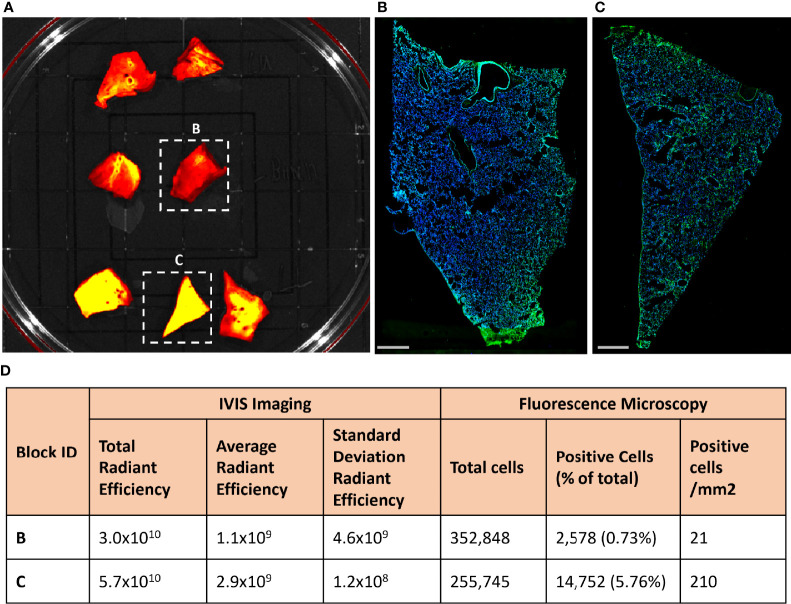
Infection with the novel coronavirus, SARS-CoV-2, results in pneumonia and other respiratory symptoms as well as pathologies at diverse anatomical sites. An outstanding question is whether these diverse pathologies are due to replication of the virus in these anatomical compartments and how and when the virus reaches those sites. To answer these outstanding questions and study the spatiotemporal dynamics of SARS-CoV-2 infection a method for tracking viral spread in vivo is needed. We developed a novel, fluorescently labeled, antibody-based in vivo probe system using the anti-spike monoclonal antibody CR3022 and demonstrated that it could successfully identify sites of SARS-CoV-2 infection in a rhesus macaque model of COVID-19. Our results showed that the fluorescent signal from our antibody-based probe could differentiate whole lungs of macaques infected for 9 days from those infected for 2 or 3 days. Additionally, the probe signal corroborated the frequency and density of infected cells in individual tissue blocks from infected macaques. These results provide proof of concept for the use of in vivo antibody-based probes to study SARS-CoV-2 infection dynamics in rhesus macaques.

Keywords: COVID-19; SARS-CoV-2; antibodies; antibody probes; nonhuman primates; rhesus macaque.


Conflict of interest statement

Authors AD and ML are employed by Bioqual, Inc. The remaining authors declare that the research was conducted in the absence of any commercial or financial relationships that could be construed as a potential conflict of interest.

Figures

Figure 1
Figure 1
Development of the CR3022 F(ab’)2 Probe. (A) SDS-PAGE showing intact IgG (left) and F(ab’)2 (right) after digestion. Two bands around 25 kDa are seen in the F(ab’)2 lane indicating the light chain and digested heavy chains. Right side of image shows the same gel before staining with Simply-safe blue stain showing the labeling of the F(ab’)2 probe with the fluorophore Cy3. (B) Fluorescent microscopy images of 293T cells transfected with a SARS-CoV-2 spike protein plasmid. CR3022-F(ab’)2 labeled with Cy5 is shown in green and an anti-SARS-CoV-2 spike antibody is shown in red. (C) Fluorescent microscopy of SARS-CoV-2 infected human airway epithelium cultures. Cy3 labeled CR3022-F(ab’)2 shown in green, an anti-SARS-CoV-2 spike antibody shown in red, and the nuclear stain Hoechst shown in blue. (D) Images of an infected human airway epithelium culture showing lack of Cy3 background (green) in infected cells (red). Scale bars for all images 20µM.
Figure 2
Figure 2
Study design and viral load measurements for infected macaques. (A) Infection and probe administration scheme for SARS-CoV-2 infected animals. (B) Table listing animal IDs and indicating the fluorophore that each individual animal received along with the day post-infection for necropsy. (C) Viral load data for 9-day infected animals measured as sub-genomic SARS-CoV-2 N mRNA from BAL cells, BAL supernatant, nasal swab, and pharyngeal swab.
Figure 3
Figure 3
Fluorescent probe results from four SARS-CoV-2 infected rhesus macaques. (A) Whole lung IVIS images showing Cy3 fluorescent signal from three animals; KM31 (un-infected control), DGD8 (3-days of infection), and KF89 (9-days of infection). (B) Whole lung IVIS images showing Cy5 fluorescent signal from three animals; KM31 (un-infected control), LP86 (2-days of infection), and LM30 (9-days of infection). Scale is the same for each image. (C) Hilar section of left lower lung lobe from KM31 and KF89. (D) Approximately 2 cm by 4cm tissue blocks from the left lower lung lobe of KM31 and KF89.
Figure 4
Figure 4
Fluorescent microscopy of infected cells in the lungs of DGD8 and KF89. (A, B) Representative low magnification (20x) fluorescent microscopy images of a section of lung from DGD8 (A) and KF89 (B). SARS-CoV-2 anti-sera staining shown in green, Hoechst nuclear stain in blue. White arrowhead indicates small cluster of infected cells in DGD8. Scale bars 500µM. (C, D) Insets of fluorescent microscopy images of infected cells from the lungs of KF89. Scale bars 20µM. (E) High magnification image of infected Type 2 pneumocyte from lungs of KF89. Scale bar 5µM. (F) Insets of image of DGD8 lung showing two to three infected cells and no infiltration of immune cells. Scale bar 50µM (G) Inset of image of KF89 lung showing infected cells (white arrowhead) and infiltration of alveolar macrophages (red arrowhead). Scale bar 50µM.
Figure 5
Figure 5
Fluorescent microscopy of infected cells in the lungs of LP86 and LM30. (A, B) Representative low magnification (20x) fluorescent microscopy images of a section of lung from LP86 (A) and LM30 (B). SARS-CoV-2 anti-sera staining shown in green, Hoechst nuclear stain in blue. White arrowhead and box indicate two small clusters of infected cells in LP86. Scale bars 500µM. (C, D) Insets of fluorescent microscopy images of infected cells from LP86 (C) and LM30 (D). Scale bars 20µM. (E) Inset of image of LM30 lung showing infiltration of alveolar macrophages (red arrowhead) and infected cells (white arrowheads) in alveolar septum. Scale bar 20µM.
Figure 6
Figure 6
Fluorescent probe results from four SARS-CoV-2 infected rhesus macaques. (A) Approximately 2 cm by 2cm tissue blocks from the left lower lung of KF89 showing Cy3 fluorescent signal differences between tissues. (B, C) Microscopy images from indicated tissue blocks from (A). Tissue was frozen in OCT, sectioned onto slides, and stained with SARS-CoV-2 anti-sera (green) and Hoechst nuclear stain (blue). Scale bars 2mm. (D) Values from quantification of IVIS fluorescence signal and infected cells from anti-sera staining.

References

    1. Zhou P, Yang X-L, Wang X-G, Hu B, Zhang L, Zhang W, et al. A Pneumonia Outbreak Associated With a New Coronavirus of Probable Bat Origin. Nature (2020) 579:270–3. doi: 10.1038/s41586-020-2012-7 - DOI - PMC - PubMed
    1. Zhu N, Zhang D, Wang W, Li X, Yang B, Song J, et al. A Novel Coronavirus From Patients With Pneumonia in China, 2019. NEJM (2020) 382:727–33. doi: 10.1056/NEJMOA2001017 - DOI - PMC - PubMed
    1. Gaebler C, Wang Z, Lorenzi JCC, Muecksch F, Finkin S, Tokuyama M, et al. Evolution of Antibody Immunity to SARS-CoV-2. Nature (2021) 591:639–44. doi: 10.1038/s41586-021-03207-w - DOI - PMC - PubMed
    1. Diao B, Wang C, Wang R, Feng Z, Zhang J, Yang H, et al. Human Kidney Is a Target for Novel Severe Acute Respiratory Syndrome Coronavirus 2 Infection. Nat Commun (2021) 12:1–9. doi: 10.1038/s41467-021-22781-1 - DOI - PMC - PubMed
    1. Pei G, Zhang Z, Peng J, Liu L, Zhang C, Yu C, et al. Renal Involvement and Early Prognosis in Patients With COVID-19 Pneumonia. J Am Soc Nephrol (2020) 31:1157–65. doi: 10.1681/ASN.2020030276 - DOI - PMC - PubMed

Publication types