Review
. 2021 Dec 24:12:686586.
doi: 10.3389/fpls.2021.686586. eCollection 2021.

Integrating Wheat Nucleolus Structure and Function: Variation in the Wheat Ribosomal RNA and Protein Genes

Affiliations
Review

Integrating Wheat Nucleolus Structure and Function: Variation in the Wheat Ribosomal RNA and Protein Genes

Rudi Appels et al. Front Plant Sci. .

Abstract

We review the coordinated production and integration of the RNA (ribosomal RNA, rRNA) and protein (ribosomal protein, RP) components of wheat cytoplasmic ribosomes in response to changes in genetic constitution, biotic and abiotic stresses. The components examined are highly conserved and identified with reference to model systems such as human, Arabidopsis, and rice, but have sufficient levels of differences in their DNA and amino acid sequences to form fingerprints or gene haplotypes that provide new markers to associate with phenotype variation. Specifically, it is argued that populations of ribosomes within a cell can comprise distinct complements of rRNA and RPs to form units with unique functionalities. The unique functionalities of ribosome populations within a cell can become central in situations of stress where they may preferentially translate mRNAs coding for proteins better suited to contributing to survival of the cell. In model systems where this concept has been developed, the engagement of initiation factors and elongation factors to account for variation in the translation machinery of the cell in response to stresses provided the precedents. The polyploid nature of wheat adds extra variation at each step of the synthesis and assembly of the rRNAs and RPs which can, as a result, potentially enhance its response to changing environments and disease threats.

Keywords: associated phenotypes; nucleolar dominance; rRNA structure; ribosomal protein (RP); sequence variation.


Conflict of interest statement

The authors declare that the research was conducted in the absence of any commercial or financial relationships that could be construed as a potential conflict of interest.

Figures

FIGURE 1
FIGURE 1
(A) Metaphase chromosomes from a wheat line with a 1R disomic addition (modified from Silva et al., 2008, doi.org/10.1371/journal.pone.0003824.g002). Dark staining regions corresponding to the nucleolar organizers are indicated as AgNOR; other dark staining regions of the rye chromosome correspond to heterochromatin/C-banding regions (marked as Ag-heterochromatin). (B) Wheat nucleolus, modified from Silva et al. (2008, doi.org/10.1371/journal.pone.0003824.g002) and Correll et al. (2019, doi.org/10.3390/cells8080869). In the left panel, dark regions are the condensed chromatin regions with rDNA as assayed by the wheat clone pTa71 (Gerlach and Bedbrook, 1979) as a probe for in situ hybridization. Silva et al. (2008) defined intranuclear dots housing the more dispersed rDNA that is more active in transcription (examples indicated) and perinucleolar knobs housing the condensed rDNA that was relatively inactive in transcription. The distribution of newly synthesized RNA in the right panel is distributed throughout the nucleolus as measured by the incorporation of labeled UTP (BrUTP). (C) Summary of the flow of RNA processing, and assembly into the mature cytoplasmic small ribosomal subunit (40S) and the large subunit (60S), to form the active 80S ribosome, including the independent production of 5S rRNA.
FIGURE 2
FIGURE 2
Termination of rDNA transcription and the engagement of RNA polymerase II to ensure efficient rRNA production. (A) Summary of the 9,000 bp rDNA unit in wheat. The 26S gene-3′ downstream is followed by the repetitive region of ca. 130 bp units leading to the promoter region and start of transcription (see Supplementary Figure 3) in the 18S gene 5′ upstream region. (B) The 26S gene-3′ downstream ca. 650 bp that distinguishes the S1–S4 subtypes of rDNA in wheat. The Taq1, HaeIII, and Hha1 that could be related to the structure defined for the clone pTa250 by Appels and Dvorak (1982) are boxed. The (HaeIII) sites were not identified in pTa250. The TATA box regions are emphasized in red and are postulated to engage the TATA box-binding protein (TBP) for contributing to engaging RNA polymerase II in forming an R-loop shield. (C) Model for the protein complexes formed in the 26S gene-3′ downstream region to ensure RNA pol I transcription is properly terminated, based on the studies on human rDNA structure and function (Fomproix et al., 1998; Abraham et al., 2020; doi.org/10.1038/s41586-020-2497-0). The prominent nucleolar proteins, nucleolin and fibrillarin, are possibly involved as discussed in the earlier text (Nasirudin et al., 2004; Pontvianne et al., 2007; Rodriguez-Corona et al., 2015). The inset (boxed) indicates the 3′-end of the rice 26S RNA gene to confirm the 3′-end of the wheat 26S RNA gene, according to Armache et al. (2010).
FIGURE 3
FIGURE 3
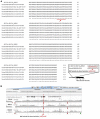
(A) The wheat fibrillarin genes on chromosomes 6A, 6B 6D, 7A, 7B, and 7D. Sequences from Arabidopsis and rice were downloaded, and UniProt identifiers were used to recover amino acid sequences for searches against the Triticum aestivum L. genomes using BLASTP in Ensembl (http://plants.ensembl.org/index.html). Alignment at the amino acid level to validate the identification on the wheat gene models against the well-characterized Arabidopsis AAF00542 gene; the fibrillarin TraesCS6D02G462702400 had an identical amino acid sequence to the fibrillarins from human and yeast. The methyltransferase domain is well conserved in contrast to the nucleolar-targeting domain, which shows relatively more diversity. The * indicates the same amino acid is at the respective positions, and spaces and dots indicate amino acid change. The red spots indicate the positions of the single nucleotide polymorphisms (SNPs) in an assessment of wheat varieties available in the viewer DAWN. (B) A representative view of the SNP diversity at the DNA sequence level identifying gene haplotypes for TraesCS6B02G440500 using wheat varieties Lancer, Mace, and Baxter as examples. Lancer and Mace have been sequenced in the 10 genome project (Walkowiak et al., 2020). The gray areas indicate the variable genome coverage of the available sequence data, and the colored “drops” identify positions in the sequence that are uniformly changed from that of the reference Chinese Spring genome sequence (orange = change to G; red = change to T; green = change to A; blue = change to C). The SNP analysis was possible using DAWN (Watson-Haigh et al., 2018; http://crobiad.agwine.adelaide.edu.au/dawn/jbrowse/). The DAWN viewer uses standard genome format and can show the location of SNP at the genome sequence level.
FIGURE 4
FIGURE 4
Structure of wheat 5S rRNA and the ribosomal L5 protein (RPL5) from wheat. The consensus 5S rRNA sequence and secondary structure modified from Lee et al. (2006) is in the left panel. The dashed lines link bases that can form H-bonds in a tertiary folding. The structure of wheat 5SRNA indicates the C loop in domain β is important in binding to the RPL5 as discussed in the text. The right panel (dotted line) indicates the wheat RPL5 protein gene models (reference sequence from Kang et al., 2011) and illustrates the gene-level haplotypes discussed in the text for TraesCS2A02G296000, TraesCS2B02G312400, TraesCS2D02G293900, TraesCS5B02G374800.2, and TraesCS5D1G474800LC (see main text for details of the identification process). The TraesCS2D02G293900 gene model has the C-terminal 84 amino acids deleted and is most likely a pseudogene. The significance of the inserted three amino acids at positions 25–27 is unclear. The alignment of the five wheat RPL5 gene models indicates that they are largely separated into either chromosome 2A/2B or chromosome 5B/5D protein haplotypes with the chromosome 2D entry showing a large deletion. At the genome level, the single nucleotide polymorphism (SNP)-based haplotypes were limited to introns and thus useful for tracking the gene region but none of the within-genome variation between homologous genes has been captured in the wheat varieties accessible in the genome viewer DAWN. The red line highlights the region predicted to bind the section of 5SRNA highlighted in a red dashed line in the left panel. The breaks in the rows of *s indicate amino acid changes in the alignments, and these generally define the chromosome 2A/2B or chromosome 5B/5D protein haplotypes.
FIGURE 5
FIGURE 5
(A) Map of the 18S rRNA in the 40S ribosome subunit modified from Armache et al. (2010; doi.org/10.1073/pnas.1009999107). The h and ES loops in the rRNA molecule are discussed in the text. (B) Map of the 26S rRNA in the 60S ribosome subunit modified from Armache et al. (2010, doi.org/10.1073/pnas.1009999107). The wheat 5.8S rRNA molecule shown was based on Mackay et al. (1980). (C). The 3D representation of the translating wheat ribosome with the Proline-tRNA at the peptidyl-transferase center (PTC) in place Armache et al. (2010, doi.org/10.1073/pnas.1009999107). The central protuberance in the 60S subunit is a standard landmark for the 60S subunit. (D) Relationship between RPL2, RPL3, RPL4, and RPL10 modeled in the wheat ribosome PTC from Armache et al. (2010)Supplementary Data in doi.org/10.1073/pnas.100999910.
FIGURE 6
FIGURE 6
Alignments for wheat RPS6 gene models at the amino acid level. (A) The first six entries in the alignments are on the short arms of chromosomes 2A, 2B, and 2D, and the lower three entries are on the respective long arms. CLUSTAL omega (Sievers et al., 2011; https://www.ebi.ac.uk/Tools/services/web/) was used to carry out the alignments using standard parameters. The Traes IDs are for IWGSCrefseqver1 and a hyphen separates the coordinate position of the gene model; the gaps in the entries TraesCS2A02G066100 and TraesCS2DG0264500 are the result of gaps in the IWGSCrefseq-ver1 assembly. The insert is the alignment of a small section of amino acid sequence from TraesCS2A02G066200 and an Arabidopsis RPS6 (O48549) referred to in the text in relation to the Serine237. This section is also underlined in the main sequence and is shown in location relative to the highly conserved RPS6 domain (black box). The single nucleotide polymorphisms (SNPs) indicated in panel (B) (below) at the genome level are indicated with red dots where they occur in the CDS and in only one case the SNP changed the code for the amino acid (F45L, indicated in red). (B) Comparison of the SNP profiles from two representative wheat varieties showing strikingly different haplotypes in the region of the wheat chromosome 2B locus for RPS6 as defined in Pfam (Orengo et al., 2020) at positions 1–128. The gray areas indicate the variable genome coverage of the available sequence data and the colored “drops” identify positions in the sequence that are uniformly changed from that of the reference Chinese Spring genome sequence (orange = change to G; red = change to T; green = change to A; blue = change to C). The SNP analysis was possible using DAWN (Watson-Haigh et al., 2018; http://crobiad.agwine.adelaide.edu.au/dawn/jbrowse/). * means identical amino acid in that position across the genes.
FIGURE 7
FIGURE 7
(A) RPL6 wheat gene models. See legend Figure 3 for details of the identification process. The red line refers to a section of the amino acid sequence that is also represented in the inset to emphasize that the V45L and V45F changes have been captured in the wheat varieties examined in DAWN [see panel (B)]. (B) Screen for single nucleotide polymorphism (SNPs) in the RPL6 region of chromosome 6D. The gray areas indicate the variable genome coverage of the available sequence data and the colored “drops” identify positions in the sequence that are uniformly changed from that of the reference Chinese Spring genome sequence (orange = change to G; red = change to T; green = change to A; blue = change to C). The SNP analysis was possible using DAWN (Watson-Haigh et al., 2018; http://crobiad.agwine.adelaide.edu.au/dawn/jbrowse/). The red dashed lines emphasizes the V45L and V45F changes in the amino acid sequence shown in Figure 6A within an otherwise conserved CDS.
FIGURE 8
FIGURE 8
RPL3 gene models in wheat. (A) See legend Figure 3 for details of the identification process. Locations of differences in amino acid sequence within a single genome are indicated by the absence of a *. The red dots indicate the locations of mutations associated with medical conditions in humans and are thus predicted to have a phenotype in wheat if they were found to occur. The two red arrows highlight mutations at positions W258R and H259Y in the tomato RPL3 that provided an improved tolerance to F. graminearum in transgenic tobacco. (B) Single nucleotide polymorphism (SNP) variation in the genome region around the RPL3 gene on chromosome 5B, even though variation in the CDS has not been captured in the set of wheat varieties available in the DAWN viewer used to generate the image. The gray areas indicate the variable genome coverage of the available sequence data and the colored “drops” identify positions in the sequence that are uniformly changed from that of the reference Chinese Spring genome sequence (orange = change to G; red = change to T; green = change to A; blue = change to C). The SNP analysis was possible using DAWN (Watson-Haigh et al., 2018; http://crobiad.agwine.adelaide.edu.au/dawn/jbrowse/).
FIGURE 9
FIGURE 9
(A) RPL10 wheat gene models. See legend Figure 3 for details of the identification process. The red dots indicate the locations of the amino acid changes found in human, wheat, rice tobacco, and yeast shown in the respective boxes to the left of the alignment, discussed in the text. In some positions, breaks in the *s indicating differences within the homologous wheat genes align correspond to red dots (for example Q123L) indicating the change is also found in humans and other eukaryotes as defined in the boxes to the left of the alignments. The red line indicates the P-site loop region that is important in the catalytic site (PTC, see Figure 5). (B) Single nucleotide polymorphism (SNP) variation in the genome region around the RPL10 gene on chromosome 1B, even though variation in the CDS has not been captured in the wheat varieties examined (exemplar shown). The gray areas indicate the variable genome coverage of the available sequence data and the colored “drops” identify positions in the sequence that are uniformly changed from that of the reference Chinese Spring genome sequence (orange = change to G; red = change to T; green = change to A; blue = change to C). The SNP analysis was possible using DAWN (Watson-Haigh et al., 2018; http://crobiad.agwine.adelaide.edu.au/dawn/jbrowse/).

Similar articles

Cited by

References

    1. Abraham K. J., Khosraviani N., Chan J. N. Y., Gorthi A., Samman A., Zhao D. Y., et al. (2020). Nucleolar RNA polymerase II drives ribosome biogenesis. Nature 585 298–302. 10.1038/s41586-020-2497-0 - DOI - PMC - PubMed
    1. Appels R., Dvorak J. (1982). The wheat ribosomal DNA spacer region: its structure and variation in populations and among species. Theor. Appl. Genet. 63 337–348. - PubMed
    1. Armache J.-P., Jarasch A., Anger A. M., Villa E., Becker T., Bhushan S., et al. (2010). Localization of eukaryote-specific ribosomal proteins in a 5.5-Å cryo-EM map of the 80S eukaryotic ribosome. Proc. Natl. Acad. Sci. U.S.A. 107 19754–19759. 10.1073/pnas.1010005107 - DOI - PMC - PubMed
    1. Ban N., Beckmann R., Cate J. H. D., Dinman J. D., Dragon F., Ellis S. R., et al. (2014). A new system for naming ribosomal proteins. Curr. Opin. Struct. Biol. 24 165–169. - PMC - PubMed
    1. Barker R. F., Harberd N. P., Jarvist M. G., Flavell R. B. (1988). Structure and evolution of the intergenic region in a ribosomal DNA repeat unit of wheat. J. Mol. Biol. 201 1–17. 10.1016/0022-2836(88)90434-2 - DOI - PubMed

LinkOut - more resources