High-performance Collective Biomarker from Liquid Biopsy for Diagnosis of Pancreatic Cancer Based on Mass Spectrometry and Machine Learning
- PMID: 35003367
- PMCID: PMC8734412
- DOI: 10.7150/jca.63244
High-performance Collective Biomarker from Liquid Biopsy for Diagnosis of Pancreatic Cancer Based on Mass Spectrometry and Machine Learning
Abstract
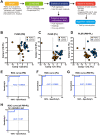
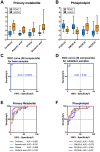
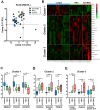
Background: Most pancreatic cancers are found at progressive stages when they cannot be surgically removed. Therefore, a highly accurate early detection method is urgently needed. Methods: This study analyzed serum from Japanese patients who suffered from pancreatic ductal adenocarcinoma (PDAC) and aimed to establish a PDAC-diagnostic system with metabolites in serum. Two groups of metabolites, primary metabolites (PM) and phospholipids (PL), were analyzed using liquid chromatography/electrospray ionization mass spectrometry. A support vector machine was employed to establish a machine learning-based diagnostic algorithm. Results: Integrating PM and PL databases improved cancer diagnostic accuracy and the area under the receiver operating characteristic curve. It was more effective than the algorithm based on either PM or PL database, or single metabolites as a biomarker. Subsequently, 36 statistically significant metabolites were fed into the algorithm as a collective biomarker, which improved results by accomplishing 97.4% and was further validated by additional serum. Interestingly, specific clusters of metabolites from patients with preoperative neoadjuvant chemotherapy (NAC) showed different patterns from those without NAC and were somewhat comparable to those of the control. Conclusion: We propose an efficient screening system for PDAC with high accuracy by liquid biopsy and potential biomarkers useful for assessing NAC performance.
Keywords: Liquid biopsy; Machine leargning; Metabolome; Neoadjuvant chemotherapy; Pancreatic ductal adenocarcinoma.
© The author(s).
Conflict of interest statement
Competing Interests: This research is not based on a previous communication to any societies or meetings. This work has been funded by Shimadzu corporation. The funder had no role in the design of the study; in the collection, analyses, or interpretation of data; in the writing of the manuscript, or in the decision to publish the results.
Figures


Similar articles
-
Using probe electrospray ionization mass spectrometry and machine learning for detecting pancreatic cancer with high performance.Am J Transl Res. 2020 Jan 15;12(1):171-179. eCollection 2020. Am J Transl Res. 2020. PMID: 32051746 Free PMC article.
-
Metabolic detection and systems analyses of pancreatic ductal adenocarcinoma through machine learning, lipidomics, and multi-omics.Sci Adv. 2021 Dec 24;7(52):eabh2724. doi: 10.1126/sciadv.abh2724. Epub 2021 Dec 22. Sci Adv. 2021. PMID: 34936449 Free PMC article.
-
Serum Biomarker Signature-Based Liquid Biopsy for Diagnosis of Early-Stage Pancreatic Cancer.J Clin Oncol. 2018 Oct 1;36(28):2887-2894. doi: 10.1200/JCO.2017.77.6658. Epub 2018 Aug 14. J Clin Oncol. 2018. PMID: 30106639 Free PMC article.
-
Dkk1 involvement and its potential as a biomarker in pancreatic ductal adenocarcinoma.Clin Chim Acta. 2019 Jan;488:226-234. doi: 10.1016/j.cca.2018.11.023. Epub 2018 Nov 16. Clin Chim Acta. 2019. PMID: 30452897 Review.
-
The role of intraperitoneal chemotherapy in the surgical management of pancreatic ductal adenocarcinoma: a systematic review.Clin Exp Metastasis. 2021 Apr;38(2):187-196. doi: 10.1007/s10585-021-10074-2. Epub 2021 Jan 24. Clin Exp Metastasis. 2021. PMID: 33486670
Cited by
-
Meta-Analysis Reveals Both the Promises and the Challenges of Clinical Metabolomics.Cancers (Basel). 2022 Aug 18;14(16):3992. doi: 10.3390/cancers14163992. Cancers (Basel). 2022. PMID: 36010984 Free PMC article.
-
Ambient Mass Spectrometry and Machine Learning-Based Diagnosis System for Acute Coronary Syndrome.Mass Spectrom (Tokyo). 2024;13(1):A0147. doi: 10.5702/massspectrometry.A0147. Epub 2024 Jul 11. Mass Spectrom (Tokyo). 2024. PMID: 39005641 Free PMC article.
-
Metabolomic biomarkers in liquid biopsy: accurate cancer diagnosis and prognosis monitoring.Front Oncol. 2024 Feb 7;14:1331215. doi: 10.3389/fonc.2024.1331215. eCollection 2024. Front Oncol. 2024. PMID: 38384814 Free PMC article. Review.
-
Machine Learning-Driven Insights in Cancer Metabolomics: From Subtyping to Biomarker Discovery and Prognostic Modeling.Metabolites. 2025 Aug 1;15(8):514. doi: 10.3390/metabo15080514. Metabolites. 2025. PMID: 40863133 Free PMC article. Review.
-
New Diagnostic Modality Combining Mass Spectrometry and Machine Learning for the Discrimination of Malignant Intraductal Papillary Mucinous Neoplasms.Ann Surg Oncol. 2023 May;30(5):3150-3157. doi: 10.1245/s10434-022-13012-y. Epub 2023 Jan 8. Ann Surg Oncol. 2023. PMID: 36611070 Free PMC article.
References
-
- Bray F, Ferlay J, Soerjomataram I, Siegel RL, Torre LA, Jemal A. Global cancer statistics 2018: GLOBOCAN estimates of incidence and mortality worldwide for 36 cancers in 185 countries. CA Cancer J Clin. 2018;68:394–424. - PubMed
-
- Kleeff J, Korc M, Apte M, La Vecchia C, Johnson CD, Biankin AV. et al. Pancreatic cancer. Nat Rev Dis Primers. 2016;2:16022. - PubMed
-
- Mizrahi JD, Surana R, Valle JW, Shroff RT. Pancreatic cancer. Lancet. 2020;395:2008–20. - PubMed
-
- Goonetilleke KS, Siriwardena AK. Systematic review of carbohydrate antigen (CA 19-9) as a biochemical marker in the diagnosis of pancreatic cancer. Eur J Surg Oncol. 2007;33:266–70. - PubMed
LinkOut - more resources
Full Text Sources

