. 2021 Dec 17;12(1):561-572.
doi: 10.1515/tnsci-2020-0204. eCollection 2021 Jan 1.

Bone marrow mesenchymal stem cells overexpressing hepatocyte growth factor ameliorate hypoxic-ischemic brain damage in neonatal rats

Affiliations

Bone marrow mesenchymal stem cells overexpressing hepatocyte growth factor ameliorate hypoxic-ischemic brain damage in neonatal rats

Wen Zeng et al. Transl Neurosci. .

Abstract

Objectives: Hypoxic-ischemic brain damage (HIBD) is a major cause of brain injury in neonates. Bone marrow mesenchymal stem cells (BMSCs) show therapeutic potential for HIBD, and genetic modification may enhance their neuroprotective effects. The goal of this study was to investigate the neuroprotective effects of hepatocyte growth factor (HGF)-overexpressing BMSCs (BMSCs-HGF) against HIBD and their underlying mechanisms.

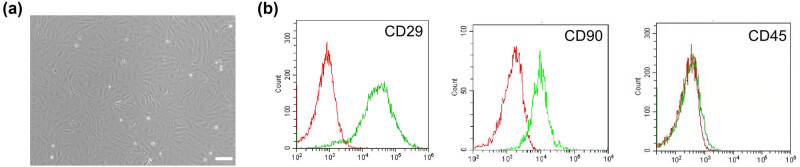
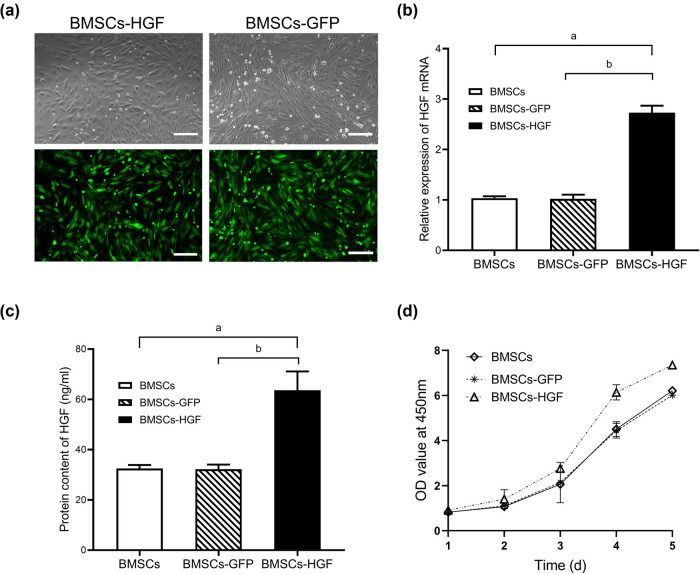
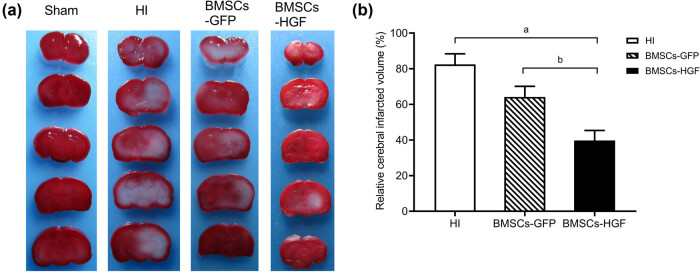
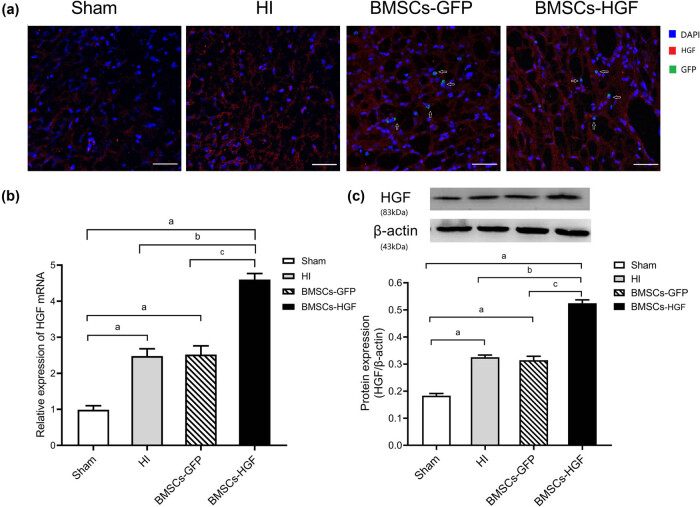
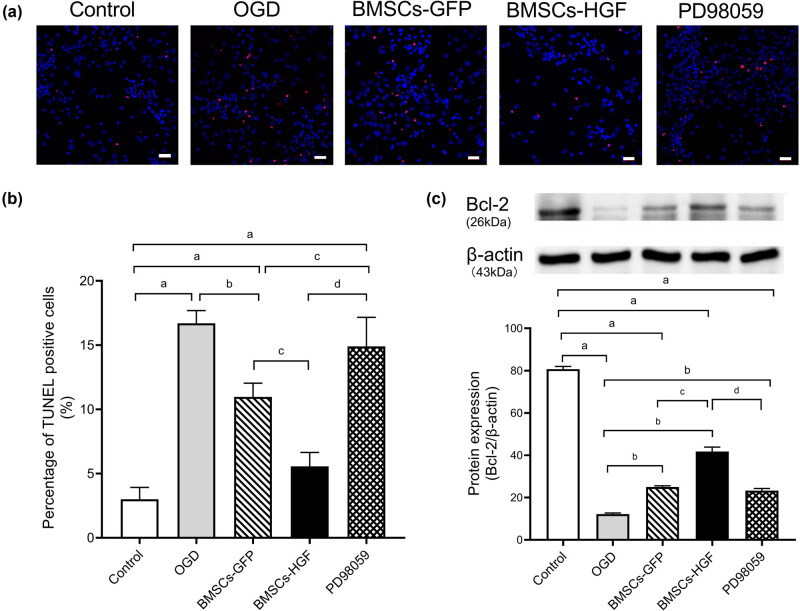
Methods: BMSCs were transfected with HGF using adenoviral vectors. HIBD models were established and then BMSCs were transplanted into the brains of HIBD rats via intraventricular injection. 2,3,5-Triphenyltetrazolium chloride (TTC) staining was used to measure cerebral infarction volumes. In vitro, primary cultured cortical neurons were co-cultured with BMSCs in a Transwell plate system. Oxygen-glucose deprivation (OGD) was applied to imitate hypoxic-ischemic insult, and PD98059 was added to the culture medium to block the phosphorylation of extracellular signal-regulated kinase (ERK). Cell apoptosis was determined using TUNEL staining. The expression of HGF was measured by immunofluorescence, real-time quantitative PCR (RT-qPCR), and western blots. The expression of phosphorylated ERK (p-ERK) and B-cell lymphoma-2 (Bcl-2) was measured by western blots.

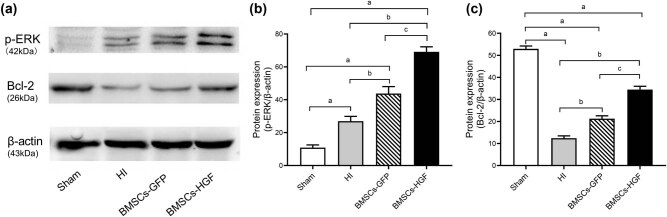
Results: HGF-gene transfection promoted BMSC proliferation. Moreover, BMSCs-HGF decreased HIBD-induced cerebral infarction volumes and enhanced the protective effects of the BMSCs against HIBD. BMSCs-HGF also increased expression of HGF, p-ERK, and Bcl-2 in brain tissues. In vitro, BMSC-HGF protected neurons against OGD-induced apoptosis. Inhibition of ERK phosphorylation abolished the neuroprotective effect of BMSCs-HGF against OGD.

Conclusions: BMSCs-HGF is a potential treatment for HIBD and that the ERK/Bcl-2 pathway is involved in the underlying neuroprotective mechanism.

Keywords: adenoviral vector; bone marrow mesenchymal stem cell; extracellular signal-regulated kinase; hepatocyte growth factor; hypoxic–ischemic brain damage.


Conflict of interest statement

Conflict of interest: The authors state no conflict of interest.

Figures

Figure 1
Figure 1
Culture and identification of BMSCs. (a) Morphology of BMSCs after 7 days of culture under a light microscope. Scale bar = 10 μm. (b) Representative flow cytometry plots of CD29, CD90, and CD45 levels in cultured BMSCs. Red and green curves represent the isotype controls and markers, respectively. Flow cytometry showed the positive CD29 and CD90 expression and the negligible CD45 expression.
Figure 2
Figure 2
Ad-HGF transfection enhances HGF expression and proliferation in BMSCs. (a) GFP expression in BMSCs transfected with Ad-HGF (BMSCs-HGF) and Ad-GFP (BMSCs-GFP) at MOI = 150 by fluorescence microscopy, respectively. Scale bar = 25 µm. (b) After 48 h of HGF gene transduction, the level of HGF mRNA in BMSCs was determined by RT-qPCR. (c) The protein level of HGF in the cultured BMSC supernatant was measured using ELISA. (d) CCK-8 assays were performed at 1, 2, 3, 4, and 5 days after transfection to determine the proliferation of BMSCs. Ad-HGF transfection promoted the proliferation of BMSCs compared with BMSCs-GFP and nontransfected BMSCs (P < 0.05). Ad-GFP transfection did not affect the proliferation of BMSCs (P > 0.05). Data are expressed as the mean ± SD. ((a) P < 0.001 vs BMSCs; (b) P < 0.001 vs BMSCs-GFP).
Figure 3
Figure 3
Evaluation of the cerebral infarct volume using TTC staining in different experimental groups. (a) Representative images of TTC-stained brain sections at 72 h after BMSC transplantation. The infarct area is white, while normal tissues are stained in red. (b) Histograms representing the relative quantitative evaluation of the cerebral infarct volume. Data are expressed as the mean ± SD. ((a) P < 0.001 vs BMSCs; (b) P < 0.001 vs BMSCs-GFP).
Figure 4
Figure 4
Expression of HGF in different experimental groups after BMSC transplantation. (a) Cerebral expression of HGF determined by immunofluorescence at 24 h after BMSC transplantation. Blue: DAPI; red: HGF; green: GFP (also indicated by arrows). Scale bar = 50 µm. (b) Determination of relative HGF mRNA expression by RT- qPCR. (c) Determination of relative HGF protein expression by western blotting. Data are expressed as the mean ± SD. ((a) P < 0.001 vs Sham; (b) P < 0.001 vs HI; (c) P < 0.001 vs BMSCs-GFP).
Figure 5
Figure 5
Expression of p-ERK and Bcl-2 in different experimental groups after BMSC transplantation. (a) Representative western blots showing expression of p-ERK and Bcl-2 protein in neonatal rat brains. β-Actin served as the loading control. (b) Histograms representing the relative quantitative evaluation of p-ERK protein. (c) Histograms representing the relative quantitative evaluation of Bcl-2 protein. Data are expressed as the mean ± SD. ((a) P < 0.001 vs Sham; (b) P < 0.001 vs HI; (c) P < 0.001 vs BMSCs-GFP).
Figure 6
Figure 6
Blocking the phosphorylation of ERK abolishes the effects of BMSCs-HGF on neurons. (a) Apoptosis of neurons induced by OGD in different experimental groups was determined using TUNEL staining. Blue: DAPI; red: TUNEL. Scale bar = 25 µm. (b) Histograms representing the percentage of TUNEL positive neurons by quantitative analysis. (c) Upper panel: representative western blots showing expression of Bcl-2 protein in neurons. Lower panel: histograms representing the relative quantitative evaluation of Bcl-2 protein. Data are expressed as the mean ± SD. ((a): P < 0.001 vs Sham; (b) P < 0.001 vs OGD; (c) P < 0.001 vs BMSCs-GFP; (d) P < 0.001 vs BMSCs-HGF).

Similar articles

Cited by

References

    1. Douglas-Escobar M, Weiss MD. Hypoxic-ischemic encephalopathy: a review for the clinician. JAMA Pediatr. 2015;169:397–403. - PubMed
    2. Douglas-Escobar M, Weiss MD. Hypoxic-ischemic encephalopathy: a review for the clinician. JAMA Pediatr. 2015;169:397–403. - PubMed
    1. Finder M, Boylan GB, Twomey D, Ahearne C, Murray DM, Hallberg B. Two-year neurodevelopmental outcomes after mild hypoxic ischemic encephalopathy in the era of therapeutic hypothermia. JAMA Pediatr. 2020;174:48–55. - PMC - PubMed
    2. Finder M, Boylan GB, Twomey D, Ahearne C, Murray DM, Hallberg B. Two-year neurodevelopmental outcomes after mild hypoxic ischemic encephalopathy in the era of therapeutic hypothermia. JAMA Pediatr. 2020;174:48–55. - PMC - PubMed
    1. Lodygensky GA, Battin MR, Gunn AJ. Mild neonatal encephalopathy – how, when, and how much to treat? JAMA Pediatr. 2018;172:3–4. - PubMed
    2. Lodygensky GA, Battin MR, Gunn AJ. Mild neonatal encephalopathy – how, when, and how much to treat? JAMA Pediatr. 2018;172:3–4. - PubMed
    1. Tagin MA, Woolcott CG, Vincer MJ, Whyte RK, Stinson DA. Hypothermia for neonatal hypoxic ischemic encephalopathy: an updated systematic review and meta-analysis. Arch Pediatri Adolesc Med. 2012;166:558–66. - PubMed
    2. Tagin MA, Woolcott CG, Vincer MJ, Whyte RK, Stinson DA. Hypothermia for neonatal hypoxic ischemic encephalopathy: an updated systematic review and meta-analysis. Arch Pediatri Adolesc Med. 2012;166:558–66. - PubMed
    1. Qin X, Cheng J, Zhong Y, Mahgoub OK, Akter F, Fan Y, et al. Mechanism and treatment related to oxidative stress in neonatal hypoxic-ischemic encephalopathy. Front Mol Neurosci. 2019;12:88. - PMC - PubMed
    2. Qin X, Cheng J, Zhong Y, Mahgoub OK, Akter F, Fan Y. et al. Mechanism and treatment related to oxidative stress in neonatal hypoxic-ischemic encephalopathy. Front Mol Neurosci. 2019;12:88. - PMC - PubMed

LinkOut - more resources