. 2021 Dec 31:2021:6265553.
doi: 10.1155/2021/6265553. eCollection 2021.

Expression of Otx Genes in Müller Cells Using an In Vitro Experimental Model of Retinal Hypoxia

Affiliations

Expression of Otx Genes in Müller Cells Using an In Vitro Experimental Model of Retinal Hypoxia

Claudio Azzolini et al. J Ophthalmol. .

Abstract

Introduction: Müller glial cells typically activate to react to hypoxic tissue damage in several retinal diseases. We evaluated the in vitro response to a hypoxia-mimicking stimulus on the expression of a set of genes, known to contribute to eye morphogenesis and cell differentiation.

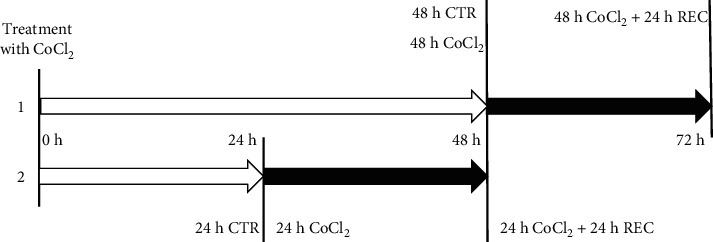
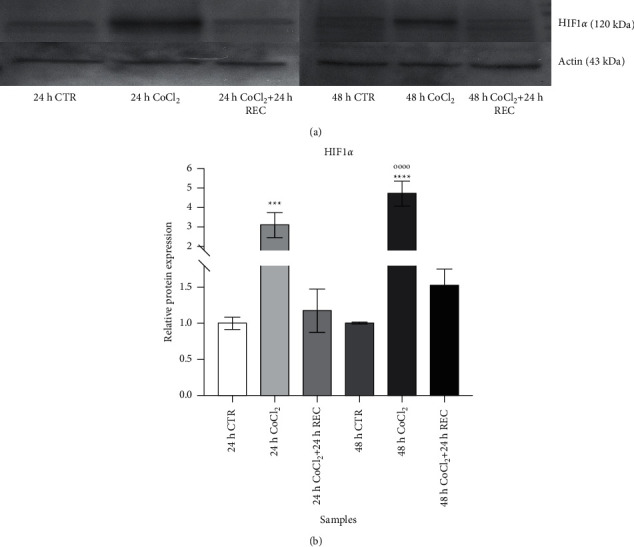
Materials and methods: A MIO-M1 Müller cell line was cultured in a hypoxia-mimicking environment by the addition of cobalt chloride to the culture medium, followed by a recovery time in which we mimic restoration from the hypoxic insult. The HIF-1α protein and VEGF-A gene expression were quantified to verify the induction of a hypoxia-like state.

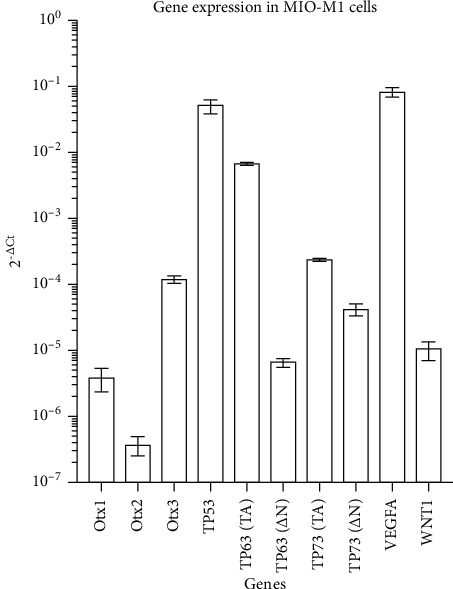
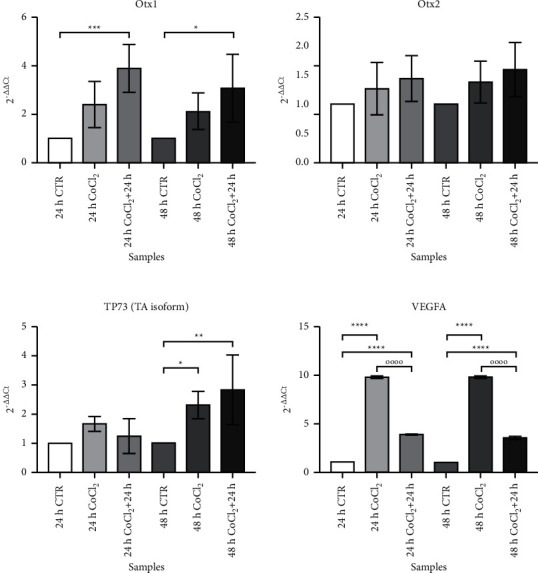
Results: Among the genes under study, we did not observe any difference in the expression levels of Otx1 and Otx2 during treatment; conversely, Otx1 was overexpressed during recovery steps. The VEGF-A gene was strongly upregulated at both the CoCl2 and recovery time points. The transactivated isoform (TA) of the TP73 gene showed an overexpression in long-term exposure to the hypoxic stimulus with a further increase after recovery. Discussion. Our molecular analysis is able to describe the activation of a set of genes, never before described, that can drive the response to a hypoxia-like status. The improved comprehension of these cellular events will be useful for designing new therapeutical approaches for retinal pathologies.


Conflict of interest statement

The authors declare no conflicts of interest.

Figures

Figure 1
Figure 1
Schematic representation of two CoCl2 treatments. (1) Exposure of MIO-M1 cells to 100 µM CoCl2 for 48 h followed by 24 h of recovery in a complete medium (DMEM + 10% FBS + 1% L-Glut + 1% Pen/Strep). (2) 24 h exposure to 100 µM CoCl2 followed by 24 h of recovery. CTR: control sample. White arrow: medium added with CoCl2. Black arrow: medium without CoCl2. Black vertical lines indicate timepoints of cell collection.
Figure 2
Figure 2
Morphological analysis of MIO-M1 Müller cells in different experimental conditions. (a) CTR 24 h; (b) 24 h CoCl2; (c) 24 h CoCl2 + 24 h REC; (d) CTR 48 h; (e) 48 h CoCl2; and (f) 48 h CoCl2 + 24 h REC. Black bar: 100 μM.
Figure 3
Figure 3
Analysis of HIF-1α and β-actin protein expression levels by western blot evaluated in MIO-M1 cells at different time points of treatment. (a) Representative immunoreactive bands for HIF-1α (top; 120 kDa) and β-actin (bottom; 43 kDa). For each sample, 200 μg of protein was loaded on SDS-8% polyacrylamide gel. (b) Relative expression of HIF-1α protein, normalized to the respective β-actin, is represented as mean ± SD of three repeated experiments. ∗∗∗p < 0.001 (24 h CoCl2 vs. 24 h CTR); ∗∗∗∗p < 0.0001 (48 h CoCl2 vs. 24 h CTR); and p < 0.0001 (48 h CoCl2 vs. 48 h CTR) by one-way ANOVA and Tukey's post hoc test.
Figure 4
Figure 4
Molecular characterization of gene expression in untreated MIO-M1 cells. Each gene was normalized to β-actin expression level, to obtain a value representing the fold change between the two analyzed genes. On the Y-axis, the fold change value is reported. Each value is indicated as median ± SD.
Figure 5
Figure 5
qRT-PCR on CTR- and CoCl2-treated MIO-M1 Müller cells. Each graph represents the expression levels of a single studied gene in different experimental conditions. All values are indicated as median ± SD. On the Y-axis, the fold change value is reported. Statistical analysis was performed by one-way ANOVA and Tukey's post hoc test. p < 0.05; ∗∗p < 0.01; ∗∗∗p < 0.001; and ∗∗∗∗p < 0.0001.

Similar articles

Cited by

References

    1. Willbold E., Layer P. G. Müller glia cells and their possible roles during retina differentiation in vivo and in vitro. Histology & Histopathology . 1998;13(2):531–552. - PubMed
    1. Huxlin K. R., Sefton A. J., Furby J. H. The origin and development of retinal astrocytes in the mouse. Journal of Neurocytology . 1992;21(7):530–544. doi: 10.1007/bf01186955. - DOI - PubMed
    1. Todd L., Suarez L., Quinn C., Fischer A. J. Retinoic acid-signaling regulates the proliferative and neurogenic capacity of Müller glia-derived progenitor cells in the avian retina. Stem Cells . 2018;36(3):392–405. doi: 10.1002/stem.2742. - DOI - PMC - PubMed
    1. Bringmann A., Pannicke T., Grosche J., et al. Müller cells in the healthy and diseased retina. Progress in Retinal and Eye Research . 2006;25(4):397–424. doi: 10.1016/j.preteyeres.2006.05.003. - DOI - PubMed
    1. Pournaras C. J., Rungger-Brändle E., Riva C. E., Hardarson S. H., Stefansson E. Regulation of retinal blood flow in health and disease. Progress in Retinal and Eye Research . 2008;27(3):284–330. doi: 10.1016/j.preteyeres.2008.02.002. - DOI - PubMed

LinkOut - more resources