

Optical property recovery with spatially-resolved diffuse reflectance at short source-detector separations using a compact fiber-optic probe
- PMID: 35003841
- PMCID: PMC8713658
- DOI: 10.1364/BOE.443332
Optical property recovery with spatially-resolved diffuse reflectance at short source-detector separations using a compact fiber-optic probe
Abstract
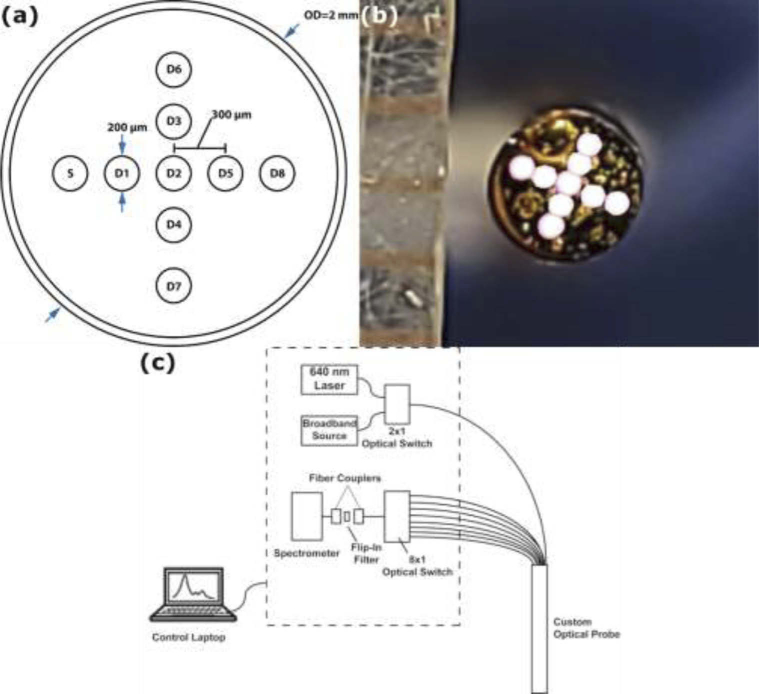
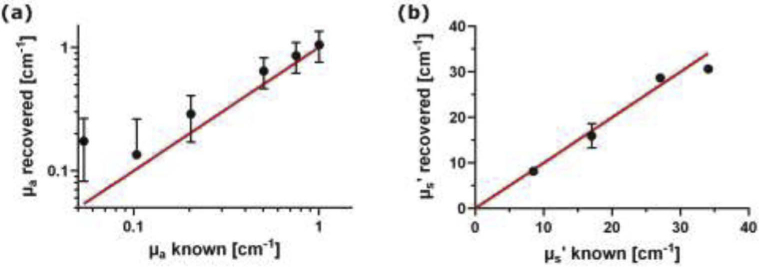
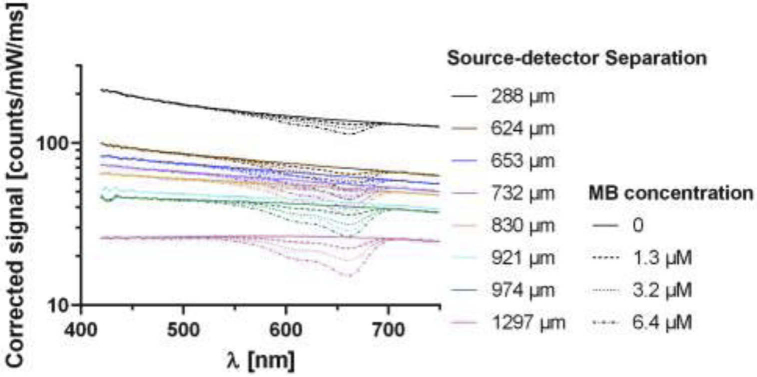
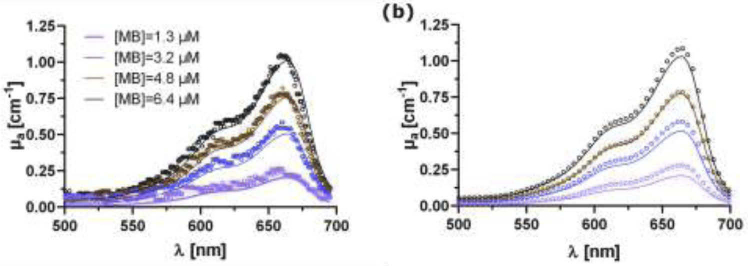
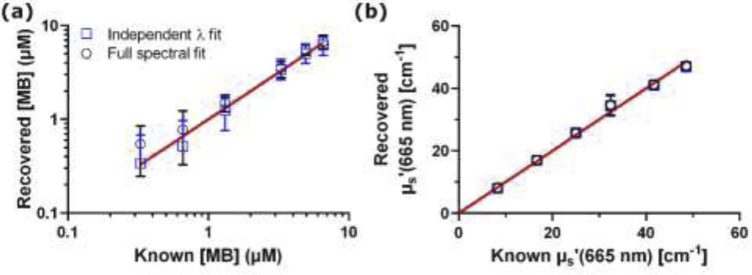
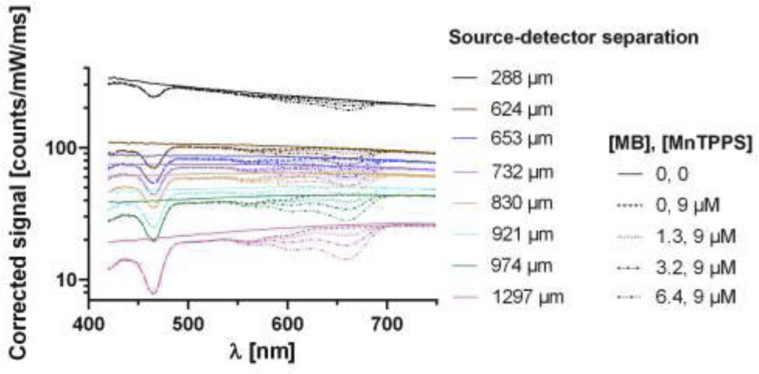
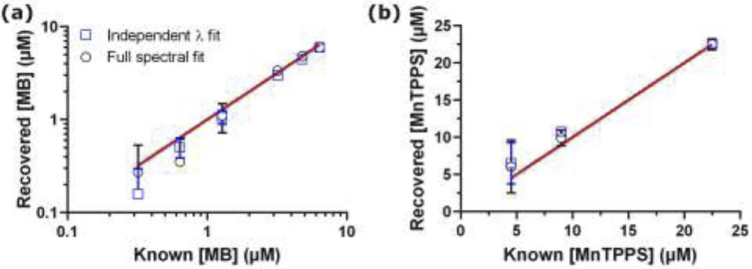
We describe a compact fiber-optic probe (2 mm outside diameter) that utilizes spatially-resolved diffuse reflectance for tissue optical property recovery. Validation was performed in phantoms containing Intralipid 20% as scatterer, and methylene blue (MB), MnTPPS, and/or India ink as absorbers. Over a range of conditions, the reduced scattering coefficient was recovered with a root mean square error (RMSE) of 0.86-2.7 cm-1 (average error = 3.8%). MB concentration was recovered with RMSE = 0.26-0.52 µM (average error = 15.0%), which did not vary with inclusion of MnTPPS (p=0.65). This system will be utilized to determine optical properties in human abscesses, in order to generate treatment plans for photodynamic therapy.
© 2021 Optical Society of America under the terms of the OSA Open Access Publishing Agreement.
Conflict of interest statement
The authors declare no conflicts of interest.
Figures
Similar articles
-
Application of transfer learning for rapid calibration of spatially resolved diffuse reflectance probes for extraction of tissue optical properties.J Biomed Opt. 2024 Feb;29(2):027004. doi: 10.1117/1.JBO.29.2.027004. Epub 2024 Feb 28. J Biomed Opt. 2024. PMID: 38419753 Free PMC article.
-
Fluorescence and diffuse reflectance provide similar accuracy in recovering fluorophore concentration at short source-detector separations.J Mod Opt. 2022;69(12):699-704. doi: 10.1080/09500340.2022.2074159. Epub 2022 May 11. J Mod Opt. 2022. PMID: 36035874 Free PMC article.
-
Application of Transfer Learning for Rapid Calibration of Spatially-resolved Diffuse Reflectance Probes for Extraction of Tissue Optical Properties.bioRxiv [Preprint]. 2023 Nov 5:2023.10.23.563629. doi: 10.1101/2023.10.23.563629. bioRxiv. 2023. Update in: J Biomed Opt. 2024 Feb;29(2):027004. doi: 10.1117/1.JBO.29.2.027004. PMID: 37961112 Free PMC article. Updated. Preprint.
-
Fiber-optic probe for noninvasive real-time determination of tissue optical properties at multiple wavelengths.Appl Opt. 2001 Mar 1;40(7):1155-64. doi: 10.1364/ao.40.001155. Appl Opt. 2001. PMID: 18357101
-
Influence of the phase function in generalized diffuse reflectance models: review of current formalisms and novel observations.J Biomed Opt. 2014;19(7):75005. doi: 10.1117/1.JBO.19.7.075005. J Biomed Opt. 2014. PMID: 25027000 Free PMC article. Review.
Cited by
-
Principles, developments, and applications of spatially resolved spectroscopy in agriculture: a review.Front Plant Sci. 2024 Jan 10;14:1324881. doi: 10.3389/fpls.2023.1324881. eCollection 2023. Front Plant Sci. 2024. PMID: 38269139 Free PMC article. Review.
-
First in human measurements of abscess cavity optical properties and methylene blue uptake prior to photodynamic therapy by in vivo diffuse reflectance spectroscopy.J Biomed Opt. 2024 Feb;29(2):027002. doi: 10.1117/1.JBO.29.2.027002. Epub 2024 Feb 27. J Biomed Opt. 2024. PMID: 38414658 Free PMC article. Clinical Trial.
-
Devices and Methods for Dosimetry of Personalized Photodynamic Therapy of Tumors: A Review on Recent Trends.Cancers (Basel). 2024 Jul 8;16(13):2484. doi: 10.3390/cancers16132484. Cancers (Basel). 2024. PMID: 39001546 Free PMC article. Review.
-
Photodynamic Therapy of an Abdominal Abscess at the Time of Percutaneous Drainage.Cardiovasc Intervent Radiol. 2023 Sep;46(9):1292-1294. doi: 10.1007/s00270-023-03504-z. Epub 2023 Jul 18. Cardiovasc Intervent Radiol. 2023. PMID: 37464107 Free PMC article. No abstract available.
-
Application of transfer learning for rapid calibration of spatially resolved diffuse reflectance probes for extraction of tissue optical properties.J Biomed Opt. 2024 Feb;29(2):027004. doi: 10.1117/1.JBO.29.2.027004. Epub 2024 Feb 28. J Biomed Opt. 2024. PMID: 38419753 Free PMC article.
References
-
- Kienle A., Lilge L., Patterson M. S., Hibst R., Steiner R., Wilson B.C., “Spatially resolved absolute diffuse reflectance measurements fornoninvasive determination of the optical scattering and absorption coefficientsof biological tissue,” Appl. Opt. 35(13), 2304–2314 (1996).10.1364/AO.35.002304 - DOI - PubMed
-
- van Veen R., Sterenborg H., Pifferi A., Torricelli A., Chikoidze E., Cubeddu R., “Determination of visible near-IR absorption coefficients of mammalian fat using time- and spatially resolved diffuse reflectance and transmission spectroscopy,” J. Biomed. Opt. 10(5), 054004 (2005).10.1117/1.2085149 - DOI - PubMed
Grants and funding
LinkOut - more resources
Full Text Sources
Miscellaneous