

Photoplethysmographic analysis of retinal videodata based on the Fourier domain approach
- PMID: 35003842
- PMCID: PMC8713668
- DOI: 10.1364/BOE.441451
Photoplethysmographic analysis of retinal videodata based on the Fourier domain approach
Abstract
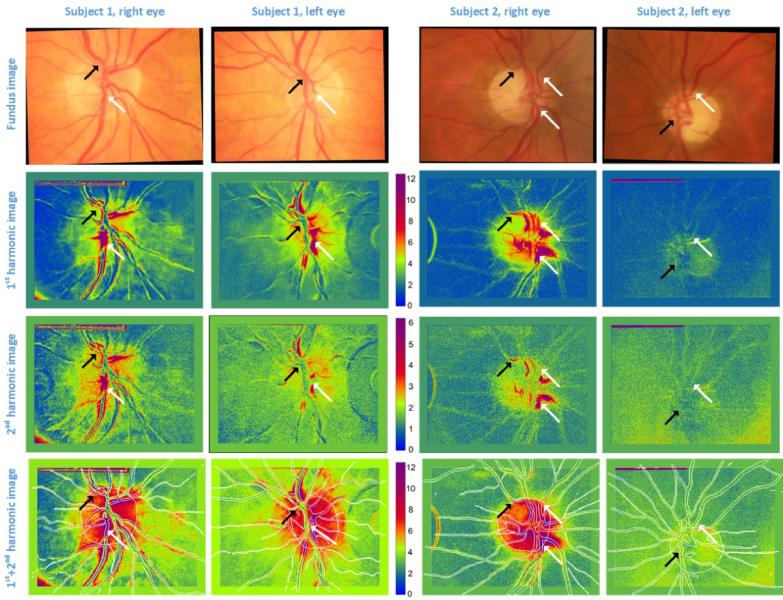
Assessment of retinal blood flow inside the optic nerve head (ONH) and the peripapillary area is an important task in retinal imaging. For this purpose, an experimental binocular video ophthalmoscope that acquires precisely synchronized video sequences of the optic nerve head and peripapillary area from both eyes has been previously developed. It enables to compare specific characteristics of both eyes and efficiently detect the eye asymmetry. In this paper, we describe a novel methodology for the analysis of acquired video data using a photoplethysmographic approach. We describe and calculate the pulsatile attenuation amplitude (PAA) spatial map, which quantifies the maximum relative change of blood volume during a cardiac cycle using a frequency domain approach. We also describe in detail the origin of PAA maps from the fundamental (the first) and the second harmonic component of the pulsatile signal, and we compare the results obtained by time-based and frequency-based approaches. In several cases, we show the advantages and possibilities of this device and the appropriate image analysis approach - fast measurement and comparison of blood flow characteristics of both eyes at a glance, the robustness of this approach, and the possibility of easy detection of asymmetry.
© 2021 Optical Society of America under the terms of the OSA Open Access Publishing Agreement.
Conflict of interest statement
The authors declare no conflicts of interest.
Figures


Similar articles
-
[A new approach for studying the retinal and choroidal circulation].Nippon Ganka Gakkai Zasshi. 2004 Dec;108(12):836-61; discussion 862. Nippon Ganka Gakkai Zasshi. 2004. PMID: 15656089 Review. Japanese.
-
[Aiming for zero blindness].Nippon Ganka Gakkai Zasshi. 2015 Mar;119(3):168-93; discussion 194. Nippon Ganka Gakkai Zasshi. 2015. PMID: 25854109 Review. Japanese.
-
A multi-color video-ophthalmoscopes allows to measure the spectral distribution of light absorption of blood in the human retina.Front Med (Lausanne). 2023 Mar 16;10:1125154. doi: 10.3389/fmed.2023.1125154. eCollection 2023. Front Med (Lausanne). 2023. PMID: 37007778 Free PMC article.
-
Pilot study of the pulsatile neuro-peripapillary retinal deformation in glaucoma and its relationship with glaucoma risk factors.Curr Eye Res. 2017 Dec;42(12):1620-1627. doi: 10.1080/02713683.2017.1362004. Epub 2017 Sep 22. Curr Eye Res. 2017. PMID: 28937876
-
Peripapillary retinal nerve fiber layer and optic nerve head characteristics in eyes with situs inversus of the optic disc.J Glaucoma. 2015 Apr-May;24(4):306-10. doi: 10.1097/IJG.0b013e31829e1ba2. J Glaucoma. 2015. PMID: 24048184
Cited by
-
Assessment of retinal vein pulsation through video-ophthalmoscopy and simultaneous biosignals acquisition.Biomed Opt Express. 2023 May 12;14(6):2645-2657. doi: 10.1364/BOE.486052. eCollection 2023 Jun 1. Biomed Opt Express. 2023. PMID: 37342721 Free PMC article.
-
Comparative analysis of retinal photoplethysmographic spatial maps and thickness of retinal nerve fiber layer.PLoS One. 2023 May 5;18(5):e0284743. doi: 10.1371/journal.pone.0284743. eCollection 2023. PLoS One. 2023. PMID: 37146019 Free PMC article.
-
Compact Monocular Video-Ophthalmoscope to Measure Retinal Reflectance Changes to Flicker Light Stimuli.J Biophotonics. 2025 Jun;18(6):e202400494. doi: 10.1002/jbio.202400494. Epub 2025 Mar 11. J Biophotonics. 2025. PMID: 40065742 Free PMC article.
References
-
- Konishi N., Tokimoto Y., Kohra K., Fujii H., “New laser speckle flowgraphy system using CCD camera,” Opt. Rev. 9(4), 163–169 (2002).10.1007/s10043-002-0163-4 - DOI
-
- Mursch-Edlmayr A. S., Luft N., Podkowinski D., Ring M., Schmetterer L., Bolz M., “Laser speckle flowgraphy derived characteristics of optic nerve head perfusion in normal tension glaucoma and healthy individuals: a Pilot study,” Sci. Rep. 8(1), 5343 (2018).10.1038/s41598-018-23149-0 - DOI - PMC - PubMed
LinkOut - more resources
Full Text Sources