. 2021 Nov 30;12(12):7849-7871.
doi: 10.1364/BOE.439900. eCollection 2021 Dec 1.

Extraction of phase-based optoretinograms (ORG) from serial B-scans acquired over tens of seconds by mouse retinal raster scanning OCT system

Affiliations

Extraction of phase-based optoretinograms (ORG) from serial B-scans acquired over tens of seconds by mouse retinal raster scanning OCT system

Ewelina Pijewska et al. Biomed Opt Express. .

Abstract

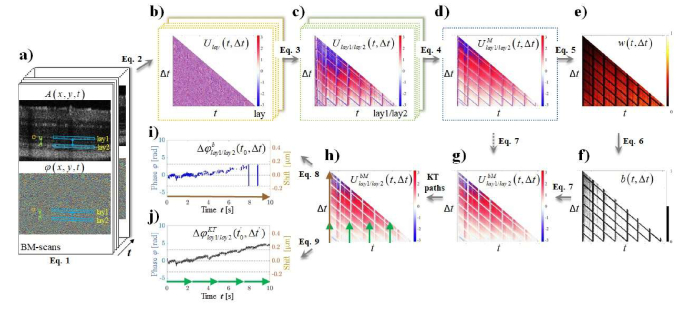
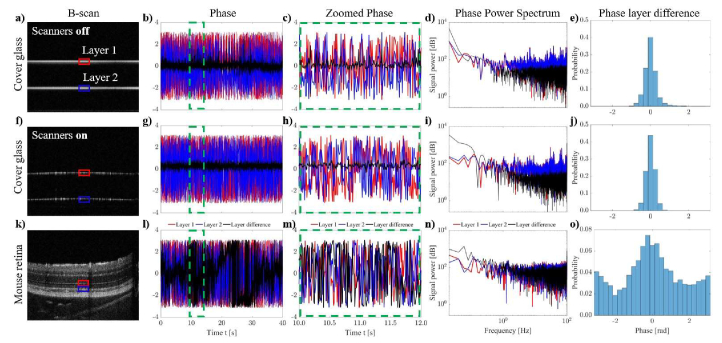
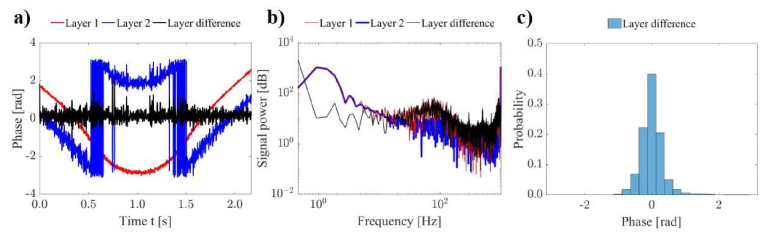
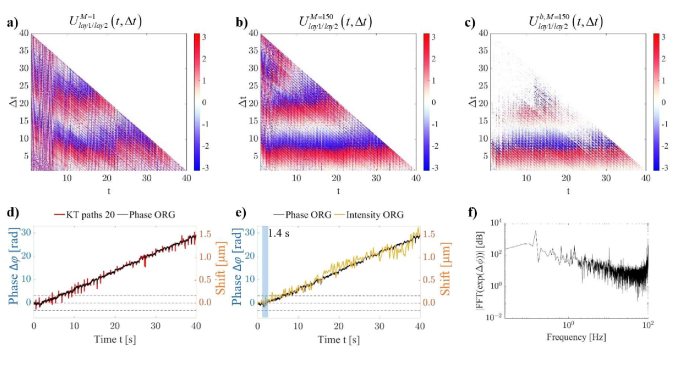
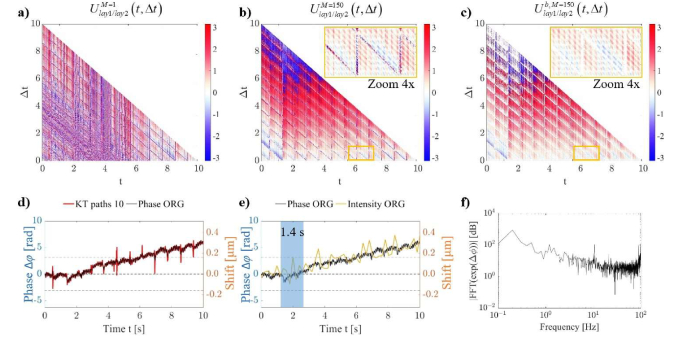
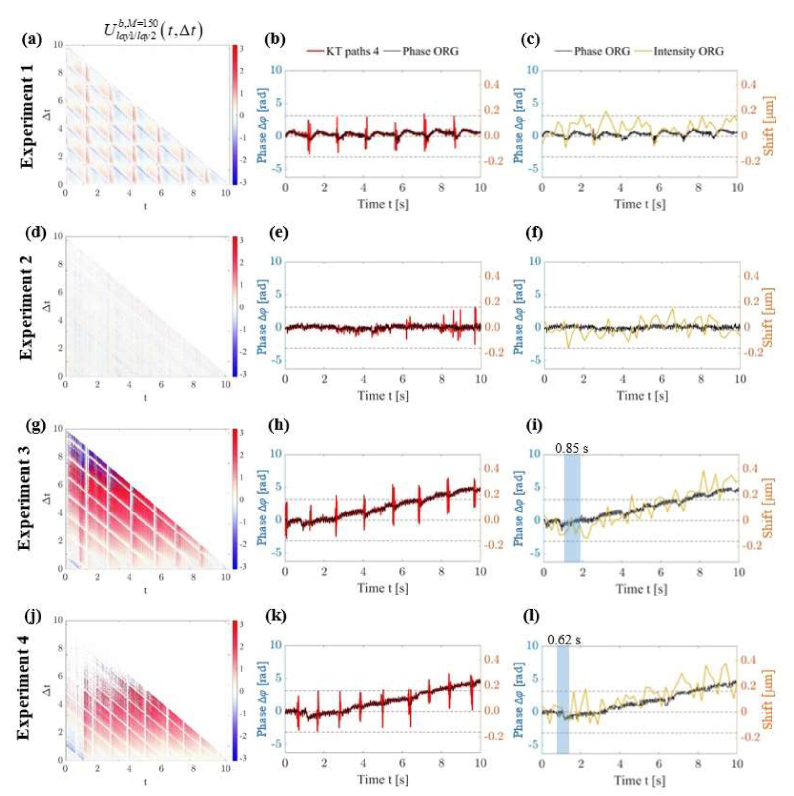
Several specialized retinal optical coherence tomography (OCT) acquisition and processing methods have been recently developed to allow in vivo probing of light-evoked photoreceptors function, focusing on measurements in individual photoreceptors (rods and cones). Recent OCT investigations in humans and experimental animals have shown that the outer segments in dark-adapted rods and cones elongate in response to the visible optical stimuli that bleach fractions of their visual photopigment. We have previously successfully contributed to these developments by implementing OCT intensity-based "optoretinograms" (ORG), the paradigm of using near-infrared OCT (NIR OCT) to measure bleaching-induced back-scattering and/or elongation changes of photoreceptors in the eye in vivo. In parallel, several groups have successfully implemented phase-based ORGs, mainly in human studies, exploiting changes in the phases of back-scattered light. This allowed more sensitive observations of tiny alterations of photoreceptors structures. Applications of the phase-based ORG have been implemented primarily in high speed and cellular resolution AO-OCT systems that can visualize photoreceptor mosaic, allowing phase measurements of path length changes in outer segments of individual photoreceptors. The phase-based ORG in standard resolution OCT systems is much more demanding to implement and has not been explored extensively. This manuscript describes our efforts to implement a phase analysis framework to retinal images acquired with a standard resolution and raster scanning OCT system, which offers much lower phase stability than line-field or full-field OCT detection schemes due to the relatively slower acquisition speed. Our initial results showcase the successful extraction of phase-based ORG signal from the B-scans acquired at ∼100 Hz rate and its favorable comparison with intensity-based ORG signal extracted from the same data sets. We implemented the calculation of phase-based ORG signals using Knox-Thompson paths and modified signal recovery by adding decorrelation weights. The phase-sensitive ORG signal analysis developed here for mouse retinal raster scanning OCT systems could be in principle extended to clinical retinal raster scanning OCT systems, potentially opening doors for clinically friendly ORG probing.


Conflict of interest statement

The authors declare that there are no conflicts of interest related to this article.

Figures

Fig. 1.
Fig. 1.
Outline of the processing steps for phase-based ORG signal extraction, with visualization of intermediate results. (a) OCT BM-Scans. (b) Time evolution of the cross-spectrum phase from single point in the retina (lay), representative position of point is marked by orange rectangle in (a). (c) Time evolution of a phase difference of the cross spectrum between two spatially separated points from two layers (lay1 & lay2), representative position of points is marked by two green rectangles in (a). (d) Time evolution of a phase difference of the averaged cross spectrum, over window od size M, between two spatially separated layers (lay1 & lay2), representative position of windows is marked by two blue rectangles in (a). (e) Weights w showing phase correlation between points within the window M. (f) Binary-valued weights b, calculated to extract well-defined regions of phase cross-spectrum. (g) Reduced weighted time evolution of a phase difference of the averaged cross spectrum from (d). (h) Visualization of phase extraction paths from g, brown arrow (along the first (left) vertical line) and green arrows (using the Knox-Thompson paths). (i) Time-dependent phase difference between two layers extracted using single path. (j) Time-dependent phase difference between two layers extracted using the Knox-Thompson paths. See Eq. (1–9) in text for details regarding mathematical operations.
Fig. 2.
Fig. 2.
Signal analysis of the temporal phase stability. The first column presents an example of one OCT B-scan, from series of BM-scans, for glass plate (a, f) and mouse retina (k). The second column presents phase stability for edges of the coverslip glass in the sample channel with the scanners off (b) and on (g), and for layers in a scanned mouse retina (l). Red and blue colors correspond to phase calculated from layers 1 & 2 marked by rectangles with corresponding colors in (a, f, k). The black line shows the phase difference between the signal from layers 1 and 2. The third column presents the magnified phase results from (b, g, l) - seconds 10 to 12 marked by a dashed green line. The fourth column shows temporal Phase Power Spectrum (FFT of phase signals from layers 1–2 and the phase difference between layers). The fifth column shows a phase histogram for corresponding data sets.
Fig. 3.
Fig. 3.
Signal analysis of temporal phase stability for 100 kHz A-scan acquisition (cond. I). (a) Phase stability for edges of the coverslip glass in the sample channel with the scanners off. Red and blue colors correspond to phase calculated from layers 1 & 2 marked by rectangles with corresponding colors in Fig. 1(a). The black line shows the phase difference between the signal from layers 1 and 2. (b) Temporal Phase Power Spectrum (FFT of phase signals from layers 1–2 and for the phase difference between layers). c) Histogram for phase difference.
Fig. 4.
Fig. 4.
Estimation of phase noise theoretically – SNR-based (red line) and experimentally (black line) for a glass plate with scan off (a) and mouse retina with scan on (b). Coefficient of determination for (a) and (b) is equal R2 = 0.99.
Fig. 5.
Fig. 5.
Phase stability during measurement of a mouse retina. (a & e) The OCT intensity in log10 scale of B-scan #2 and #1060 was collected in time 0.01 s and 10.59 s from the first reference B-scan. The red and blue rectangles indicate ELM and BrM layers accordingly. The yellow dashed lines presented a range of A-scans that were taken to analyze with Knox-Thompson paths. (b & f) Reference phase of first B-scan in radians. The color scale bars (b-d & f-h) indicate values of phase from –π to π from blue to red, respectively. (c & g) The phase of B-scans collected in time 0.01 s and 10.59 s from the first reference B-scan, respectively. (d & h) The phase difference between phases of first reference B-scan and B-scan collected after time interval Δt. The phase stability over time is presented in Visualization 1.avi.
Fig. 6.
Fig. 6.
The results of the control experiment (no visible light stimulation) in the mouse retina with a distance between ELM and BrM layers followed over 40 s. (a) The phase of Ulay1/lay2M=1 cross-spectra layer differences for one A-scan. (b) Result of averaging M = 150 cross-spectra differences Ulay1/lay2M=150 for ELM and BrM layers. A-scan range taken to average is shown in Fig. 4(a,c). (c) The binary map b was used to threshold and remove less correlated phasors. The white region indicates a well-defined phase signal that could be taken to analyze. (d) Comparison of Knox-Thompson signal without thresholding (red line) and with weights (black line). (e) Comparison ORG phase-based signal with ORG intensity-based signal. The ORG phase signal was reconstructed from Π=5 Knox-Thompson paths. (f) Power spectrum (FFT of phase signals from ELM and BrM layers).
Fig. 7.
Fig. 7.
Magnified results of the distance between ELM and BrM layers in the first 10 s without light stimulus. (a) The phase of Ulay1/lay2M=1 cross-spectra layer differences for one A-scan. (b) Result of averaging M = 150 cross-spectra differences Ulay1/lay2M=150 for ELM and BrM layers. A-scan range taken to average is shown in Fig. 4(a). (c) The averaged Ulay1/lay2b,M=150 signal after thresholding to remove less correlated phasors. The yellow rectangles in (b-c) indicate a region where we can see decorrelated signal reduction using weights. (d) Comparison of Knox-Thompson signal without thresholding (red line) and with weights (black line). (e) Comparison ORG phase-based signal with ORG intensity-based signal. The ORG phase signal was reconstructed from Π=10 Knox-Thompson paths. (f) The power spectrum for phase difference signal (FFT of time-varying phase signals from ELM and BrM layers).
Fig. 8.
Fig. 8.
Phase stability during measurement of the light-evoked responses of the mouse retina. (a & e) The OCT intensity in log10 scale of B-scan #2 and #1060 was collected in time 0.01 s and 10.59 s from the first reference B-scan. The red and blue rectangles indicate ELM and BrM layers accordingly. The yellow dashed lines presented a range of A-scans that were taken to analyze with Knox-Thompson paths. (b & f) Reference phase of first B-scan in radians. The color scale bars (b-d & f-h) indicate values of phase from –π to π from blue to red, respectively. (c & g) The phase of B-scans collected in time 0.01 s and 10.59 s from the first reference B-scan, respectively. (d & h) The phase difference between phases of first reference B-scan and B-scan collected after time interval Δt. The phase stability over time is presented in Visualization 2.avi.
Fig. 9.
Fig. 9.
The light-evoked activity of the mouse retina for ELM and BrM layers. (a) The phase of Ulay1/lay2M=1 cross-spectra layer differences for one A-scan with light stimulus. (b) Result of averaging M = 150 cross-spectra differences Ulay1/lay2M=150 for ELM and BrM layers. A-scan range taken to average is shown in Fig. 8(a). (c) The averaged Ulay1/lay2b,M=150 signal after thresholding to remove less correlated phasors. (d) Comparison of Knox-Thompson signal without thresholding (red line) and with weights (black line). (e) Comparison ORG phase-based signal with ORG intensity-based signal. The ORG phase signal was reconstructed from Π=20 Knox-Thompson paths. (f) The power spectrum for phase difference signal (FFT of phase signals from ELM and BrM layers).
Fig. 10.
Fig. 10.
Magnified results of the light-evoked activity of the mouse retina for ELM and BrM layers in the first 10 s in response to 1.41 s of light stimulation. (a) The phase of Ulay1/lay2M=1 cross-spectra layer differences for one A-scan with light stimulus. (b) Result of averaging M = 150 cross-spectra differences Ulay1/lay2M=150 for ELM and BrM layers. A-scan range taken to average is shown in Fig. 7(a). (c) The averaged Ulay1/lay2b,M=150 signal after thresholding to remove less correlated phasors. The yellow rectangles in (b-c) indicate a region where we can see decorrelated signal reduction using weights. (d) Comparison of Knox-Thompson signal without thresholding and (red line) with weights (black line). (e) Comparison ORG phase-based signal with ORG intensity-based signal. The ORG phase signal was reconstructed from Π=10 Knox-Thompson paths. The blue rectangle indicates light exposure time. (f) The power spectrum for phase difference signal (FFT of phase signals from ELM and BrM layers).
Fig. 11.
Fig. 11.
The results of additional control experiment (Experiment 1 & 2) and light-evoked activity experiment (Experiment 3 & 4) of the mouse retina showing the distance between ELM and BrM layers in the first 10 s in response to 0.85 s (Experiment 3) and 0.62 s (Experiment 4) light stimulation. (a, d, g, j) The averaged Ulay1/lay2b,M=150 signals after thresholding to remove less correlated phasors are shown for each experiment. (b, e, h, k) Comparison of Knox-Thompson signal without thresholding (red line) and with weights (black line) for each experiment, respectively. (c, f, i, l) Comparison between ORG phase-based signal with ORG intensity-based signal. The ORG phase-based signal was reconstructed from Π=4 Knox-Thompson paths and threshold b = 0.03. The blue rectangle indicates blue light exposure time.

Similar articles

Cited by

References

    1. Izatt J. A., Swanson E. A., Fujimoto J. G., Hee M. R., Owen G. M., “Optical coherence microscopy in scattering media,” Opt. Lett. 19(8), 590–592 (1994).10.1364/OL.19.000590 - DOI - PubMed
    1. Wojtkowski M., Srinivasan V. J., Ko T. H., Fujimoto J. G., Kowalczyk A., Duker J. S., “Ultrahigh-resolution, high-speed, Fourier domain optical coherence tomography and methods for dispersion compensation,” Opt. Express 12(11), 2404 (2004).10.1364/OPEX.12.002404 - DOI - PubMed
    1. Huang D., Swanson E. A., Lin C. P., Schuman J. S., Stinson W. G., Chang W., Hee M. R., Flotte T., Gregory K., Puliafito C. A., Fujimoto J. G., “Optical coherence tomography,” Science 254(5035), 1178–1181 (1991).10.1126/science.1957169 - DOI - PMC - PubMed
    1. Szkulmowska A., Szkulmowski M., Kowalczyk A., Wojtkowski M., “Phase-resolved Doppler optical coherence tomography—limitations and improvements,” Opt. Lett. 33(13), 1425 (2008).10.1364/OL.33.001425 - DOI - PubMed
    1. Izatt J. A., Yazdanfar S., “Self-referenced Doppler optical coherence tomography,” Opt. Lett. 27(23), 2085–2087 (2002).10.1364/OL.27.002085 - DOI - PubMed