. 2021 Dec 15;11(6):492-506.
eCollection 2021.

Regional changes with global brain hypometabolism indicates a physiological triage phenomenon and can explain shared pathophysiological events in Alzheimer's & small vessel diseases and delirium

Affiliations

Regional changes with global brain hypometabolism indicates a physiological triage phenomenon and can explain shared pathophysiological events in Alzheimer's & small vessel diseases and delirium

Sandeep K Gupta et al. Am J Nucl Med Mol Imaging. .

Abstract

While reduced global brain metabolism is known in aging, Alzheimer's disease (AD), small vessel disease (SVD) and delirium, explanation of regional brain metabolic (rBM) changes is a challenge. We hypothesized that this may be explained by "triage phenomenon", to preserve metabolic supply to vital brain areas. We studied changes in rBM in 69 patients with at least 5% decline in global brain metabolism during active lymphoma. There was significant decline in the rBM of the inferior parietal, precuneus, superior parietal, lateral occipital, primary visual cortices (P<0.001) and in the right lateral prefrontal cortex (P=0.01). Some areas showed no change; multiple areas had significantly increased rBM (e.g. medial prefrontal, anterior cingulate, pons, cerebellum and mesial temporal cortices; P<0.001). We conclude the existence of a physiological triage phenomenon and argue a new hypothetical model to explain the shared events in the pathophysiology of aging, AD, SVD and delirium.

Keywords: Alzheimer’s disease; aging; cerebral metabolism; cerebral perfusion; delirium; dementia; small vessel disease.


Conflict of interest statement

None.

Figures
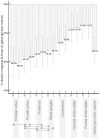
Figure 1
Figure 1
Relative % reduction in SUVmax in some cortical and subcortical regions with global hypometabolism (as measured manually by drawing region of interests). % reduction in global hypometabolism is on the far-right column for reference only. For each area, R= right & L= left hemisphere, as depicted on x-axis. Each bar represents mean % decline; 95% CI of mean is also shown with solid lines. Paired analysis between the individual regions of the same hemisphere (except white matter) was performed to assess difference. A total of ten pair combinations in each hemisphere were possible. The relative decline in all the areas is significantly different to others except four regions “bilaterally” (P>0.05). These non-significantly different combination pairs are shown in light green horizontal bars at the bottom of the image.
Figure 2
Figure 2
Relative % regional metabolic changes in various grey matter areas with global hypometabolism (as measured by automated uptake scores using CortexID software). All patients (n=69) values are shown by coloured circles and mean +95% CI is shown by black solid bars. X-axis denotes areas (in ascending mean % changes) and Y-axis denotes % changes (increase or decrease). The areas with statistically significant decline are shown in red, significant increase are shown with green whereas nonsignificant (P>0.05) change is shown with blue circles. Paired analyses of all the individual areas compared all the other areas in the same hemisphere were performed, which showed no significant differences between the paired areas depicted at the bottom of the image with solid horizontal bars. The green bars indicate no differences in both hemispheric regions whereas blue bars indicate no statistical differences only in unilateral hemisphere pair combination. Pons and cerebellum had a single value. Difference between all the other pair combinations was statistically significant. (In automated analyses, cerebellum and pons are analysed as a single region rather than right or left).
Figure 3
Figure 3
Male versus female changes in rBM per 1% drop in gBM. Mean values are shown by dotted lines and 95% CI of mean by solid bars for males (blue bars) and females (pink bars). Note that females have relative more metabolic decline in regions mentioned in left side of the figure as well as more metabolic increase in regions mentioned in right side of the figure. This indicates more pronounced triage phenomenon in females compared to males when there is similar degree of reduction in gBM. The statistically significant regions are highlighted with green font. (In automated analyses, cerebellum and pons are analysed as a single region rather than right or left).
Figure 4
Figure 4
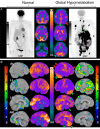
FDG PET images of a 73-year old female with DLBCL. The left two columns represent images with normal brain metabolism and images when global hypometabolism are shown in right two columns. The two imaging are five months apart. A. Only minor changes in MIP imaging (1st column) and three axial brain slices (2nd column). However with a 67.7% reduction in total brain metabolism with lymphoma (MIP image 4th column), matched axial slices show reduced rBM in parietal (red arrow) & parieto-occipital (red arrow head) cortices whereas increased metabolism in anterior cingulate & mesial temporal cortices (green arrow) and cerebellum (green arrow head). B. The Stereotactic Surface Projection- Uptake Ratio images are shown in 1st and 4th column and Uptake Ratio MIP images generated by cortex ID software (normalized to global brain) are shown in 2nd and 3rd columns. RL- Right lateral; RM- Right medial; LL: Left lateral; LM: Left medial. The reduced metabolic areas are shown with red arrows and increased metabolic areas are shown with green arrows and arrow heads.
Figure 5
Figure 5
Hypothetical model of pathophysiological interaction between the acute and chronic pathologies on brain perfusion and clinical outcome. Aging is the most important template for all the diseases but SVD is the second largest contributor. SVD can be due to acute or chronic illnesses (including partly AD). While acute illness are potentially reversible, some residual deficits contribute to chronic illnesses especially when multiple episodes. Chronic SVD is not only from vascular risk factors but also from AD. Hence a majority of perfusion/metabolic abnormalities in AD perhaps due to secondary to that of SVD but additional deficits e.g. posterior cingulate and more severe precuneus involvement is likely unrelated to SVD pattern. All these illnesses lead to global cerebral hypoperfusion/hypometabolism and due to triage, there is relatively more ischemic BBB injury, neuroinflammation leading to a vicious cycle whereby more toxic systemic materials can penetrate the brain. The outcome can be acute whereby depending on severity of disease and age, this may be asymptomatic (Cognitively unimpaired CU) or may lead to sickness behaviour or delirium. Chronic outcomes may be either asymptomatic or minimal cognitive impairment or dementia.
Figure 6
Figure 6
Hypothetical model of relationship of cerebral perfusion/metabolism and natural course in acute and chronic conditions. The x-axis represents increasing age and y-axis represents declining global cerebral perfusion/metabolism (not to scale). Firstly, healthy aging (solid grey line) leads to progressive reduction in brain perfusion/metabolic changes, but these are more pronounced with AD (AD-solid red line), SVD (SVD-solid blue line) and even more pronounced with both AD + SVD (solid purple line). With all conditions, decline in perfusion is slow in early age but is more rapid in middle age onwards. Secondly, each episode of acute pathology (as shown with dotted line spikes) alters the natural course of disease to worsening as shown by dotted lines of respective colours. In younger age, acute illness has only minimal or nil longer-term consequences but middle age onwards each episode is associated with more residual perfusion deficit as shown with altered natural course shown by dotted lines. Thirdly, in younger age, recovery from even a severe acute illness is quicker, but with advancing age, the recovery is slower even with mild acute illness (as shown by widening of spikes). Finally, threshold for symptoms varies with aging. Small decline in brain perfusion is asymptomatic but more severe decline can lead to sickness behaviour (or mild cognitive decline if chronic) or delirium (or dementia if chronic). The symptoms vary with patients’ cognitive reserve, age, genetic profile and comorbidities e.g. vascular pathologies, anaemia, hypoxia etc.

Similar articles

References

    1. Fong TG, Vasunilashorn SM, Libermann T, Marcantonio ER, Inouye SK. Delirium and Alzheimer disease: a proposed model for shared pathophysiology. Int J Geriatr Psychiatry. 2019;34:781–789. - PMC - PubMed
    1. Jagust W. Imaging the evolution and pathophysiology of Alzheimer disease. Nat Rev Neurosci. 2018;19:687–700. - PMC - PubMed
    1. Fu H, Hardy J, Duff KE. Selective vulnerability in neurodegenerative diseases. Nat Neurosci. 2018;21:1350–1358. - PMC - PubMed
    1. Kato T, Inui Y, Nakamura A, Ito K. Brain fluorodeoxyglucose (FDG) PET in dementia. Ageing Res Rev. 2016;30:73–84. - PubMed
    1. Kawasaki K, Ishii K, Saito Y, Oda K, Kimura Y, Ishiwata K. Influence of mild hyperglycemia on cerebral FDG distribution patterns calculated by statistical parametric mapping. Ann Nucl Med. 2008;22:191–200. - PubMed

LinkOut - more resources