The use of 68Ga-EDTA PET allows detecting progressive decline of renal function in rats
- PMID: 35003889
- PMCID: PMC8727875
The use of 68Ga-EDTA PET allows detecting progressive decline of renal function in rats
Abstract
Introduction: Evaluation of glomerular filtration rate is very important in both preclinical and clinical setting, especially in the context of chronic kidney disease. It is typically performed using 51Cr-EDTA or by imaging with 123I-Hippuran scintigraphy, which has a significantly lower resolution and sensitivity as compared to PET. 68Ga-EDTA represents a valid alternative due to its quick availability using a 68Ge/68Ga generator, while PET/CT enables both imaging of renal function and accurate quantitation of clearance of activity from both plasma and urine. Therefore, we aimed at investigating the use of 68Ga-EDTA as a preclinical tracer for determining renal function in a knock-in rat model known to present progressive decline of renal function.
Methods: 68Ga-EDTA was injected in 23 rats, either wild type (n=10) or knock-in (n=13). By applying a unidirectional, two-compartment model and Rutland-Patlak Plot linear regression analysis, split renal function was determined from the age of 6 weeks to 12 months.
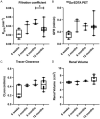
Results: Glomerular filtration ranged from 0.025±0.01 ml/min at 6 weeks to 0.049±0.05 ml/min at 6 months in wild type rats. Glomerular filtration was significantly lower in knock-in rats at 6 and 12 months (P<0.01). No significant difference was observed in renal volumes between knock-in and wild type animals, based on imaging-derived volume calculations.
Conclusions: 68Ga-EDTA turned out to be a very promising PET/CT tracer for the evaluation of split renal function. This method allowed detection of progressive renal impairment in a knock-in rat model. Additional validation in a human cohort is warranted to further assess clinical utility in both, healthy individuals and patients with renal impairment.
Keywords: Glomerular filtration rate; gallium-68 EDTA; positron emission tomography; renal plasma function; rutland-patlak plot.
AJNMMI Copyright © 2021.
Conflict of interest statement
None.
Figures


Similar articles
-
Glomerular filtration rate calculation based on 68Ga-EDTA dynamic renal PET.Am J Nucl Med Mol Imaging. 2022 Apr 15;12(2):54-62. eCollection 2022. Am J Nucl Med Mol Imaging. 2022. PMID: 35535119 Free PMC article.
-
68Ga-EDTA PET/CT imaging and plasma clearance for glomerular filtration rate quantification: comparison to conventional 51Cr-EDTA.J Nucl Med. 2015 Mar;56(3):405-9. doi: 10.2967/jnumed.114.147843. Epub 2015 Feb 12. J Nucl Med. 2015. PMID: 25678493 Clinical Trial.
-
Gallium-68 EDTA PET/CT for Renal Imaging.Semin Nucl Med. 2016 Sep;46(5):448-61. doi: 10.1053/j.semnuclmed.2016.04.002. Semin Nucl Med. 2016. PMID: 27553470 Review.
-
Assessing Glomerular Filtration in Small Animals Using [68Ga]DTPA and [68Ga]EDTA with PET Imaging.Mol Imaging Biol. 2018 Jun;20(3):457-464. doi: 10.1007/s11307-017-1135-1. Mol Imaging Biol. 2018. PMID: 29063303
-
(68)Ga-radiopharmaceuticals for PET imaging of infection and inflammation.Recent Results Cancer Res. 2013;194:189-219. doi: 10.1007/978-3-642-27994-2_11. Recent Results Cancer Res. 2013. PMID: 22918761 Review.
Cited by
-
A Simple Kit for the Good-Manufacturing-Practice Production of [68Ga]Ga-EDTA.Molecules. 2023 Aug 18;28(16):6131. doi: 10.3390/molecules28166131. Molecules. 2023. PMID: 37630382 Free PMC article.
-
Glomerular filtration rate calculation based on 68Ga-EDTA dynamic renal PET.Am J Nucl Med Mol Imaging. 2022 Apr 15;12(2):54-62. eCollection 2022. Am J Nucl Med Mol Imaging. 2022. PMID: 35535119 Free PMC article.
References
-
- Levey AS, Coresh J, Tighiouart H, Greene T, Inker LA. Measured and estimated glomerular filtration rate: current status and future directions. Nat Rev Nephrol. 2020;16:51–64. - PubMed
-
- Levey AS, Perrone RD, Madias NE. Serum creatinine and renal function. Annu Rev Med. 1988;39:465–90. - PubMed
-
- Janssen WM, Beekhuis H, de Bruin R, de Jong PE, de Zeeuw D. Noninvasive measurement of intrarenal blood flow distribution: kinetic model of renal 123I-hippuran handling. Am J Physiol. 1995;269:F571–80. - PubMed
-
- Clausen TD, Kanstrup I, Iversen J. Reference values for 99mTc-MAG3 renography determined in healthy, potential renal donors. Clin Physiol Funct I. 2002;22:356–60. - PubMed
LinkOut - more resources
Full Text Sources
