. 2022 Jan 4;11(1):1993042.
doi: 10.1080/2162402X.2021.1993042. eCollection 2022.

T and NK cell abundance defines two distinct subgroups of renal cell carcinoma

Affiliations

T and NK cell abundance defines two distinct subgroups of renal cell carcinoma

Moon Hee Lee et al. Oncoimmunology. .

Abstract

Renal cell carcinoma (RCC) is considered as an immunogenic cancer. Because not all patients respond to current immunotherapies, we aimed to investigate the immunological heterogeneity of RCC tumors. We analyzedthe immunophenotype of the circulating, tumor, and matching adjacent healthy kidney immune cells from 52 nephrectomy patients with multi-parameter flow cytometry. Additionally, we studied the transcriptomic and mutation profiles of 20 clear cell RCC (ccRCC) tumors with bulk RNA sequencing and a customized pan-cancer gene panel. The tumor samples clustered into two distinct subgroups defined by the abundance of intratumoral CD3+ T cells (CD3high, 25/52) and NK cells (NKhigh, 27/52). CD3high tumors had an overall higher frequency of tumor infiltrating lymphocytes and PD-1 expression on the CD8+ T cells compared to NKhigh tumors. The tumor infiltrating T and NK cells had significantly elevated expression levels of LAG-3, PD-1, and HLA-DR compared to the circulating immune cells. Transcriptomic analysis revealed increased immune signaling (IFN-γ, TNF-α via NF-κB, and T cell receptor signaling) and kidney metabolism pathways in the CD3high subgroup. Genomic analysis confirmed the typical ccRCC mutation profile including VHL, PBRM1, and SETD2 mutations, and revealed PBRM1 as a uniquely mutated gene in the CD3high subgroup. Approximately half of the RCC tumors have a high infiltration of NK cells associated with a lower number of tumor infiltrating lymphocytes, lower PD-1 expression, a distinct transcriptomic and mutation profile, providing insights to the immunological heterogeneity of RCC which may impact treatment responses to immunological therapies.

Keywords: NK cell; RCC; T cell; solid tumors; tumor immunology.


Conflict of interest statement

SM has received honoraria and research funding from Bristol Myers Squibb, Novartis, and Pfizer outside the submitted work. PJ has received funding from Elypta Ab. AK is currently employed by Novartis. OB has received honoraria from Novartis and Sanofi outside the submitted work. The author(s) declare that there are no other conflicts of interest.

Figures

Figure 1.
Figure 1.
Heatmap of the RCC cohort and analysis of the lymphocyte subsets according to the CD3high and NKhigh subgroup clusters. (a) Heatmap showing RCC cohort (all subtypes included) according to the intratumoral CD3+ T cell and NK cell abundance using Spearman correlation and ward.D2 clustering methods. The bottom histograms show the percentage of CD3+ T and NK cells from the lymphocyte population. Patient characteristics including gender, age, presence of necrosis, TNM staging, WHO/ISUP 2016 tumor grading, relapse state and tumor sample diameter are shown as color keys above the heatmap. Benign oncocytoma cases are clustered to the NKhigh subgroup. A heatmap showing only the ccRCC cases is found in Supplementary Fig. S1A. (b) Statistical analysis (Mann-Whitney U test) comparing the intratumoral CD3high and NKhigh subgroups according to the abundance of the lymphocyte subsets. The CD3high subgroup encompassed a larger percentage of lymphocytes, CD3+, CD4+, and CD8+ T cells compared to the NKhigh subgroup. The NKhigh subgroup constituted an increased abundance of NK and NKT cells. ns, not significant, *p < .05; **p < .01; ***p < .001; ****p < .0001. (c) Proportion of CD4+, CD8+ T cells, NK and NKT cells from the intratumoral lymphocyte population. The x-axis shows patients categorized into the CD3high and NKhigh subgroups. The pie chart represents the mean proportion of CD4+ and CD8+ T cells from both subgroups.
Figure 2.
Figure 2.
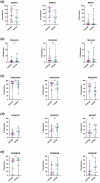
Comparison of marker expressions between the CD3high and NKhigh subgroups. (a) The proportion of PD-1 positive CD4+, CD8+ T and NK cells in the subgroups. (b) The proportion of LAG-3 positive CD4+, CD8+ T and NK cells in the subgroups. (c) The proportion of CXCR4 positive CD4+, CD8+ T and NK cells in the subgroups. (d) The proportion of CD57 positive CD4+, CD8+ T and NK cells in the subgroups. (e) The proportion of DNAM positive CD4+, CD8+ T and NK cells in the subgroups. (a)-(e). All statistical analyses were done using Mann-Whitney U test: ns, not significant, **p < .01.
Figure 3.
Figure 3.
Immunological changes between the tumor and matching adjacent healthy tissue. (a) Examples of renal tissue histology in the hematoxylin and eosin (HE) stained microscopy slides. Varying degrees of cancerous tumor cells (Patient A 40% and Patient B Tumor 100%) occupying the tumor tissue, as well as the regions of lymphocyte-poor or -rich infiltration respectively. The matching adjacent healthy kidney tissue mirror the normal cortical tissue of the kidney (Patient A and Patient B Healthy). (b) Comparison between the different immune subsets (CD3+, CD4+, CD8+ T cells, and NK cells) between the tumor (T) and adjacent healthy (H) kidney tissue. Statistical analysis was performed using Kruskal-Wallis non-parametric test: ns, not significant; *p< .05; **p < .01; ***p < .001; ****p < .0001. (c) The proportion of different lymphocyte subsets in the paired tumor (T) and healthy (H) tissue samples. Mann-Whitney U test: ns, not significant; *p< .05. (d) Comparison of the different immune subsets (CD3+, CD4+, CD8+ T and NK cells) between the tumor (T) and adjacent healthy (H) kidney tissue in the CD3high and NKhigh subgroups. Kruskal-Wallis test: ns, not significant; *p < .05; **p < .01; ***p < .001; ****p < .0001. (e) The proportion of LAG-3 positive CD4+, CD8+ T and NK cells between the tumor and healthy tissue samples. Mann-Whitney U test: *p < .05; **p < .01. (f) The proportion of PD-1 positive CD4+, CD8+ T and NK cells between the tumor and healthy tissue samples. Mann-Whitney U test: ns, not significant; **p < .01.
Figure 3.
Figure 3.
(Continued).
Figure 4.
Figure 4.
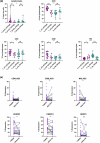
Differences in the circulating and tumor lymphocyte phenotypes. (a) The proportion of LAG-3 positive CD4+ and CD8+ T and NK cells between tumor and peripheral blood (PB) samples. Mann-Whitney U test: ****p < .0001. (b) The proportion of PD-1 positive CD4+ and CD8+ T and NK cells between tumor and peripheral blood (PB) samples. Mann-Whitney U test: ***p < .001; ****p < .0001. (c) The proportion of lymphocytes from live cells, CD3+, CD4+, CD8+ T cells, and NK cells from lymphocytes in the tumor (T) and peripheral blood (PB) samples between the CD3high and NKhigh subgroups. Kruskal-Wallis test: ns, not significant; *p < .05; **p < .01; ***p < .001; ****p < .0001.
Figure 5.
Figure 5.
Bulk RNA sequencing reveals transcriptional differences and gene expression signatures in the tumor tissue. (a) Principal component analysis (PCA) from 11 CD3high and 6 NKhigh ccRCC cases. CD3high and NKhigh tumors did not cluster apart from each other based on the full transcriptomic profile. (b) Differential gene expression (DEG) analysis between CD3high and NKhigh subgroups (nominal p < .05, absolute logFC > 2). (c) Heatmap showing significant DEGs (p-adjusted < .05, absolute logFC > 2) and clinical parameters in ccRCC tumors. The fading blue color indicates downregulation of the gene and red indicates upregulation relative to the mean expression of the genes across all samples. Clinical annotations have been added as colored keys at the top of the heatmap; tnm_staging = TNM classification of malignant tumors, who = WHO ISUP 2016 tumor grading, necrosis = presence of necrosis (y = yes, n = no), gender, dominance = CD3high and NKhigh subgroups. (d and e) Gene set enrichment analysis (GSEA) using the MSigDB 2020 Hallmark and Biocarta 2016 signatures, showing IFN-γ, TNF-α, MAPK and T cell receptor signaling pathways among the top ten upregulated pathways in the CD3high subgroup. Wnt-β catenin, IL-6 mediated JAK-STAT3, PI3K-AKT/mTOR, caspase and NF-κB signaling pathways were among the most downregulated pathways. The full list of pathways from MSigDB 2020 Hallmark and Biocarta 2016 signatures are found in Supplmentary Table S4 and S5, respectively.
Figure 5.
Figure 5.
(Continued).
Figure 6.
Figure 6.
CD3high and NKhigh subgroups reveal differences in mutational signatures. (a) 17 tumors (9 CD3high and 8 NKhigh) and 17 paired healthy adjacent renal tissues were analyzed using a custom-designed targeted sequencing panel covering 986 cancer associated genes and additional intronic cancer hotspots. 80 variants from 70 genes recurrently mutated in more than one sample were identified. The oncoplot shows the overall summary of the mutational distribution in the top 50 mutated genes. The middle color key represents the CD3high (Orange) and NKhigh (yellow) subgroups. The bottom stacked barplot shows the distributions of SNVs (six transition and transversion categories) for each sample. Side bar plots (top, right) display the log10 transformed Q-values estimated by MutSigCV. Details of the targeted sequencing panel are found in the Supplemental section. (b) Out of 43 mutations in the CD3high subgroup (n = 9), 33 were missense mutations, 4 nonsense mutations, 5 frameshift deletions, and 1 frameshift insertion. The most frequently mutated genes were VHL (33%) and PBRM1 (33%). (c) The NKhigh subgroup (n = 8) harbored a total of 37 mutations: 28 missense mutations, 5 frameshift deletions, 3 nonsense mutations, and 1 frameshift insertion, with CSMD1 (25%) and VHL (25%) as the top mutated genes.(d) Differentially expressed mutated genes shared between the CD3high and NKhigh subgroups. Fisher’s exact test was used to find the genes mutated in a minimum of two samples in at least one of the subgroups for the analysis.
Figure 6.
Figure 6.
(Continued).

Similar articles

Cited by

References

    1. Hsieh JJ, Purdue MP, Signoretti S, Swanton C, Albiges L, Schmidinger M, Heng DY, Larkin J, Ficarra V.. Renal cell carcinoma. Nat Rev Dis Primers. 2017;3(1):17009. doi:10.1038/nrdp.2017.9. - DOI - PMC - PubMed
    1. Bray F, Ferlay J, Soerjomataram I, Siegel RL, Torre LA, Jemal A. Global cancer statistics 2018: GLOBOCAN estimates of incidence and mortality worldwide for 36 cancers in 185 countries. CA Cancer J Clin. 2018;68(6):394–15. doi:10.3322/caac.21492. - DOI - PubMed
    1. Linehan WM. Genetic basis of kidney cancer: role of genomics for the development of disease-based therapeutics. Genome Res. 2012;22(11):2089–2100. doi:10.1101/gr.131110.111. - DOI - PMC - PubMed
    1. Linehan WM, Srinivasan R, Schmidt LS. The genetic basis of kidney cancer: a metabolic disease. Nat Rev Urol. 2010;7(5):277–285. doi:10.1038/nrurol.2010.47. - DOI - PMC - PubMed
    1. Koul H, Huh JS, Rove KO, Crompton L, Koul S, Meacham RB, Kim FJ, et al. Molecular aspects of renal cell carcinoma: a review. Am J Cancer Res. 2011;1(2):240–254. - PMC - PubMed

Publication types

Substances