. 2021 Dec 23:11:788024.
doi: 10.3389/fonc.2021.788024. eCollection 2021.

β-Tubulin Isotype, TUBB4B, Regulates The Maintenance of Cancer Stem Cells

Affiliations

β-Tubulin Isotype, TUBB4B, Regulates The Maintenance of Cancer Stem Cells

Dhrishya Dharmapal et al. Front Oncol. .

Abstract

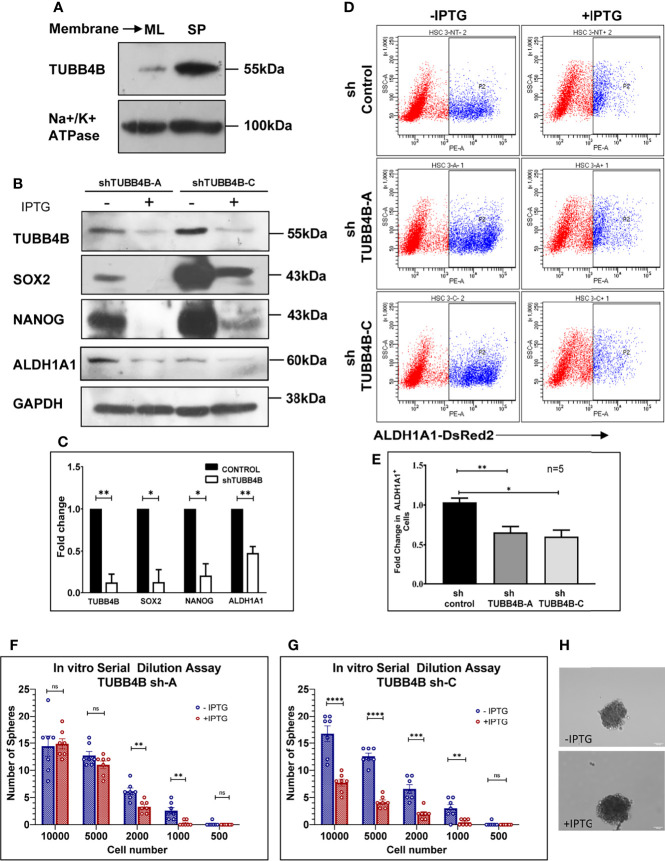
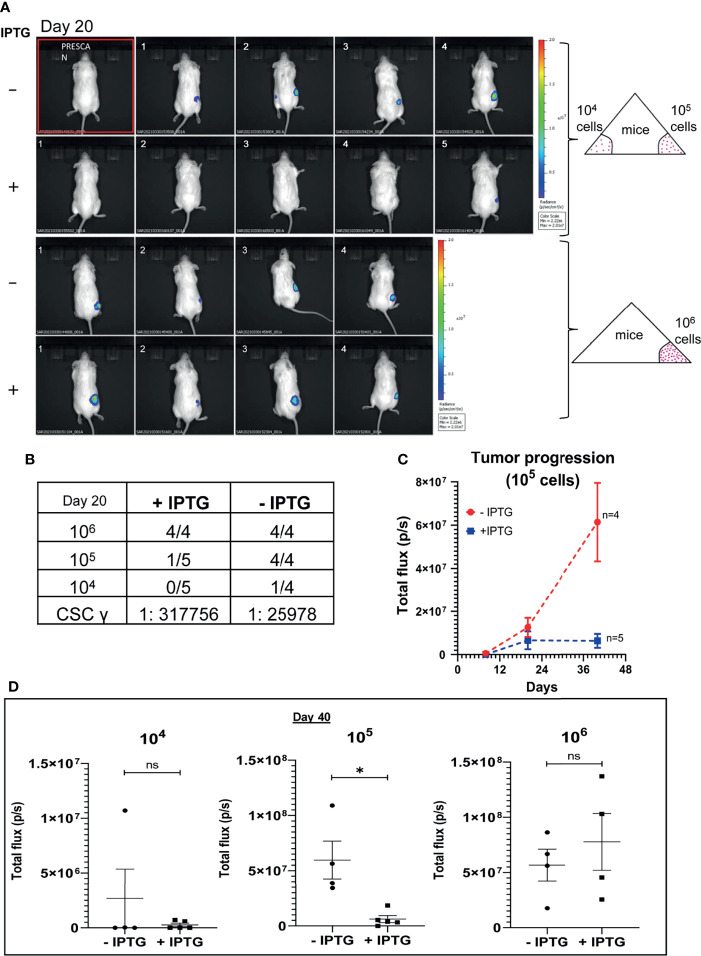
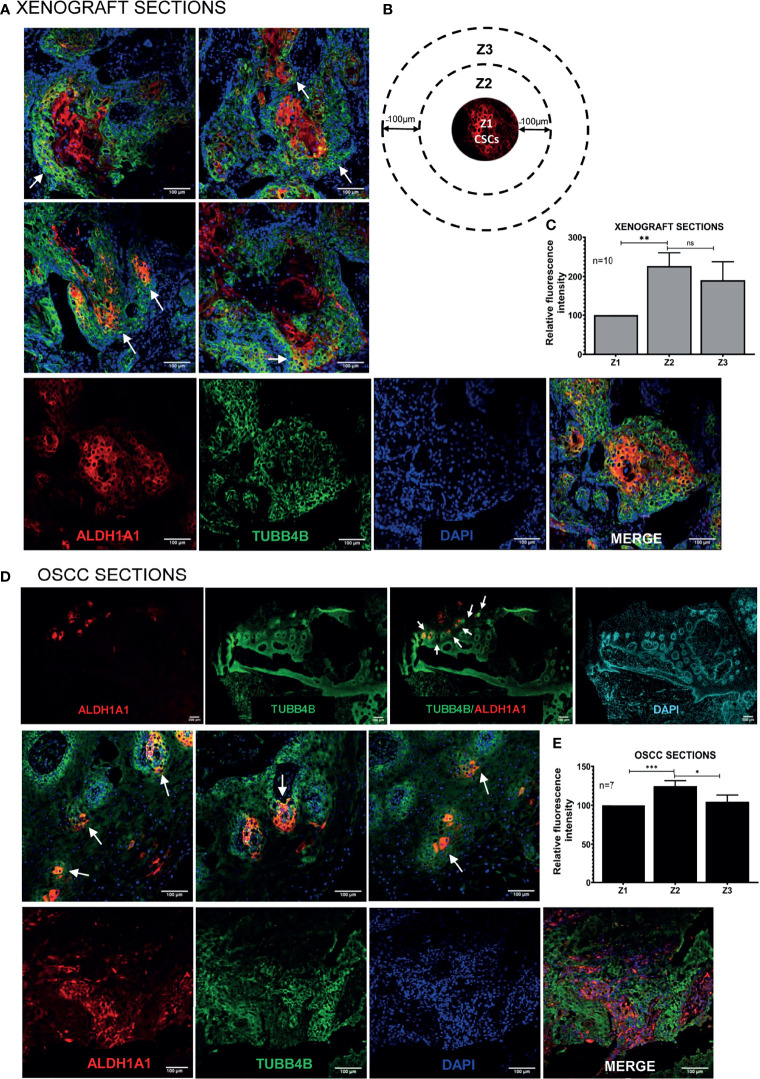
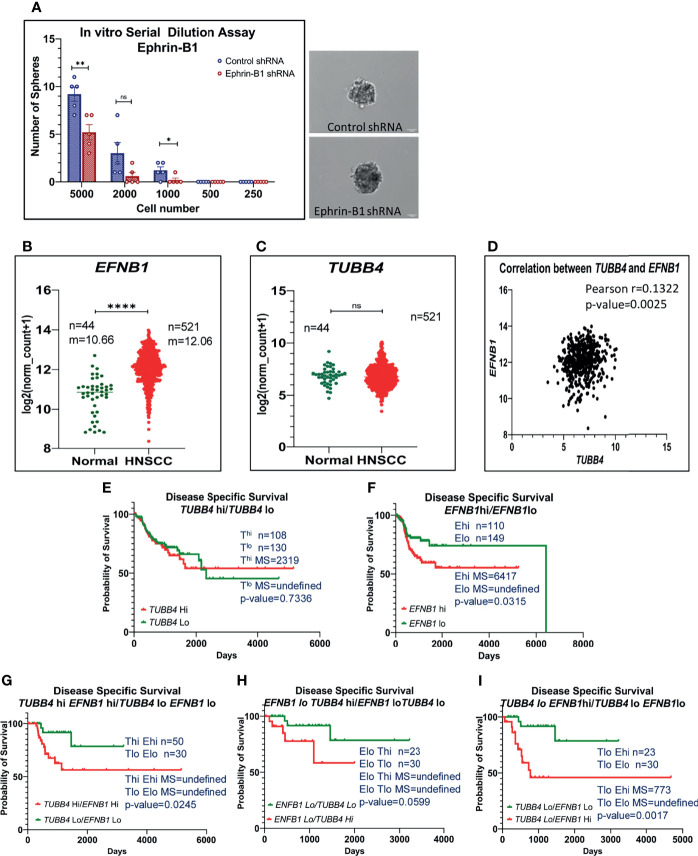
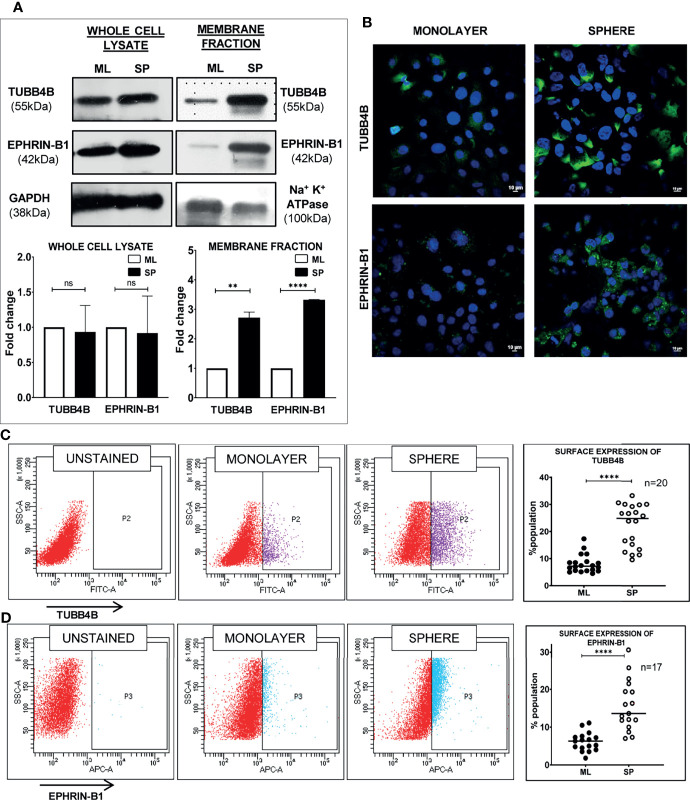
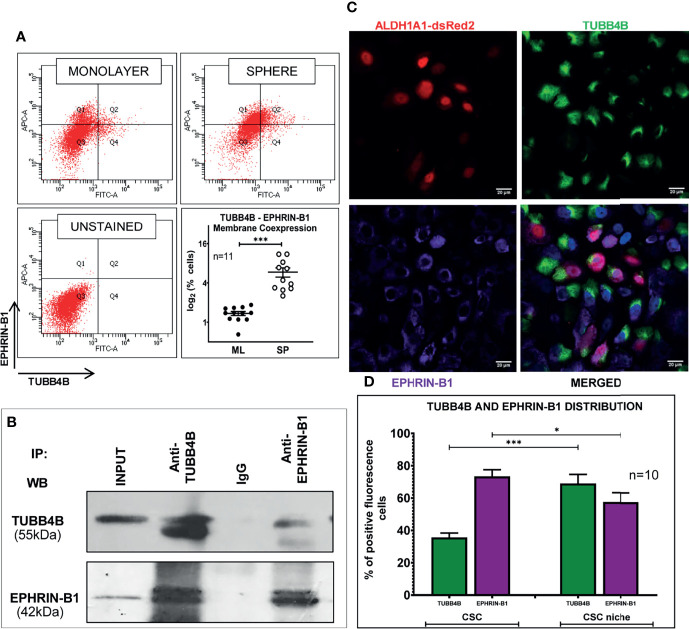
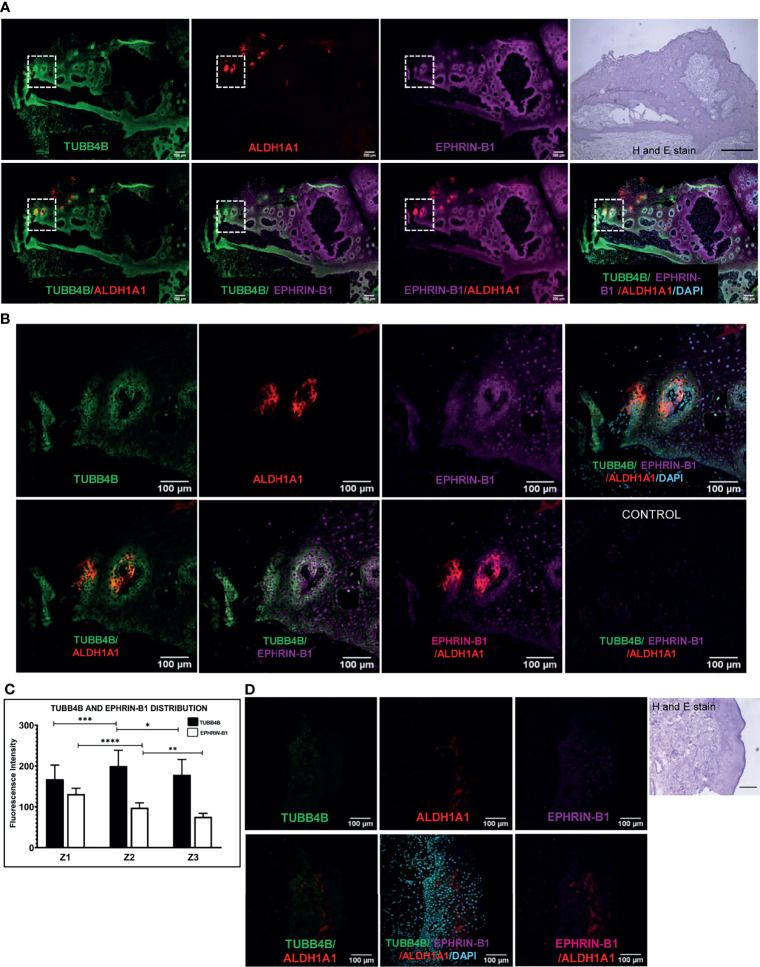
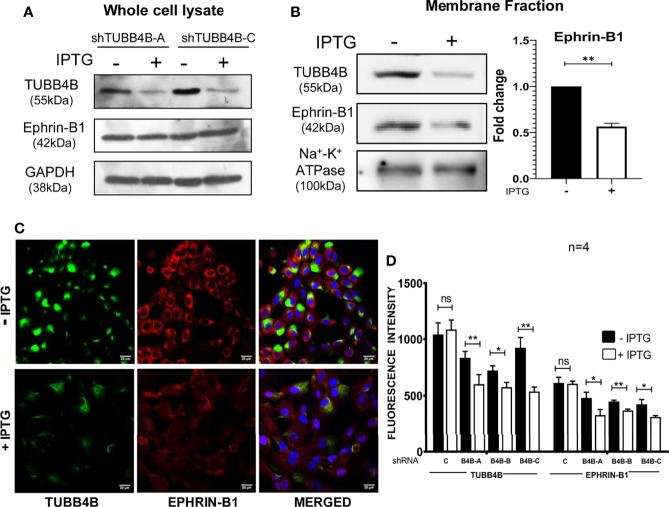
Recent advancements in cancer research have shown that cancer stem cell (CSC) niche is a crucial factor modulating tumor progression and treatment outcomes. It sustains CSCs by orchestrated regulation of several cytokines, growth factors, and signaling pathways. Although the features defining adult stem cell niches are well-explored, the CSC niche is poorly characterized. Since membrane trafficking proteins have been shown to be essential for the localization of critical proteins supporting CSCs, we investigated the role of TUBB4B, a probable membrane trafficking protein that was found to be overexpressed in the membranes of stem cell enriched cultures, in sustaining CSCs in oral cancer. Here, we show that the knockdown of TUBB4B downregulates the expression of pluripotency markers, depletes ALDH1A1+ population, decreases in vitro sphere formation, and diminishes the tumor initiation potential in vivo. As TUBB4B is not known to have any role in transcriptional regulation nor cell signaling, we suspected that its membrane trafficking function plays a role in constituting a CSC niche. The pattern of its expression in tissue sections, forming a gradient in and around the CSCs, reinforced the notion. Later, we explored its possible cooperation with a signaling protein, Ephrin-B1, the abrogation of which reduces the self-renewal of oral cancer stem cells. Expression and survival analyses based on the TCGA dataset of head and neck squamous cell carcinoma (HNSCC) samples indicated that the functional cooperation of TUBB4 and EFNB1 results in a poor prognosis. We also show that TUBB4B and Ephrin-B1 cohabit in the CSC niche. Moreover, depletion of TUBB4B downregulates the membrane expression of Ephrin-B1 and reduces the CSC population. Our results imply that the dynamics of TUBB4B is decisive for the surface localization of proteins, like Ephrin-B1, that sustain CSCs by their concerted signaling.

Keywords: ALDH1A1; CSC niche; TUBB4B (Tubulin β-2C); cancer stem cells; ephrin-B1.


Conflict of interest statement

The authors declare that the research was conducted in the absence of any commercial or financial relationships that could be construed as a potential conflict of interest.

Figures

Figure 1
Figure 1
TUBB4B supports CSCs. (A) Expression analysis of TUBB4B in the membrane fraction of monolayer (ML) and sphere culture (SP) of HSC-3 cell line by western blotting. (B) HSC-3 cells harboring an inducible shRNA (A or C) for TUBB4B were either treated or untreated with 50mM IPTG for six days for shRNA induction, and used for western blot assay of the indicated proteins. (C) shows the graphical representation of the normalized protein expressions. (D) HSC-3 cells stably expressing ALDH1A1-DsRed2, transduced either of the two TUBB4B shRNA lentiviral particles, or a non-target shRNA were used for the assay. The shRNA expressions were induced by administering 50mM IPTG for 10 days. Induced and uninduced cells were trypsinized, and DsRed2 expression was analyzed by FACS. Subpopulation P2 indicated high ALDH1A1 expressing (ALDH1A1+) cancer stem cells. The fold change of P2 subpopulation in the induced cells with respect to uninduced cells for the different shRNA groups were graphically represented (E). Serial dilutions of TUBB4B shRNA induced and uninduced cells were plated in low adhesion plates in replicates and monitored for sphere formation for 10 days. (F, G) are the graphical representations of number of spheres formed using TUBB4B shRNA-A and C respectively. Representative images of spheres formed in induced and uninduced groups are also shown (H). Scale bar is 100μm. The error bars indicate SEM of biological replicates. ns represent non-significant data, * represents p < 0.05, ** represents p < 0.01, *** represents p < 0.001, and **** represents p < 0.0001.
Figure 2
Figure 2
TUBB4B downregulation affects tumor initiation potential in mice xenograft. HSC-3 cells stably expressing Luciferase gene were transduced with lentivirus carrying inducible TUBB4B shRNA. The cells were split into two groups, and either induced with 50mM IPTG for 15 days to downregulate TUBB4B or were left uninduced. Post validation of downregulation by western blotting, serial dilutions of cells, 104, 105, and 106 were injected into flanks of NOD.CB17-PrkdcSCID /J mice to generate xenografts. IPTG treatment was continued for another seven days for the induced animals. The tumor growth was assessed by measuring the bioluminescence at days 8, 20, and 40 post the cell injection. (A) shows the bioluminescence image and (B) summarizes the tumor initiation observed 20 days post cell injections along with the CSC frequency calculated using ELDA. A total flux minimum value of 2x10⁶ p/s was considered as the cutoff for tumor detection. (C) is a graphical representation of the tumor progression observed over a period of 40 days in the animals injected with 105 cells. (D) is the graphical representation of the luminescence in total flux measured in the different dilution groups at day 40. ns represent non-significant data, and * represents p-value < 0.05.
Figure 3
Figure 3
TUBB4B is present in the CSC niche of Oral Cancer. (A) HSC3 xenograft sections were immunostained with antibodies against ALDH1A1 and TUBB4B, and confocal images were acquired. The region in and around ALDH1A1+ was arbitrarily divided into three zones, with Z1 representing the ALDH1A1+ stem cell population, Z2 representing the cells immediately surrounding 100μm from Z1, and the region 100 μm further away from Z2 were considered as zone 3, schematically represented in (B). Ten sections were stained and, three frames were captured from each section. Fluorescence intensities were measured by drawing ROIs in each zones and normalized intensity values were represented graphically (C). The experiment was repeated with seven OSCC sections. (D) shows full field stitched images and 20X images. The normalized fluorescence intensity values were plotted (E). Scale bar represents 100μm for all 20X images and 200μm for stitched images. Arrows point towards regions of increased TUBB4B expression in CSC niche. ns represents non-significant data, * represents p < 0.05, ** represents p < 0.01, *** represents p < 0.001.
Figure 4
Figure 4
High expression of TUBB4B with Ephrin-B1 predicts poor prognosis in HNSCC. Serial dilutions of control shRNA induced and Ephrin-B1 shRNA harboring HSC3 cells were plated in low adhesion plates in replicates and monitored for sphere formation for 10 days. The number of spheres formed in each dilutions of both groups are represented in the bar graph (A). Representative images of spheres formed in control shRNA and Ephrin-B1 shRNA groups are also shown. Scale bar is 100μm. To analyze mRNA expressions, log2(x+1) transformed RSEM normalized count of EPHB1 (B) and TUBB4B (C) from 521 HNSCC patients was plotted against 44 normal samples obtained from RNAseq data of TCGA database was performed by using GraphPad prism 9.0. The statistical significance was calculated by unpaired t-test. (D) Two-tailed Pearson correlation analysis between TUBB4B and EFNB1 RNA normalized counts of 521 HNSCC patients was performed. Kaplan–Meier analysis was carried out between (E) TUBB4B hi(>7.5) and TUBB4B lo(<6) samples, (F) EFNB1 hi(>12.5) and EFNB1 lo(<11.5) samples (G) TUBB4B hi(>7.5)EFNB1 hi(>12.5) and TUBB4B lo(<6)EFNB1 lo(<11.5) samples (H) EFNB1 lo(<11.5)TUBB4B hi(>7.5) and EFNB1 lo(<11.5)TUBB4B lo (I) TUBB4B lo(<6)EFNB1 hi (>12.5) and EFNB1 lo(<11.5)TUBB4B lo(<6). The statistical significance was calculated by Log-rank (Mantel-Cox) test. MS represents Median Survival. ns represents a non-significant difference between the two data, * represents p < 0.05, ** represents p < 0.01, **** represents p < 0.0001. hi represents high mRNA expressing group and lo represents low expressing groups.
Figure 5
Figure 5
Sphere culture enriches the surface expression of TUBB4B and Ephrin-B1. (A) Whole-cell lysates and membrane fractions of sphere and monolayer cultures of HSC-3 cells were immunoblotted. For whole-cell lysates, GAPDH was used as loading control, whereas Na+/K+-ATPase was used as loading control for membrane fractions. The fold changes were calculated and represented graphically. (B) Shows the membrane expressions of TUBB4B or Ephrin-B1 in unpermeabilized monolayer (ML) and sphere cultures (SP). PFA fixed HSC3 sphere or monolayer cultures were probed for (C)TUBB4B or (D) Ephrin-B1 using fluorophore tagged primary antibodies and the surface expressions were analyzed by flow cytometry. The graphs represent the percentages of cells with high surface expression of individual proteins. ns represents non-significant data, ** represents p < 0.01, **** represents p < 0.0001.
Figure 6
Figure 6
TUBB4B and Ephrin-B1 physically interact in the CSC niche. (A) PFA fixed monolayer (ML) and sphere (SP) cultures of HSC-3 cells were dual stained with fluorophore tagged TUBB4B and Ephrin-B1 antibodies and the percentage dual positive cells were plotted. (B) Lysates of HSC-3 cells were immunoprecipitated with TUBB4B antibody and a reverse IP was performed using Ephrin-B1 antibody. The elutes were separated by SDS PAGE, transferred and probed for the indicated proteins. Isotype control mouse IgG antibody was used as the negative control. (C) Unpermeabilized HSC-3 cells with ALDH1A1-DsRed2 reporter were probed with TUBB4B and Ephrin-B1 antibodies, and confocal images were acquired. Cells with high fluorescence intensities were manually counted for each channel in ALDH1A1+ cell clusters (the CSC population), and in the cells immediately surrounding the ALDH1A1+ cell, within a distance of 100 μm (considered to be the CSC niche cells). Of the total number of CSCs or the niche cells, the percentages of cells with high expression of each protein were plotted (D). Cells were counted from 10 frames. * represents p-value < 0.05 and *** represents p < 0.001. Scale bar represents 20 μm.
Figure 7
Figure 7
TUBB4B and Ephrin B-1 co-express in CSC niche of Oral cancer. Sections of OSCC patient tumors were triple stained with ALDH1A1/TUBB4B/Ephrin-B1. (A) shows stitched full field images of the tissue sections at 10X magnification. The scale bar represents 200µm. Hematoxylin and Eosin staining of the same tissue is also shown, for which scale bar represents 500 µm. The areas in the inset are shown at a magnification of 20X in (B). The scale bar represents 100 µm. For quantitation, the region in and around ALDH1A1+ was arbitrarily divided into three zones, with Z1 representing the ALDH1A1+ stem cell population, Z2 representing the cells immediately surrounding 100μm from Z1, and the region 100 μm further away from Z2 were considered as zone 3. Fluorescence intensities were measured by drawing ROIs in the zones and represented graphically (C). (D) shows 20X images of ALDH1A1/TUBB4B/Ephrin-B1 triple staining of normal tissue. * represents p < 0.05, ** represents p < 0.01, *** represents p < 0.001, **** represents p < 0.0001.
Figure 8
Figure 8
TUBB4B downregulation reduces Ephrin-B1 on the surface. HSC-3 cells stably expressing inducible TUBB4B shRNAs were induced with 50mM IPTG for ten days. Whole-cell lysates (A) and membrane fractions (B) of the TUBB4B shRNA induced and uninduced cells were probed for the indicated proteins by immunoblotting. (C) non-permeabilized TUBB4B shRNA induced and uninduced cells were immune-stained for the indicated proteins. The fluorescence intensities of TUBB4B and Ephrin-B1 were calculated by drawing ROIs around cells. Average intensities were graphically plotted for induced and uninduced cells of the three lentiviral TUBB4B shRNAs (B4B-A, B4B-B and B4B-C), and non-target shRNA(c). ns represent non-significant data, (D) * represents p < 0.05, ** represents p < 0.01. Scale bar represents 20 μm.

Similar articles

Cited by

References

    1. Baumann M, Krause M, Hill R. Clonogens and Cancer Stem Cells. Nat Rev Cancer (2008) 8(12):990–0. doi: 10.1038/nrc2419-c2 - DOI - PubMed
    1. Pardal R, Clarke MF, Morrison SJ. Applying the Principles of Stem-Cell Biology to Cancer. Nat Rev Cancer (2003) 3(12):895–902. doi: 10.1038/nrc1232 - DOI - PubMed
    1. Chen ZG. The Cancer Stem Cell Concept in Progression of Head and Neck Cancer. J Oncol (2009) 2009:894064. doi: 10.1155/2009/894064 - DOI - PMC - PubMed
    1. Phi LTH, Sari IN, Yang YG, Lee SH, Jun N, Kim KS, et al. . Cancer Stem Cells (CSCs) in Drug Resistance and Their Therapeutic Implications in Cancer Treatment. Stem Cells Int (2018) 2018:5416923. doi: 10.1155/2018/5416923 - DOI - PMC - PubMed
    1. Mohan A, Raj R R, Mohan G, KP P, Thomas Maliekal T. Reporters of Cancer Stem Cells as a Tool for Drug Discovery. Front Oncol (2021) 11:1270. doi: 10.3389/fonc.2021.669250 - DOI - PMC - PubMed