

Distribution of Corneal Geometric Landmarks and Relationship Between Their Distances and Biomechanical Parameters in the Development of Keratoconus
- PMID: 35004637
- PMCID: PMC8729823
- DOI: 10.3389/fbioe.2021.766163
Distribution of Corneal Geometric Landmarks and Relationship Between Their Distances and Biomechanical Parameters in the Development of Keratoconus
Erratum in
-
Corrigendum: Distribution of corneal geometric landmarks and relationship between their distances and biomechanical parameters in the development of keratoconus.Front Bioeng Biotechnol. 2023 Jan 10;10:1104956. doi: 10.3389/fbioe.2022.1104956. eCollection 2022. Front Bioeng Biotechnol. 2023. PMID: 36704309 Free PMC article.
Abstract
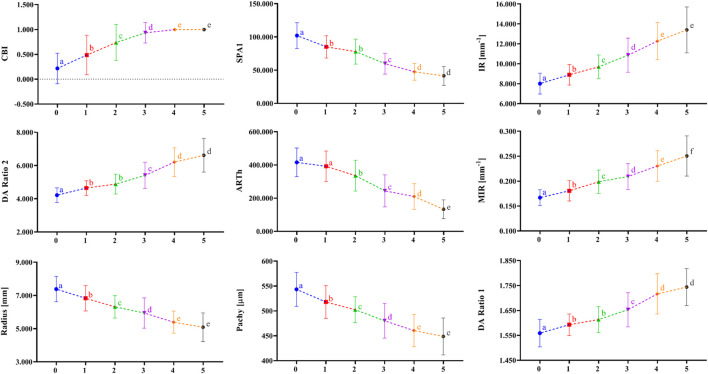
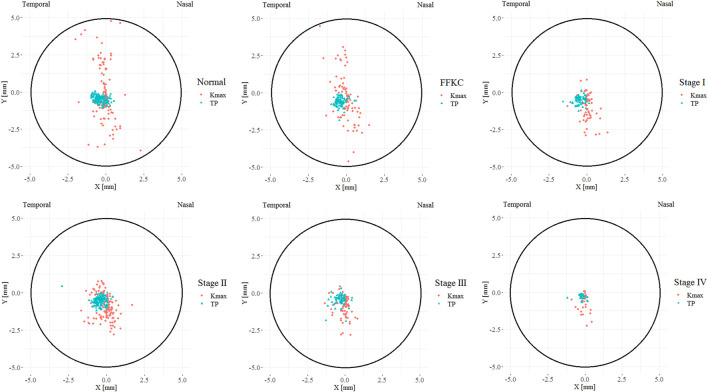
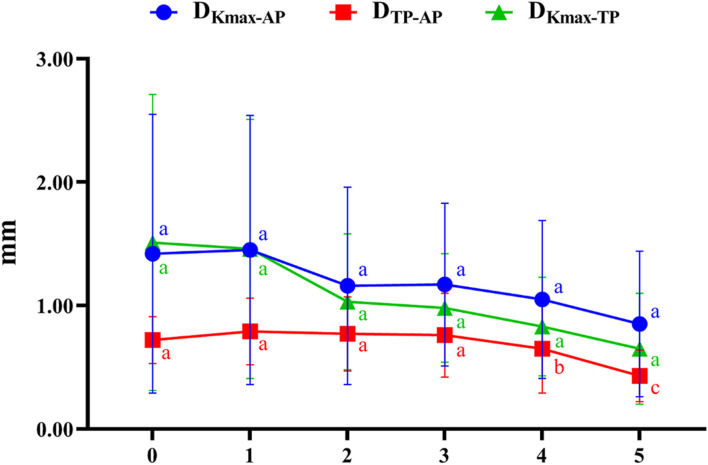
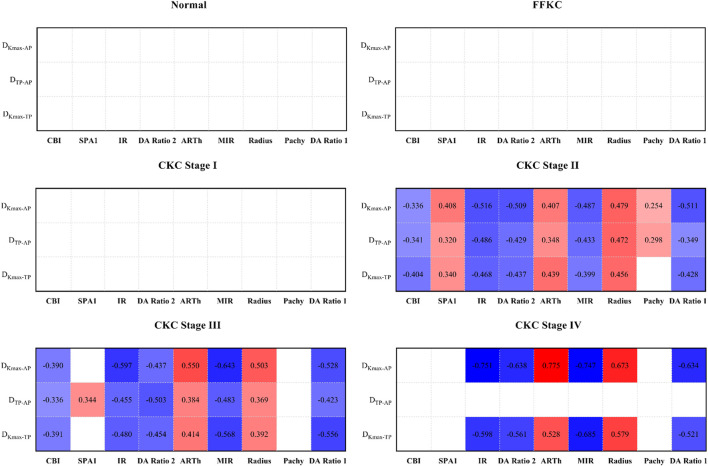
Purpose: To analyze the changes in coordinates and distances among three typical geometric landmarks of the cornea, namely, the thinnest point (TP), maximum curvature (Kmax), and corneal apex (AP) during the development of keratoconus, and explore the potential relationship between these changes and the abnormalities of corneal biomechanics. Methods: Normal eyes (n = 127), clinical keratoconic eyes (CKC, n = 290), and the eyes of forme fruste keratoconus (FFKC, n = 85) were included; among them, the CKC group was classified into four grades based on the Topographic Keratoconus Classification (TKC) provided by Pentacam. A total of 38 Corvis ST output parameters and three distance parameters of three typical landmarks (DKmax-AP, DTP-AP, and DKmax-TP) based on Pentacam were included. The differences of parameters among the abovementioned six groups (Normal, FFKC, and CKC stage I to CKC stage IV) were analyzed. Spearman's rank correlation test was performed to choose several dynamic corneal response (DCR) parameters that could best reflect the changes of corneal biomechanical characteristics during the progression of the disease, and the Pearson's or Spearman's correlation test was conducted to determine the association between the three distances and the selected DCR parameters in each grade. In addition, by flipping the X coordinate of the left eye on the vertical axis to reflect the direction of the right eye, the coordinates of TP and Kmax in different developmental grades were highlighted. Results: From CKC stage II, the three geometric landmark distances commenced to correlate with the corneal DCR parameters (CBI, SPA1, IR, DA Ratio 2, ARTh, MIR, Radius, Pachy, and DA Ratio 1), which could better represent the changes of biomechanical properties from normal cornea to keratoconus. From normal cornea to CKC stage IV, the coordinates of Kmax were gradually tended to the inferior temporal region from dispersion, while TP was always concentrated in the inferior temporal region. Although DKmax-AP, DKmax-TP, and DTP-AP all showed a gradual decreasing trend with the progress of the disease, the first two did not change significantly, and only DTP-AP significantly approached AP in the later stage of disease development. In addition, from the FFKC group, the corresponding values of DKmax-TP in each disease development group were smaller than DKmax-AP. Conclusions: In the later stage of keratoconus, the relationship between the three typical landmark distance parameters and DCR parameters is stronger, and even the weakening of corneal biomechanical properties may be accompanied by the merger of typical landmark positions.
Keywords: biomechanics; forme fruste keratoconus; geometric landmark; keratoconus; morphology.
Copyright © 2021 Tian, Zhang, Guo, Qin, Zhang, Li, Wu, Jie and Zhang.
Conflict of interest statement
The authors declare that the research was conducted in the absence of any commercial or financial relationships that could be construed as a potential conflict of interest.
Figures

References
LinkOut - more resources
Full Text Sources
Miscellaneous