

Development and Validation of a Nomogram Incorporating Colloid Osmotic Pressure for Predicting Mortality in Critically Ill Neurological Patients
- PMID: 35004737
- PMCID: PMC8740271
- DOI: 10.3389/fmed.2021.765818
Development and Validation of a Nomogram Incorporating Colloid Osmotic Pressure for Predicting Mortality in Critically Ill Neurological Patients
Abstract
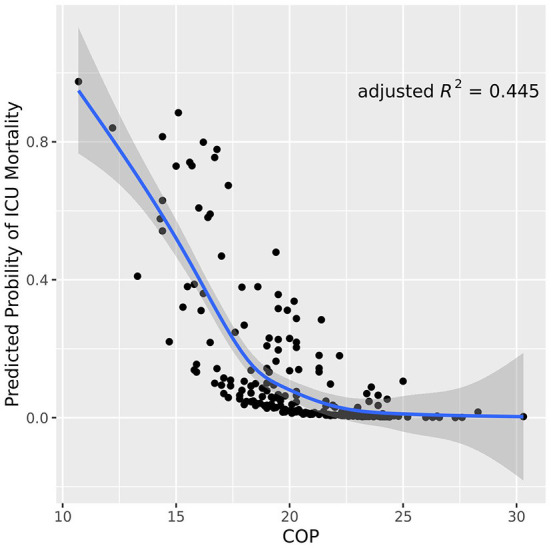
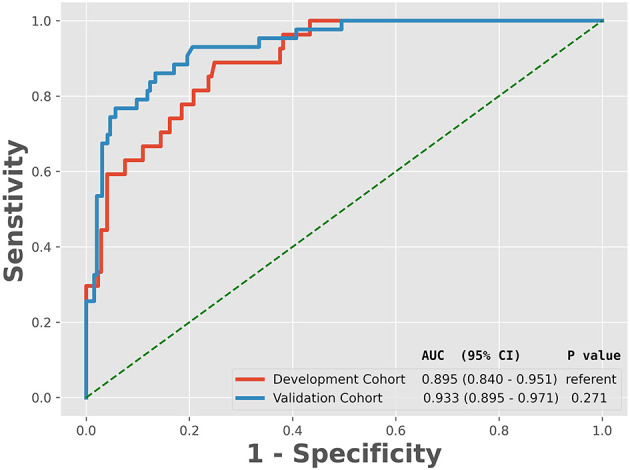
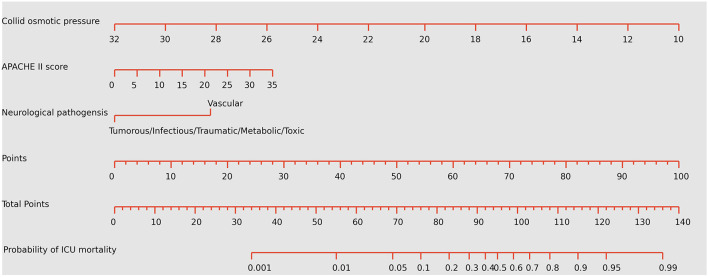
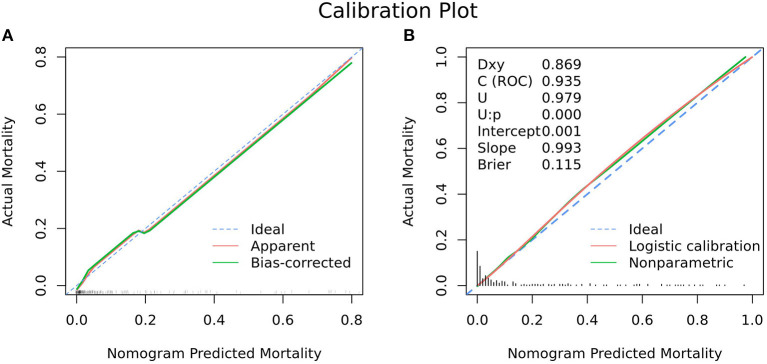
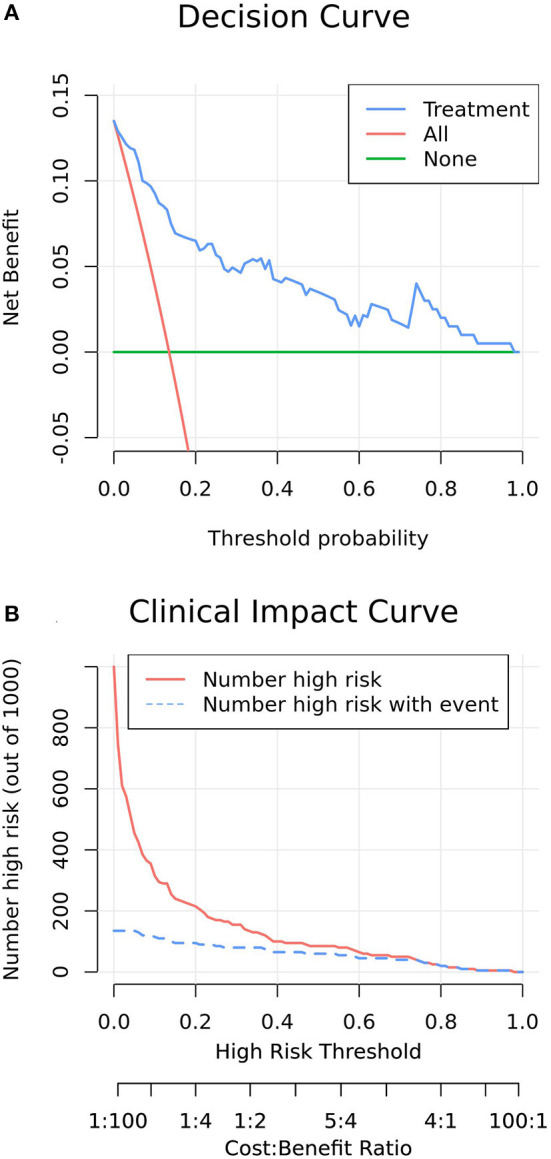
Backgrounds: The plasma colloid osmotic pressure (COP) values for predicting mortality are not well-estimated. A user-friendly nomogram could predict mortality by incorporating clinical factors and scoring systems to facilitate physicians modify decision-making when caring for patients with serious neurological conditions. Methods: Patients were prospectively recruited from March 2017 to September 2018 from a tertiary hospital to establish the development cohort for the internal test of the nomogram, while patients recruited from October 2018 to June 2019 from another tertiary hospital prospectively constituted the validation cohort for the external validation of the nomogram. A multivariate logistic regression analysis was performed in the development cohort using a backward stepwise method to determine the best-fit model for the nomogram. The nomogram was subsequently validated in an independent external validation cohort for discrimination and calibration. A decision-curve analysis was also performed to evaluate the net benefit of the insertion decision using the nomogram. Results: A total of 280 patients were enrolled in the development cohort, of whom 42 (15.0%) died, whereas 237 patients were enrolled in the validation cohort, of which 43 (18.1%) died. COP, neurological pathogenesis and Acute Physiology and Chronic Health Evaluation II (APACHE II) score were predictors in the prediction nomogram. The derived cohort demonstrated good discriminative ability, and the area under the receiver operating characteristic curve (AUC) was 0.895 [95% confidence interval (CI), 0.840-0.951], showing good correction ability. The application of this nomogram to the validation cohort also provided good discrimination, with an AUC of 0.934 (95% CI, 0.892-0.976) and good calibration. The decision-curve analysis of this nomogram showed a better net benefit. Conclusions : A prediction nomogram incorporating COP, neurological pathogenesis and APACHE II score could be convenient in predicting mortality for critically ill neurological patients.
Keywords: colloid osmotic pressure; critically ill neurological patients; mortality; nomogram; predicting.
Copyright © 2021 Lv, Hu, Fang, Sun, Hou, Deng, Zhang, Xu, He, Liang and Chen.
Conflict of interest statement
The authors declare that the research was conducted in the absence of any commercial or financial relationships that could be construed as a potential conflict of interest.
Figures
Similar articles
-
Development and validation of a nomogram for predicting self-propelled postpyloric placement of spiral nasoenteric tube in the critically ill: Mixed retrospective and prospective cohort study.Clin Nutr. 2019 Dec;38(6):2799-2805. doi: 10.1016/j.clnu.2018.12.008. Epub 2018 Dec 11. Clin Nutr. 2019. PMID: 30579668
-
Development and Validation of a Nomogram for Predicting Sepsis-Induced Coagulopathy in Septic Patients: Mixed Retrospective and Prospective Cohort Study.Thromb Haemost. 2025 Feb;125(2):108-119. doi: 10.1055/a-2359-2563. Epub 2024 Jul 3. Thromb Haemost. 2025. PMID: 38959956 Free PMC article.
-
Development and validation of a nomogram for predicting enteral feeding intolerance in critically ill patients (NOFI): Mixed retrospective and prospective cohort study.Clin Nutr. 2023 Dec;42(12):2293-2301. doi: 10.1016/j.clnu.2023.10.003. Epub 2023 Oct 5. Clin Nutr. 2023. PMID: 37852023
-
Development and Validation of a Dynamic Nomogram for Predicting in-Hospital Mortality in Patients with Acute Pancreatitis: A Retrospective Cohort Study in the Intensive Care Unit.Int J Gen Med. 2023 Jun 17;16:2541-2553. doi: 10.2147/IJGM.S409812. eCollection 2023. Int J Gen Med. 2023. PMID: 37351008 Free PMC article.
-
A simple APACHE IV risk dynamic nomogram that incorporates early admitted lactate for the initial assessment of 28-day mortality in critically ill patients with acute myocardial infarction.BMC Cardiovasc Disord. 2022 Nov 24;22(1):502. doi: 10.1186/s12872-022-02960-8. BMC Cardiovasc Disord. 2022. PMID: 36434509 Free PMC article.
Cited by
-
A visualized dynamic prediction model for overall survival in patients diagnosed with brain metastases from lung squamous cell carcinoma.Clin Respir J. 2023 Jun;17(6):556-567. doi: 10.1111/crj.13625. Epub 2023 Apr 29. Clin Respir J. 2023. PMID: 37118997 Free PMC article.
-
Predicting the rupture status of small middle cerebral artery aneurysms using random forest modeling.Front Neurol. 2022 Jul 28;13:921404. doi: 10.3389/fneur.2022.921404. eCollection 2022. Front Neurol. 2022. PMID: 35968311 Free PMC article.
-
Prediction of acute kidney injury after cardiac surgery with fibrinogen-to-albumin ratio: a prospective observational study.Front Cardiovasc Med. 2024 Feb 27;11:1336269. doi: 10.3389/fcvm.2024.1336269. eCollection 2024. Front Cardiovasc Med. 2024. PMID: 38476379 Free PMC article.
-
The establishment and validation of a prediction model for traumatic intracranial injury patients: a reliable nomogram.Front Neurol. 2023 May 25;14:1165020. doi: 10.3389/fneur.2023.1165020. eCollection 2023. Front Neurol. 2023. PMID: 37305757 Free PMC article.
-
Construction, validation, and visualization of a web-based nomogram to predict overall survival in small-cell lung cancer patients with brain metastasis.Cancer Causes Control. 2024 Mar;35(3):465-475. doi: 10.1007/s10552-023-01805-9. Epub 2023 Oct 16. Cancer Causes Control. 2024. PMID: 37843701
References
LinkOut - more resources
Full Text Sources