

Identification of Diagnostic Markers Correlated With HIV+ Immune Non-response Based on Bioinformatics Analysis
- PMID: 35004856
- PMCID: PMC8727996
- DOI: 10.3389/fmolb.2021.809085
Identification of Diagnostic Markers Correlated With HIV+ Immune Non-response Based on Bioinformatics Analysis
Abstract
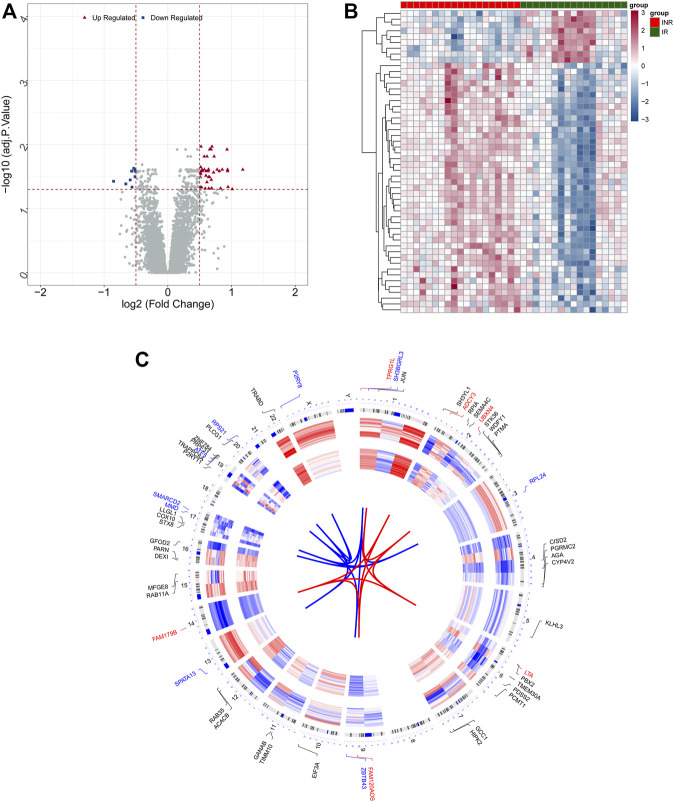
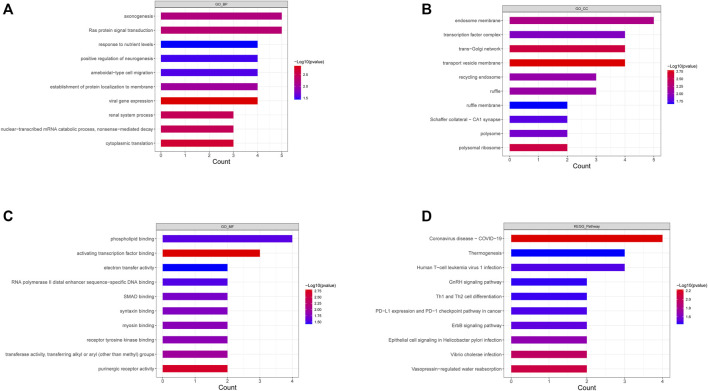
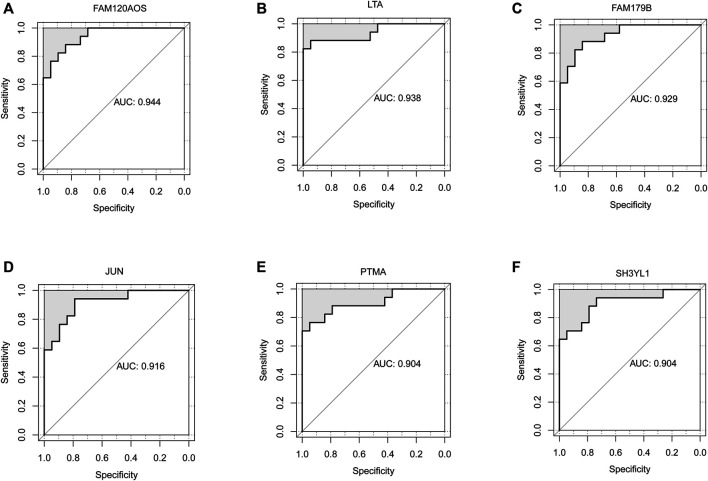
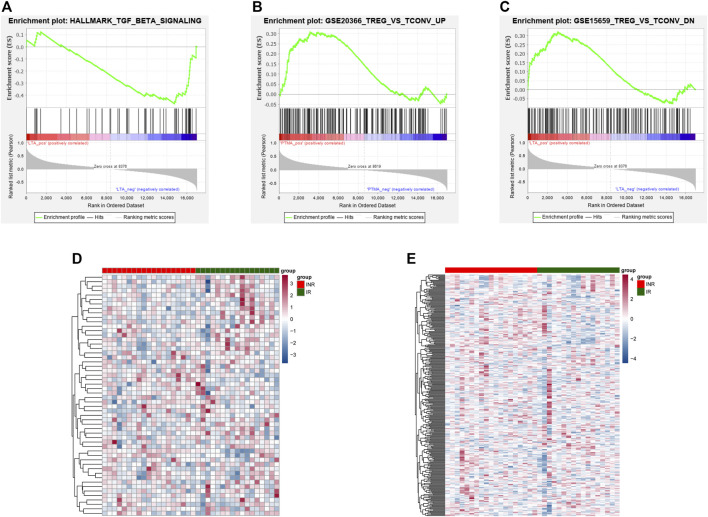
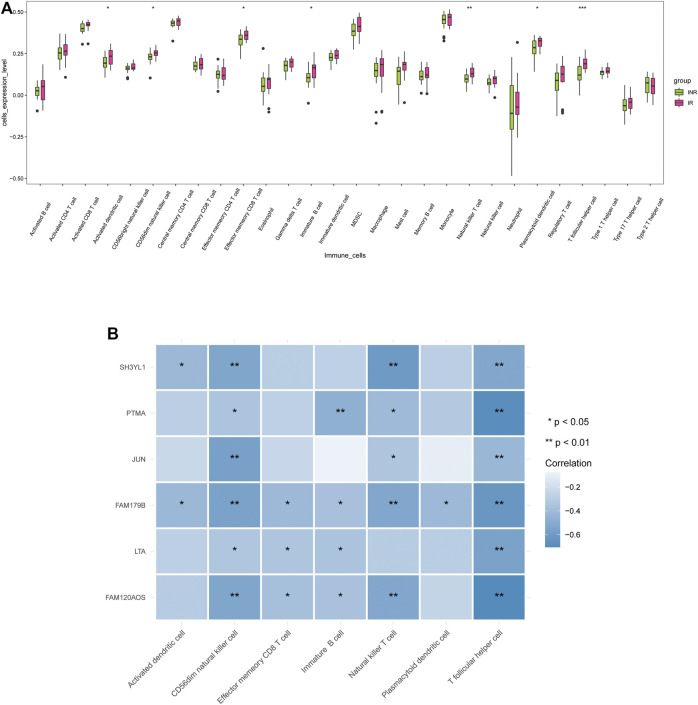
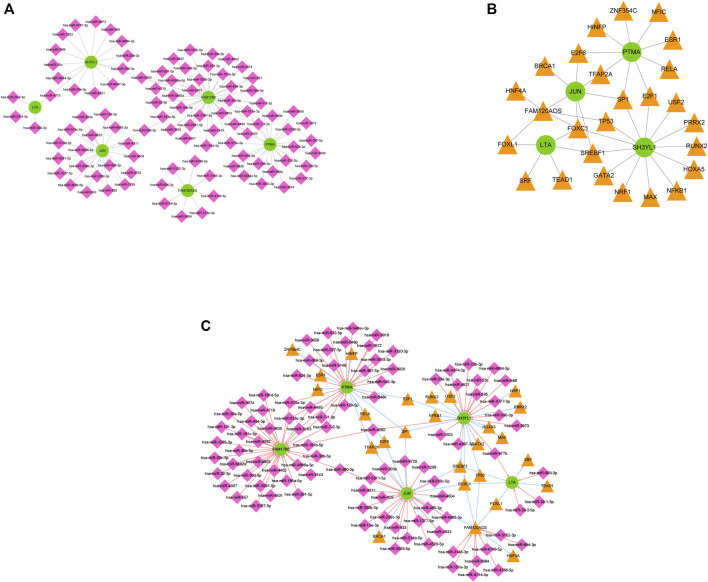
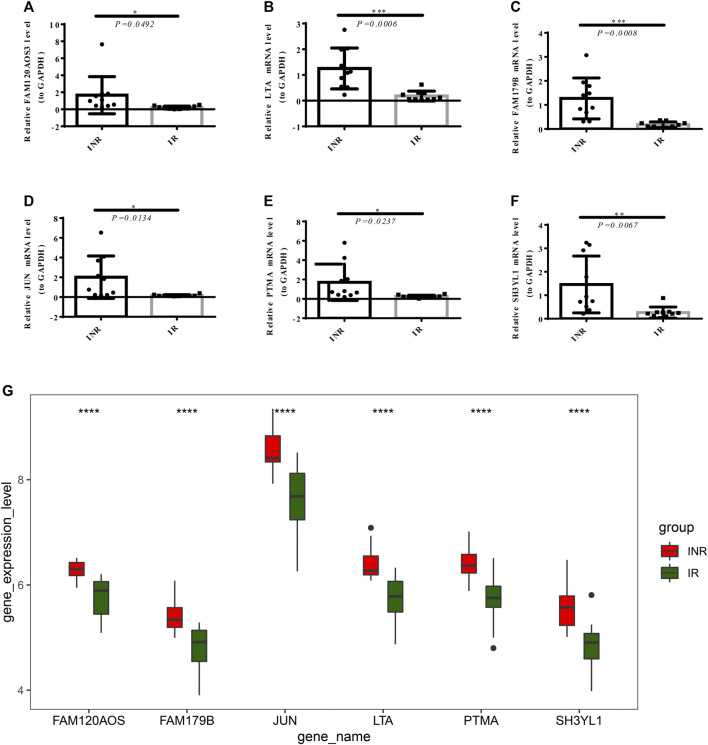
Background: HIV-infected immunological non-responders (INRs) are characterized by their inability to reconstitute CD4+ T cell pools after antiretroviral therapy. The risk of non-AIDS-related diseases in INRs is increased, and the outcome and prognosis of INRs are inferior to that of immunological responders (IRs). However, few markers can be used to define INRs precisely. In this study, we aim to identify further potential diagnostic markers associated with INRs through bioinformatic analyses of public datasets. Methods: This study retrieved the microarray data sets of GSE106792 and GSE77939 from the Gene Expression Omnibus (GEO) database. After merging two microarray data and adjusting the batch effect, differentially expressed genes (DEGs) were identified. Gene Ontology (GO) resource and Kyoto Encyclopedia of Genes and Genomes (KEGG) resource were conducted to analyze the biological process and functional enrichment. We performed receiver operating characteristic (ROC) curves to filtrate potential diagnostic markers for INRs. Gene Set Enrichment Analysis (GSEA) was conducted to perform the pathway enrichment analysis of individual genes. Single sample GSEA (ssGSEA) was performed to assess scores of immune cells within INRs and IRs. The correlations between the diagnostic markers and differential immune cells were examined by conducting Spearman's rank correlation analysis. Subsequently, miRNA-mRNA-TF interaction networks in accordance with the potential diagnostic markers were built with Cytoscape. We finally verified the mRNA expression of the diagnostic markers in clinical samples of INRs and IRs by performing RT-qPCR. Results: We identified 52 DEGs in the samples of peripheral blood mononuclear cells (PBMC) between INRs and IRs. A few inflammatory and immune-related pathways, including chronic inflammatory response, T cell receptor signaling pathway, were enriched. FAM120AOS, LTA, FAM179B, JUN, PTMA, and SH3YL1 were considered as potential diagnostic markers. ssGSEA results showed that the IRs had significantly higher enrichment scores of seven immune cells compared with IRs. The miRNA-mRNA-TF network was constructed with 97 miRNAs, 6 diagnostic markers, and 26 TFs, which implied a possible regulatory relationship. Conclusion: The six potential crucial genes, FAM120AOS, LTA, FAM179B, JUN, PTMA, and SH3YL1, may be associated with clinical diagnosis in INRs. Our study provided new insights into diagnostic and therapeutic targets.
Keywords: INRs; IRs; bioinformatic gene analysis; diagnostic markers; gene expression omnibus.
Copyright © 2021 Bai, Li, Hou, Lv, Wang, Hua, Wu and Dai.
Conflict of interest statement
The authors declare that the research was conducted in the absence of any commercial or financial relationships that could be construed as a potential conflict of interest.
Figures
References
-
- Baker J. V., Peng G., Rapkin J., Krason D., Reilly C., Cavert W. P., et al. (2008b). Poor Initial CD4+ Recovery with Antiretroviral Therapy Prolongs Immune Depletion and Increases Risk for AIDS and Non-AIDS Diseases. J. Acquir. Immune. Defic. Syndr. 48, 541–546. 10.1097/QAI.0b013e31817bebb3 - DOI - PMC - PubMed
LinkOut - more resources
Full Text Sources
Research Materials
Miscellaneous