. 2021 Dec 23:8:793174.
doi: 10.3389/fvets.2021.793174. eCollection 2021.

Comparison of Gut Microbiota and Metabolic Status of Sows With Different Litter Sizes During Pregnancy

Affiliations

Comparison of Gut Microbiota and Metabolic Status of Sows With Different Litter Sizes During Pregnancy

Jiali Chen et al. Front Vet Sci. .

Abstract

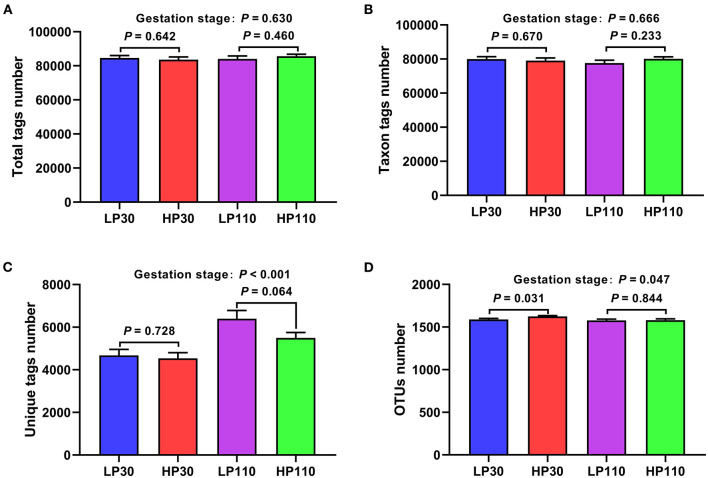
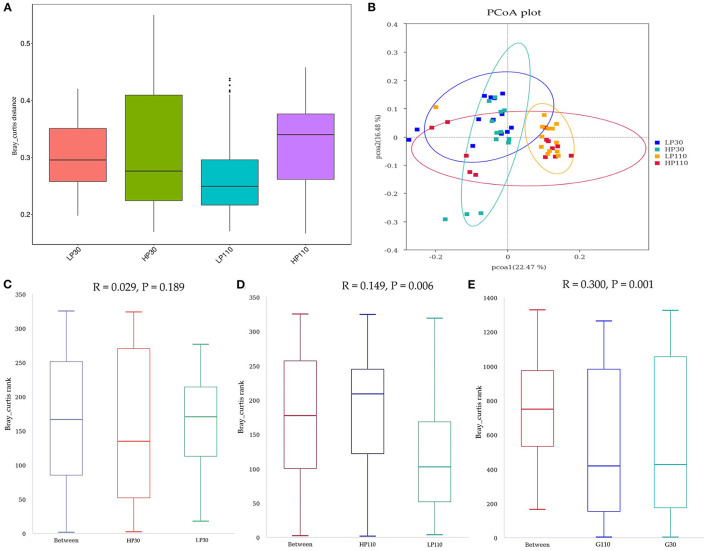
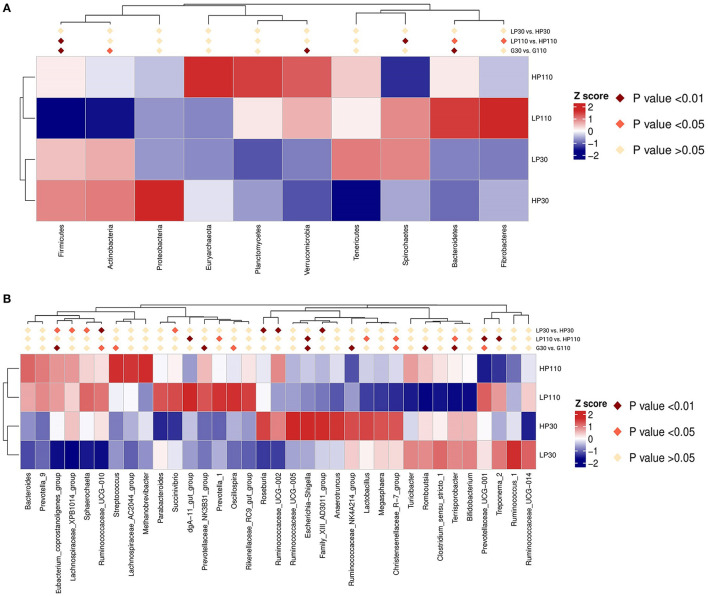
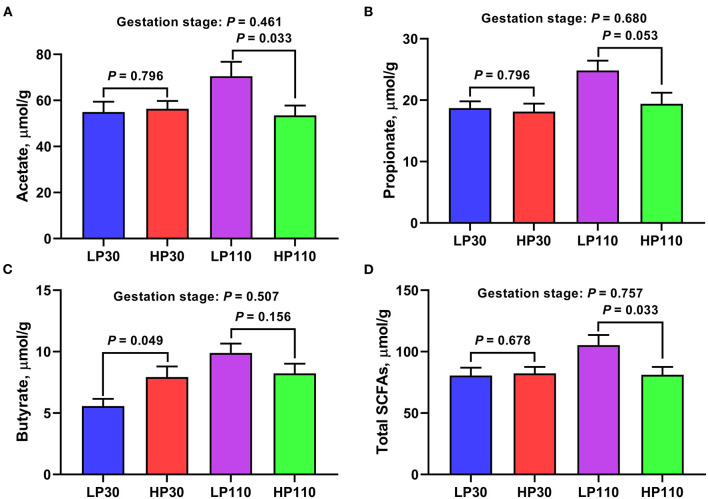
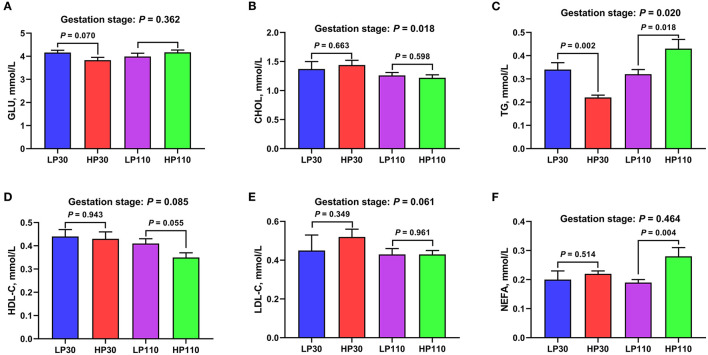
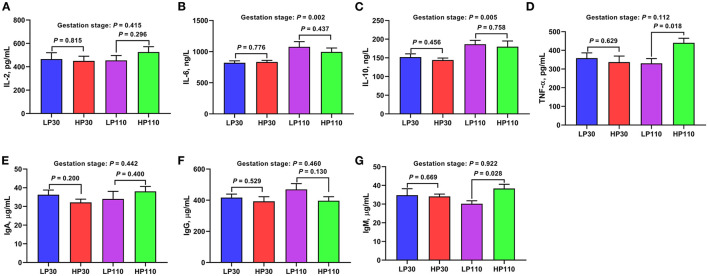
The experiment was conducted to compare the differences of gut microbiota and metabolic status of sows with different litter sizes on days 30 and 110 of gestation, and uncover the relationship between the composition of maternal gut microbiota during gestation and sow reproductive performance. Twenty-six Large White × Landrace crossbred multiparous sows (2nd parity) with similar back fat thickness and body weight were assigned to two groups [high-reproductive performance group (HP group) and low-reproductive performance group (LP group)] according to their litter sizes and fed a common gestation diet. Results showed that compared with LP sows, HP sows had significantly lower plasma levels of triglyceride (TG) on gestation d 30 (P < 0.05), but had significantly higher plasma levels of TG, non-esterified fatty acid, tumor necrosis factor-α, and immunoglobulin M on gestation d 110 (P < 0.05). Consistently, HP sows revealed increased alpha diversity and butyrate-producing genera, as well as fecal butyrate concentration, on gestation d 30; HP sows showed significantly different microbiota community structure with LP sows (P < 0.05) and had markedly higher abundance of Firmicutes (genera Christensenellaceae_R-7_group and Terrisporobacter) which were positively related with litter size on gestation d 110 than LP sows (P < 0.05). In addition, plasma biochemical parameters, plasma cytokines, and fecal microbiota shifted dramatically from gestation d 30 to d 110. Therefore, our findings demonstrated that microbial abundances and community structures differed significantly between sows with different litter sizes and gestation stages, which was associated with changes in plasma biochemical parameters, inflammatory factors, and immunoglobulin. Moreover, these findings revealed that there was a significant correlation between litter size and gut microbiota of sows, and provided a microbial perspective to improve sow reproductive performance in pig production.

Keywords: gestation stage; gut microbiota; litter size; metabolic status; reproductive performance; sow.


Conflict of interest statement

The authors declare that the research was conducted in the absence of any commercial or financial relationships that could be construed as a potential conflict of interest.

Figures

Figure 1
Figure 1
Operational taxonomic unit (OUT) clustering and annotation of sow fecal samples on d 30 and d 110 of gestation. (A) Total tags number; (B) taxon tags number; (C) unique tags number; (D) OTUs number. LP30 and LP110: sows with low-reproductive performance on d 30 and d 110 of gestation, respectively; HP30 and HP110: sows with high-reproductive performance on d 30 and d 110 of gestation, respectively. Gestation stage: difference in the variations between gestation d 30 and d 110. Values are mean ± standard error (n = 13).
Figure 2
Figure 2
Difference on bacteria community diversity and richness among different groups on d 30 and 110 of gestation. (A) Shannon index; (B) Simpson index; (C) Chao 1 index; (D) ACE index. LP30 and LP110: sows with low-reproductive performance on d 30 and 110 of gestation, respectively; HP30 and HP110: sows with high-reproductive performance on d 30 and 110 of gestation, respectively. Gestation stage: difference in the variations between gestation d 30 and 110. Values are mean ± standard error (n = 13).
Figure 3
Figure 3
The beta diversity of microbial communities in the groups on d 30 and d 110 of gestation. (A) The Bray-Curtis distance within each group. (B) The principal coordinate analysis (PCoA) profile of the two groups displayed with the Bray-Curtis distance. Each dot represents one sample from each group. The percent variation explained by each principal coordinate is indicated on the X and Y axis. (C–E) Analysis of similarity (ANOSIM). R value is scaled to lie between −1 and +l. Generally, 0 < R < 1 and P < 0.05 represents that there were significant differences between the groups. LP30 and LP110: sows with low-reproductive performance on d 30 and d 110 of gestation, respectively; HP30 and HP110: sows with high-reproductive performance on d 30 and d 110 of gestation, respectively. n = 13 for each group.
Figure 4
Figure 4
Changes of the relative abundance at phylum and genus levels. (A) Unweighted pair-group method with arithmetic mean (UPGMA) clustering analysis with the Bray-Curtis distance. The left panel shows the phylogenic tree, and the right panel displays the relative abundance of each group at the phylum level. (B) The phylogenetic tree constructed based on the sequence of the top 35 genera. The branches with different colors in the inner circle represent their corresponding phylum, and the stacked column chart in the outer circle indicates the relative abundance of each genus in different treatments. LP30 and LP110: sows with low-reproductive performance on d 30 and 110 of gestation, respectively; HP30 and HP110: sows with high-reproductive performance on d 30 and 110 of gestation, respectively. n = 13 for each group.
Figure 5
Figure 5
Heatmap distribution of OTUs in sow feces for all groups. (A) Comparison of the relative abundances of sow fecal microbiota in the top 10 at the phylum level. (B) Comparison of the relative abundances of sow fecal microbiota in the top 35 at the genus level. Different colors show the relative abundance of taxa. Fecal bacterial abundances were standardized with Z-score prior to the analyses. Positive z-scores reflect abundances above the average, whereas a negative z-score indicates abundance below the average. LP30 and LP110: sows with low-reproductive performance on d 30 and d 110 of gestation, respectively; HP30 and HP110: sows with high-reproductive performance on d 30 and d 110 of gestation, respectively. n = 13 for each group.
Figure 6
Figure 6
Fecal short-chain fatty acids (SCFAs) concentrations in low- and high-reproductive performance groups on d 30 and 110 of gestation. (A) Acetate. (B) Propionate. (C) Butyrate. (D) Total SCFAs. Total SCFAs, the sum of acetate, propionate, and butyrate. LP30 and LP110: sows with low-reproductive performance on d 30 and 110 of gestation, respectively; HP30 and HP110: sows with high-reproductive performance on d 30 and 110 of gestation, respectively. Gestation stage: difference in the variations between gestation d 30 and d 110. Values are mean ± standard error (n = 13).
Figure 7
Figure 7
The levels of plasma metabolites in low- and high-reproductive performance groups on d 30 and 110 of gestation. (A) Glucose (GLU); (B) Cholesterol (CHOL); (C) Triglyceride (TG); (D) High density lipoprotein cholesterol (HDL-C); (E) Low density lipoprotein cholesterol (LDL-C); (F) Non-esterified fatty acid (NEFA). LP30 and LP110: sows with low-reproductive performance on d 30 and 110 of gestation, respectively; HP30 and HP110: sows with high-reproductive performance on d 30 and 110 of gestation, respectively. Gestation stage: difference in the variations between gestation d 30 and d 110. Values are mean ± standard error (n = 13).
Figure 8
Figure 8
The levels of inflammatory factors and immunoglobulins in low- and high-reproductive performance groups on d 30 and 110 of gestation. (A) Interleukin-2 (IL-2); (B) Interleukin-6 (IL-6); (C) Interleukin-10 (IL-10); (D) Tumor necrosis factor-α (TNF-α); (E) Immunoglobulin A (IgA); (F) Immunoglobulin G (IgG); (G) Immunoglobulin M (IgM). LP30 and LP110: sows with low-reproductive performance on d 30 and 110 of gestation, respectively; HP30 and HP110: sows with high-reproductive performance on d 30 and 110 of gestation, respectively. Gestation stage: difference in the variations between gestation d 30 and d 110. Values are mean ± standard error (n = 13).
Figure 9
Figure 9
The plasma concentrations of reproductive hormones in low- and high-reproductive performance groups on d 30 and 110 of gestation. (A) Progesterone; (B) Estrogen; (C) Lutropin; (D) Prolactin. LP30 and LP110: sows with low-reproductive performance on d 30 and 110 of gestation, respectively; HP30 and HP110: sows with high-reproductive performance on d 30 and 110 of gestation, respectively. Gestation stage: difference in the variations between gestation d 30 and d 110. Values are mean ± standard error (n = 13).
Figure 10
Figure 10
Correlation analysis between the plasma biochemical indices and sow fecal microbiota. (A) At phylum level; (B) At genus level. GLU, Glucose; CHOL, cholesterol; TG, triglyceride; HDL-C, high density lipoprotein cholesterol, LDL-C, low density lipoprotein cholesterol; NEFA, non-esterified fatty acid; IL-2, interleukin-2; IL-6, interleukin-6; IL-10, interleukin-10; TNF-α, tumor necrosis factor-α; IgA, immunoglobulin A; IgG, immunoglobulin G; IgM, immunoglobulin M. +The correlation tends to be significant at a level of 0.10; *the correlation is significant at a level of 0.05; ** the correlation is significant at a level of 0.01.

References

    1. Camp JG, Kanther M, Semova I, Rawls JF. Patterns and scales in gastrointestinal microbial ecology. Gastroenterology. (2009) 136:1989–2002. 10.1053/j.gastro.2009.02.075 - DOI - PMC - PubMed
    1. Letarov A, Kulikov E. The bacteriophages in human- and animal body-associated microbial communities. J Appl Microbiol. (2009) 107:1–13. 10.1111/j.1365-2672.2009.04143.x - DOI - PubMed
    1. Sender R, Fuchs S, Milo R. Revised estimates for the number of human and bacteria cells in the body. PLoS Biol. (2016) 14:e1002533. 10.1371/journal.pbio.1002533 - DOI - PMC - PubMed
    1. Spor A, Koren O, Ley R. Unravelling the effects of the environment and host genotype on the gut microbiome. Nat Rev Microbiol. (2011) 9:279–90. 10.1038/nrmicro2540 - DOI - PubMed
    1. Wu GD, Chen J, Hoffmann C, Bittinger K, Chen YY, Keilbaugh SA, et al. Linking long-term dietary patterns with gut microbial enterotypes. Science. (2011) 334:105–8. 10.1126/science.1208344 - DOI - PMC - PubMed