Elevated Serum Chloride Levels Contribute to a Poor Prognosis in Patients with IgA Nephropathy
- PMID: 35005032
- PMCID: PMC8739901
- DOI: 10.1155/2021/3598135
Elevated Serum Chloride Levels Contribute to a Poor Prognosis in Patients with IgA Nephropathy
Abstract
Introduction: The identification of reliable prognostic factors is a crucial requirement for patients with IgA nephropathy (IgAN). Here, we explored the relationship between serum chloride levels and prognosis in patients with IgAN.
Methods: We recruited all patients with primary IgAN, as diagnosed by renal biopsy, between 1st January 2015 and 1st April 2019. Patients were divided two groups (high chloride group and low chloride group) based on the best cut-off values from survival receiver operating characteristic (ROC) curves. The baseline clinicopathological characteristics of two groups were then compared. Cox proportional hazard models were used to determine the prognostic value of serum chloride levels in patients with IgAN. Finally, we screened reliable prognostic indicators and built a clinical prediction model and validated the performance of the model.
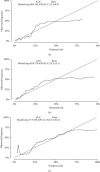
Results: Compared with patients in the high chloride group, patients in the low chloride group had significantly lower levels of 24-hour urinary total protein (24 h-UTP), serum creatinine (sCr), and higher levels of hemoglobin (Hb), albumin (all p < 0.05), and less proportion of Oxford classification grade E1 (endothelial cell proliferation) and T2 (renal tubule atrophy or renal interstitial fibrosis). Cox analysis revealed that serum chloride level ≥ 105.4 mmol/L was a significant and independent risk factor for prognosis in patients with IgAN (p < 0.05). Serum chloride, sCr, T, hypertension, and Hb were used to generate a predictive model for prognosis. Thec-indices of our predictive model were 0.80, 0.86, and 0.78, for 1, 2, and 3 years, respectively; Brier scores were 0.06, 0.09, and 0.16, respectively.
Conclusions: A serum chloride level ≥ 105.4 mmol/l was identified as a significant and independent risk factor for the prognosis of patients with IgAN. A predictive prognosis model was generated using serum chloride, sCr, T, hypertension, and Hb; this model exhibited a good predictive effect.
Copyright © 2021 Yaling Zhai et al.
Conflict of interest statement
The authors declare no competing interests.
Figures


Similar articles
-
Is serum hemoglobin level an independent prognostic factor for IgA nephropathy?: a systematic review and meta-analysis of observational cohort studies.Ren Fail. 2023 Dec;45(1):2171885. doi: 10.1080/0886022X.2023.2171885. Ren Fail. 2023. PMID: 36715437 Free PMC article.
-
Delta corticomedullary apparent diffusion coefficient on MRI as a biomarker for prognosis in IgA nephropathy.Ren Fail. 2025 Dec;47(1):2441394. doi: 10.1080/0886022X.2024.2441394. Epub 2024 Dec 17. Ren Fail. 2025. PMID: 39689921 Free PMC article.
-
The prognostic value of the systemic immune inflammation index in patients with IgA nephropathy.Ren Fail. 2024 Dec;46(2):2381613. doi: 10.1080/0886022X.2024.2381613. Epub 2024 Jul 22. Ren Fail. 2024. PMID: 39039867 Free PMC article.
-
Clinical and prognostic significance of C1q deposition in IgAN patients-a retrospective study.Int Immunopharmacol. 2020 Nov;88:106896. doi: 10.1016/j.intimp.2020.106896. Epub 2020 Oct 14. Int Immunopharmacol. 2020. PMID: 33182045
-
The predictive value of free thyroxine combined with tubular atrophy/interstitial fibrosis for poor prognosis in patients with IgA nephropathy.Front Endocrinol (Lausanne). 2024 May 14;15:1372824. doi: 10.3389/fendo.2024.1372824. eCollection 2024. Front Endocrinol (Lausanne). 2024. PMID: 38808109 Free PMC article.
Cited by
-
Development of a nomogram to predict the prognosis of patients with secondary bone tumors in the intensive care unit: a retrospective analysis based on the MIMIC IV database.J Cancer Res Clin Oncol. 2024 Mar 28;150(3):164. doi: 10.1007/s00432-024-05667-9. J Cancer Res Clin Oncol. 2024. PMID: 38546896 Free PMC article.
-
The impact of Lactobacillus and Bifidobacterium probiotic cocktail on modulation of gene expression of gap junctions dysregulated by intestinal pathogens.Arch Microbiol. 2022 Jun 23;204(7):417. doi: 10.1007/s00203-022-03026-1. Arch Microbiol. 2022. PMID: 35737111
-
Clinical impact of concomitant BIO-three use in advanced or recurrent non-small cell lung cancer treated with immune-checkpoint inhibitor.Int J Clin Oncol. 2024 Dec;29(12):1840-1849. doi: 10.1007/s10147-024-02622-z. Epub 2024 Sep 15. Int J Clin Oncol. 2024. PMID: 39278980
-
Is serum hemoglobin level an independent prognostic factor for IgA nephropathy?: a systematic review and meta-analysis of observational cohort studies.Ren Fail. 2023 Dec;45(1):2171885. doi: 10.1080/0886022X.2023.2171885. Ren Fail. 2023. PMID: 36715437 Free PMC article.
-
Machine learning-based diagnosis and prognosis of IgAN: A systematic review and meta-analysis.Heliyon. 2024 Jun 14;10(12):e33090. doi: 10.1016/j.heliyon.2024.e33090. eCollection 2024 Jun 30. Heliyon. 2024. PMID: 38988582 Free PMC article. Review.
References
MeSH terms
Substances
LinkOut - more resources
Full Text Sources
Miscellaneous

