

Knockdown of lncRNA CCAT1 Inhibits the Progression of Colorectal Cancer via hsa-miR-4679 Mediating the Downregulation of GNG10
- PMID: 35005034
- PMCID: PMC8739552
- DOI: 10.1155/2021/8930813
Knockdown of lncRNA CCAT1 Inhibits the Progression of Colorectal Cancer via hsa-miR-4679 Mediating the Downregulation of GNG10
Abstract
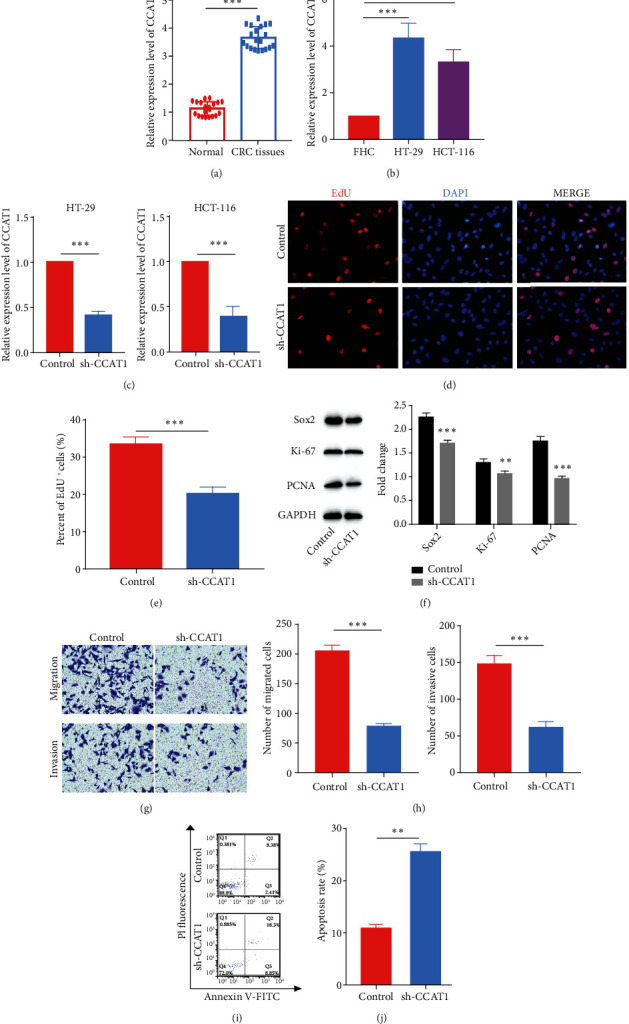
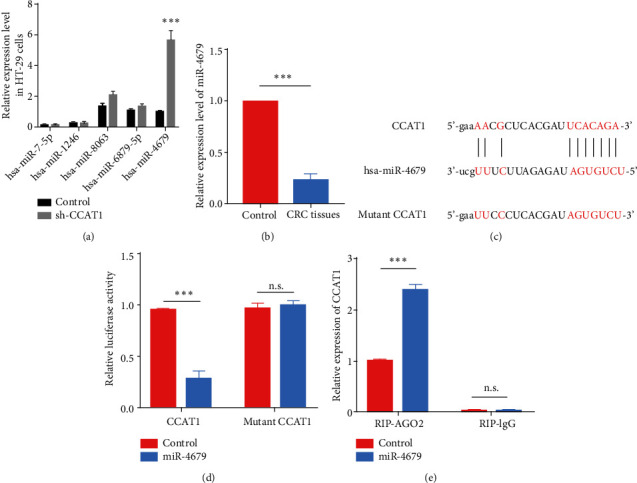
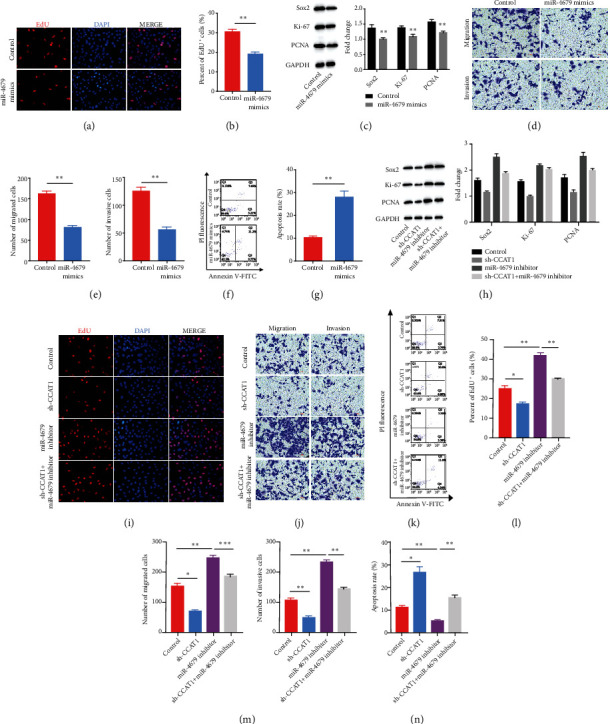
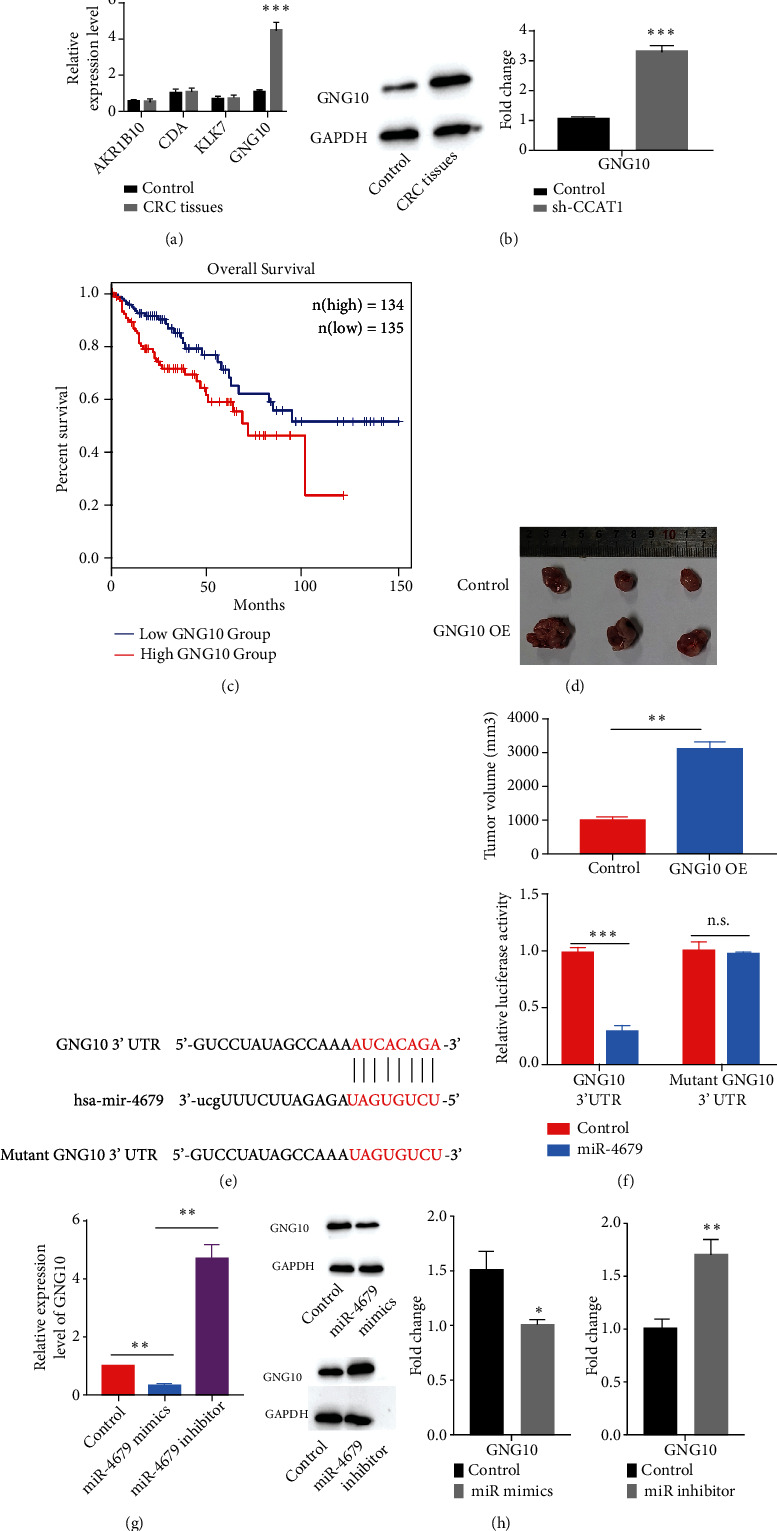
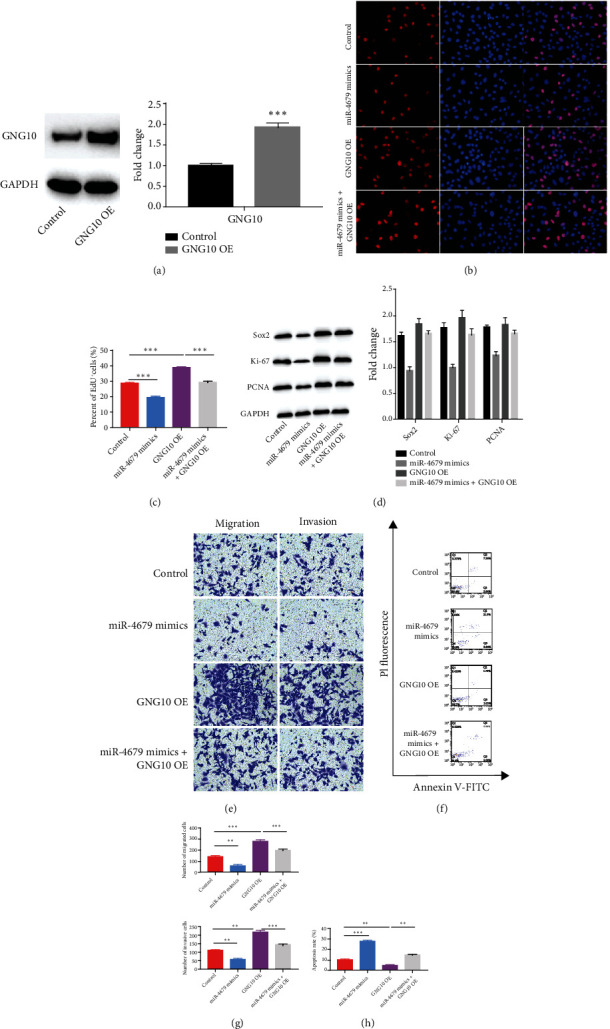
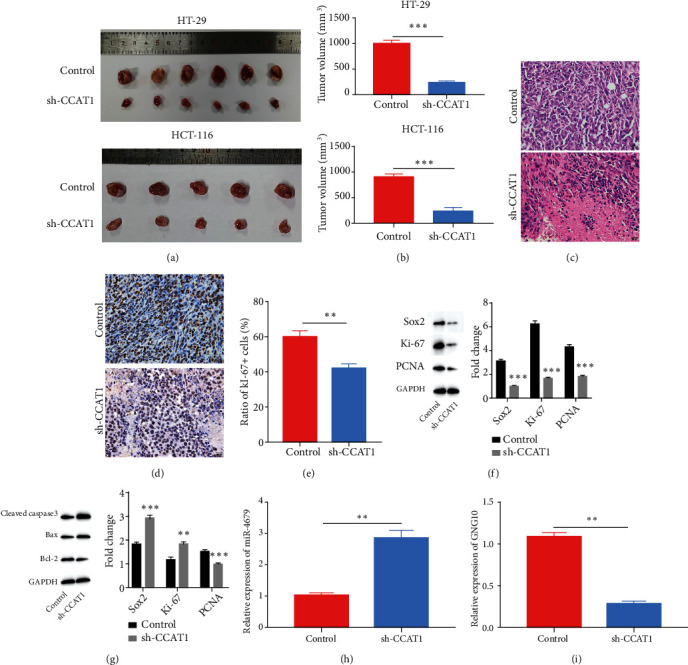
Great concerns have raised crucial roles of long noncoding RNAs (lncRNAs) on colorectal cancer progression due to the increasing number of studies in cancer development. Previous studies reveal that lncRNA CCAT1 plays an important role in the progression of a variety of cancers. However, the role of lncRNA CCAT1 in colorectal cancer is still unclear. In this study, we found that in both colorectal tissues and cell lines the level of lncRNA CCAT1 was increased. Downregulation of lncRNA CCAT1 inhibited the proliferation, migration, and invasion of colorectal cell lines and promoted apoptosis. We then found that hsa-miR-4679 could bind to lncRNA CCAT1 directly, and with further functional analyses, we confirmed that lncRNA CCAT1 sponged hsa-miR-4679 to promote the progression of colorectal cancer. Next, we found that hsa-miR-4679 was directly bound to 3'UTR of GNG10 (guanine nucleotide-binding protein, gamma 10). GNG10 overexpression promoted the progression of colorectal cancer, and this phenotype could be reversed by miR-4679 mimics. At last, we knocked down CCAT1 in vivo and found that sh-CCAT1 reduced the tumor size and the number of proliferating cells. In summary, our findings revealed that lncRNA CCAT1 facilitated colorectal cancer progression via the hsa-miR-4679/GNG10 axis and provided new potential therapeutic targets for colorectal cancer.
Copyright © 2021 Ning Wang et al.
Conflict of interest statement
The authors declare that they have no conflicts of interest.
Figures
Similar articles
-
Long non-coding RNA CCAT1 is a prognostic biomarker for the progression of oral squamous cell carcinoma via miR-181a-mediated Wnt/β-catenin signaling pathway.Cell Cycle. 2019 Nov;18(21):2902-2913. doi: 10.1080/15384101.2019.1662257. Epub 2019 Sep 4. Cell Cycle. 2019. PMID: 31599709 Free PMC article.
-
Long non-coding RNA CCAT1 promotes colorectal cancer progression by regulating miR-181a-5p expression.Aging (Albany NY). 2020 May 7;12(9):8301-8320. doi: 10.18632/aging.103139. Epub 2020 May 7. Aging (Albany NY). 2020. PMID: 32380476 Free PMC article.
-
lncRNA CCAT1 is a biomarker for the proliferation and drug resistance of esophageal cancer via the miR-143/PLK1/BUBR1 axis.Mol Carcinog. 2019 Dec;58(12):2207-2217. doi: 10.1002/mc.23109. Epub 2019 Sep 22. Mol Carcinog. 2019. PMID: 31544294
-
Effect of rs67085638 in long non-coding RNA (CCAT1) on colon cancer chemoresistance to paclitaxel through modulating the microRNA-24-3p and FSCN1.J Cell Mol Med. 2021 Apr;25(8):3744-3753. doi: 10.1111/jcmm.16210. Epub 2021 Mar 11. J Cell Mol Med. 2021. PMID: 33709519 Free PMC article.
-
Long noncoding RNA LINC01234 promoted cell proliferation and invasion via miR-1284/TRAF6 axis in colorectal cancer.J Cell Biochem. 2020 Oct;121(10):4295-4309. doi: 10.1002/jcb.29618. Epub 2020 Jan 6. J Cell Biochem. 2020. PMID: 31904146
Cited by
-
Combination of tamoxifen and D-limonene enhances therapeutic efficacy in breast cancer cells.Med Oncol. 2023 Jun 30;40(8):216. doi: 10.1007/s12032-023-02081-y. Med Oncol. 2023. PMID: 37391551
-
Weighted gene co-expression network analysis and CIBERSORT screening of key genes related to m6A methylation in Hirschsprung's disease.Front Genet. 2023 Apr 18;14:1183467. doi: 10.3389/fgene.2023.1183467. eCollection 2023. Front Genet. 2023. PMID: 37144136 Free PMC article.
-
CCAT 1- A Pivotal Oncogenic Long Non-Coding RNA in Colorectal Cancer.Br J Biomed Sci. 2023 Mar 21;80:11103. doi: 10.3389/bjbs.2023.11103. eCollection 2023. Br J Biomed Sci. 2023. PMID: 37025163 Free PMC article. Review.
-
Signal Transducer and Activator of Transcription 4-Induced Up-Regulated LINC01278 Enhances Proliferation and Invasion of Non-Small Cell Lung Cancer Cells via the MicroRNA-877-5p/Activating Transcription Factor 4 Axis.Tissue Eng Regen Med. 2024 Jun;21(4):595-608. doi: 10.1007/s13770-024-00625-5. Epub 2024 Mar 11. Tissue Eng Regen Med. 2024. PMID: 38466361 Free PMC article.
-
Genomic and Immunological Characterization of Pyroptosis in Lung Adenocarcinoma.J Oncol. 2022 Jul 27;2022:6905588. doi: 10.1155/2022/6905588. eCollection 2022. J Oncol. 2022. PMID: 35938142 Free PMC article.
References
MeSH terms
Substances
LinkOut - more resources
Full Text Sources
Medical
