. 2022 Jul;9(3):032205.
doi: 10.1117/1.NPh.9.3.032205. Epub 2022 Jan 5.

Computing hemodynamic response functions from concurrent spectral fiber-photometry and fMRI data

Affiliations

Computing hemodynamic response functions from concurrent spectral fiber-photometry and fMRI data

Tzu-Hao H Chao et al. Neurophotonics. 2022 Jul.

Abstract

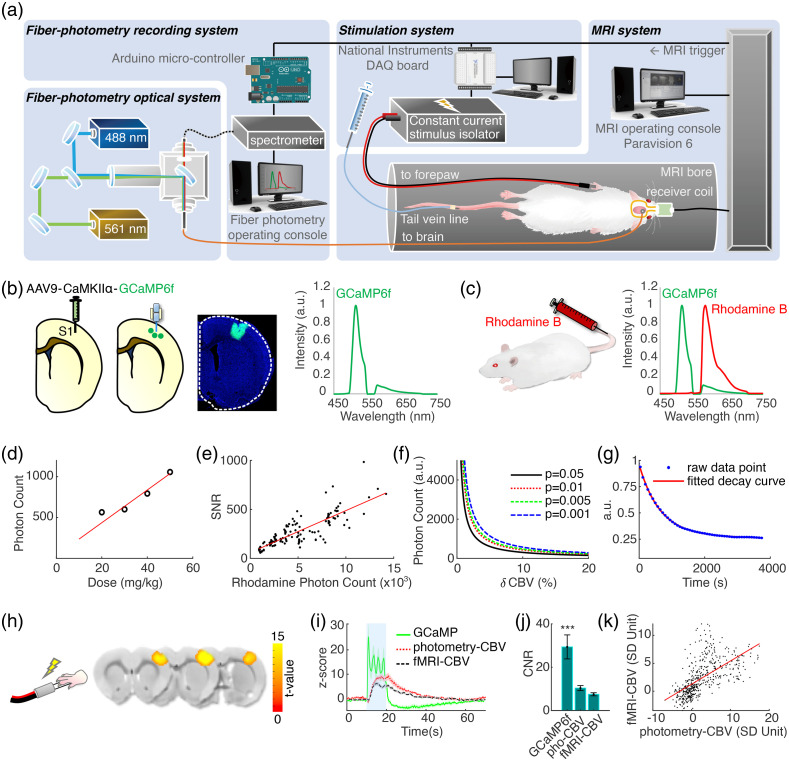
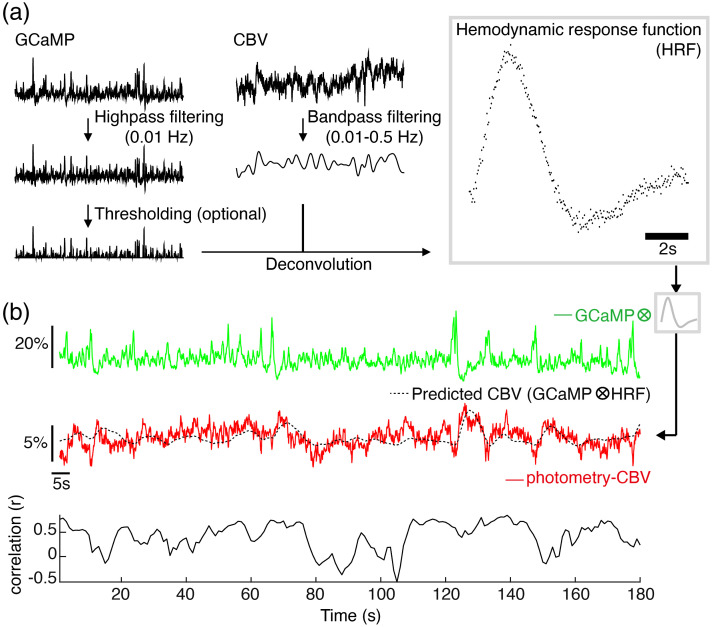
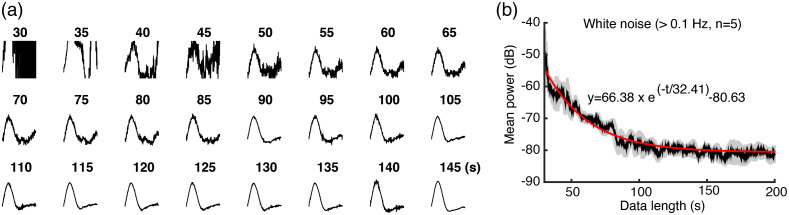
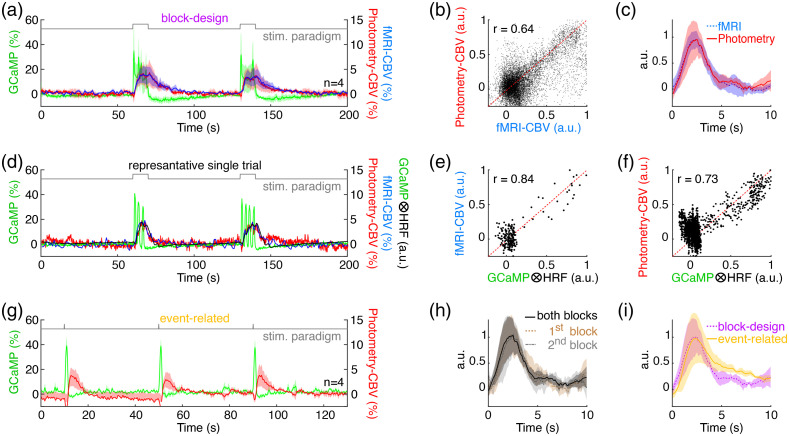
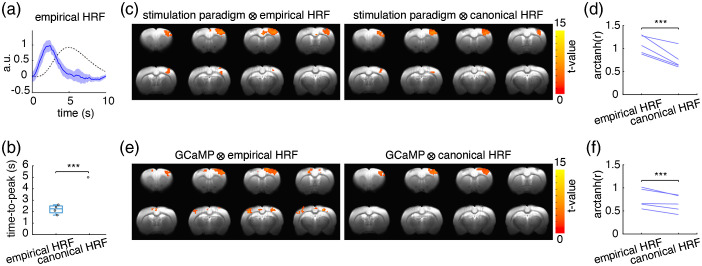
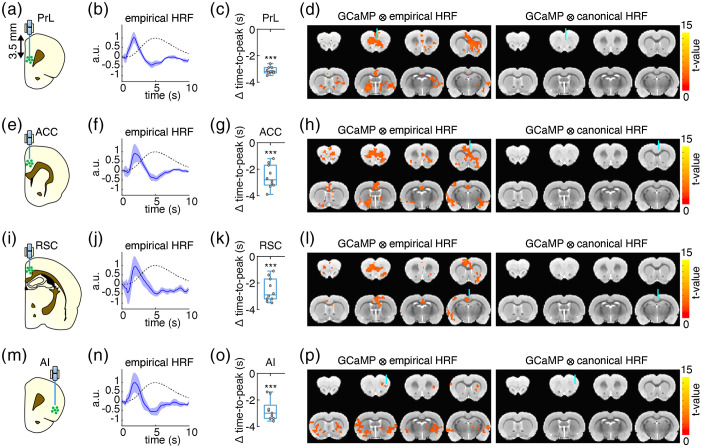
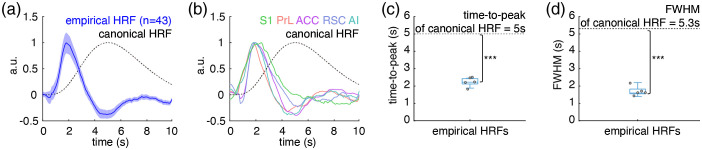
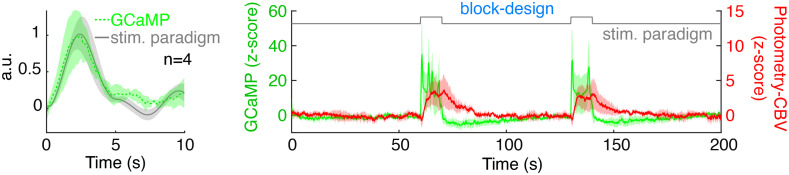
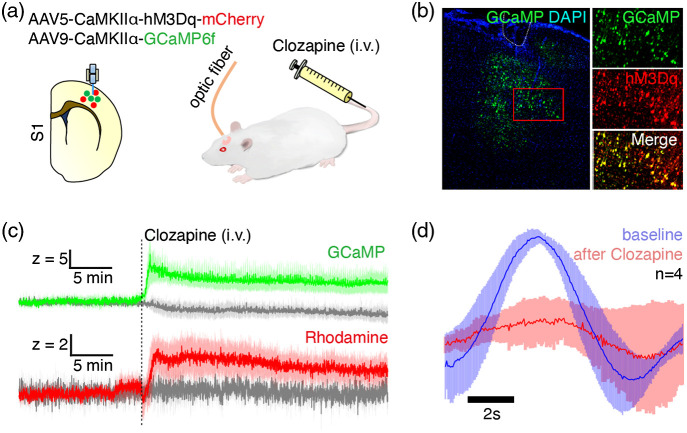
Significance: Although emerging evidence suggests that the hemodynamic response function (HRF) can vary by brain region and species, a single, canonical, human-based HRF is widely used in animal studies. Therefore, the development of flexible, accessible, brain-region specific HRF calculation approaches is paramount as hemodynamic animal studies become increasingly popular. Aim: To establish an fMRI-compatible, spectral, fiber-photometry platform for HRF calculation and validation in any rat brain region. Approach: We used our platform to simultaneously measure (a) neuronal activity via genetically encoded calcium indicators (GCaMP6f), (b) local cerebral blood volume (CBV) from intravenous Rhodamine B dye, and (c) whole brain CBV via fMRI with the Feraheme contrast agent. Empirical HRFs were calculated with GCaMP6f and Rhodamine B recordings from rat brain regions during resting-state and task-based paradigms. Results: We calculated empirical HRFs for the rat primary somatosensory, anterior cingulate, prelimbic, retrosplenial, and anterior insular cortical areas. Each HRF was faster and narrower than the canonical HRF and no significant difference was observed between these cortical regions. When used in general linear model analyses of corresponding fMRI data, the empirical HRFs showed better detection performance than the canonical HRF. Conclusions: Our findings demonstrate the viability and utility of fiber-photometry-based HRF calculations. This platform is readily scalable to multiple simultaneous recording sites, and adaptable to study transfer functions between stimulation events, neuronal activity, neurotransmitter release, and hemodynamic responses.

Keywords: Fiber-photometry; Hemodynamic response function; MRI compatible; fMRI; multi-modal; rat.


Figures

Fig. 1
Fig. 1
(a) The setup of the spectral fiber-photometry platform synchronized with a 9.4T small animal MRI system. 488- and 561-nm laser light is combined and delivered to the rat brain through a fiber optic cable connected to an implanted optical fiber. Fluorescence emission signal returns through the same cable, then is delivered to a spectrometer for recording, which is synchronized in time to 1 Hz fMRI acquisition by TTL pulses, upsampled to 10 Hz through an Arduino board. The stimulation system for electrical forepaw stimulation is also synchronized to fMRI acquisition and is controlled by a separate PC with a DAQ board. (b) GCaMP6f is expressed via microinjection of genetically engineered AAV into the target brain area. An optical fiber is implanted 0.3 mm above the injection site. The GCaMP6f emission wavelength has a peak at 515 nm. (c) To monitor CBV activity with photometry, Rhodamine B is injected via tail vein catheter. GCaMP6f and Rhodamine B spectra are unmixed to derive their coefficients for quantification. (d) Multi-dose test revealed that Rhodamine B spectral peak photon counts are linearly correlated with Rhodamine B injection dose (mg/kg). (e) The SNR and spectral peak photon counts of Rhodamine B recordings are linearly correlated. (f) Rhodamine B photon counts needed for detecting CBV changes of various magnitudes at different statistical thresholds. (g) The half-life of Rhodamine B clearance following bolus injection is measured at 698.3 s. (h) fMRI-CBV response maps to the electrical forepaw stimulation paradigm consisting of a 60 s initial baseline period followed by two sets of 10 s electrical forepaw stimulation blocks (9 Hz, 2.5 mA, 0.5 ms) with 60 s resting periods after each block. (i) Time-courses of GCaMP6f (green), photometry-CBV (red) and fMRI-CBV (black) from S1, aligned to electrical forepaw stimulation. (j) Photometry-CBV has higher CNR than fMRI-CBV (p<0.01), and GCaMP shows the highest CNR. The CNR is calculated by dividing the evoked response peak value with the standard deviation of baseline fluctuation (GCaMP: 25.36±5.31, Rhodamine-CBV: 7.93±1.4, fMRI-CBV: 6.18±0.74). (k) Photometry-CBV and fMRI-CBV peak response amplitudes to electrical forepaw stimulation are linearly correlated. Demo of simultaneous multimodal fiber-photometry and fMRI recordings in S1 (Video 1, MOV, 8 MB [URL: https://doi.org/10.1117/1.NPh.9.3.032205.1]).
Fig. 2
Fig. 2
A HRF derived from GCaMP6f and Rhodamine B signals in rat S1 has good predictability for S1 photometry-CBV changes. (a) The pipeline to calculate HRFs from simultaneously recorded GCaMP6f (green) and photometry-CBV (red) time-course. (b) An example of predicted-CBV activity (black) calculated by convolving the derived HRF [shown in (a)] with an independent GCaMP6f time-course (green), the predicted-CBV activity shows a high degree of correlation over time (correlation sliding window width = 5 s) with the corresponding, independently measured, photometry-CBV activity (red). Note that sometimes we observed flipping correlations between positive and negative. Specifically, this instability happened when there was relatively weak neuronal activity within the sliding window, where the CBV changes could be so subtle and buried under random noises. Therefore, the sliding window correlations during weak neuronal activity could be randomly positive or negative.
Fig. 3
Fig. 3
Optimization of the data length of GCaMP6f and photometry-CBV time-courses for calculating HRFs. (a) The resulting HRFs upon regression with different length (s) of GCaMP and CBV time-course. (b) High-frequency white noise (>0.1  Hz) is reduced to a steady-state when the training data are longer than 160  s (5 times the decay time constant). We defined the signals >0.1  Hz as noise because hemodynamic activity is commonly considered to be between 0.01-0.1 Hz. Optimization of the data length of GCaMP6f and photometry-CBV time-courses for calculating HRFs (Video 2, MP4, 6 MB [URL: https://doi.org/10.1117/1.NPh.9.3.032205.2]).
Fig. 4
Fig. 4
Cross-validation of HRFs derived from photometry-CBV and fMRI-CBV signal changes, or using different stimulation paradigms (n=4). (a) Simultaneously measured fMRI-CBV (blue), photometry-CBV (red) and GCaMP6f (green) time-courses from rat S1, aligned to block-design electrical forepaw stimulation paradigm (gray). (b) Photometry-CBV and fMRI-CBV signals from S1 during blocks of electrical forepaw stimulation are highly correlated (CBV time-courses from the four rats, two repetitions, are all normalized to individual maximum then pooled together). (c) Excellent agreement (ICC=0.99) was identified between the HRFs derived using fMRI-CBV (blue) and photometry-CBV (red). (d) Representative simultaneously measured fMRI-CBV (blue), photometry-CBV (red), and GCaMP6f (green) time-courses from rat S1, aligned to blocks of electrical forepaw stimulation. It should be noted that GCaMP signal drop below baseline after stimulation, likely due to hemoglobin absorption.,, The predicted-CBV time-course (black) calculated by convolving the GCaMP6f time-course with the photometry-CBV HRF (c), red is also shown. (e) The predicted-CBV via GCaMP6f time-course and the photometry-CBV HRF has a high correlation with the corresponding photometry-CBV time-course from the same independent dataset. (f) The predicted-CBV time-course calculated by convolving the GCaMP6f time-course with the fMRI-CBV HRF (c), blue also has a high correlation with the corresponding fMRI-CBV time-course from the same independent dataset. The CBV fluctuation around zero, might be due to spontaneous hemodynamic fluctuations by non-neural processes as described in the previous study. (g) Simultaneously measured fMRI-CBV (blue), photometry-CBV (red) and GCaMP6f (green) time-courses from rat S1, aligned to event-related forepaw stimulation paradigm (gray). (h) Excellent agreement (ICC=0.95) was identified between the HRFs derived using the photometry signals recorded during both blocks (0 to 200 s), first block (31-100 s), and second block (101-170 s) in (a). (i) Good agreement (ICC=0.82) was identified between the HRFs derived using the photometry signals of block-design (a) and event-related (g) stimulation paradigm. In all figures, the shaded area represents standard error. ICC agreement guideline given by Koo and Li (2016): below 0.50 = poor, between 0.50 and 0.75 = moderate, between 0.75 and 0.90 = good, above 0.90 = excellent.
Fig. 5
Fig. 5
Using the fiber-photometry derived empirical HRF for fMRI analyses improved detection of S1 activation clusters and downstream activity compared to analyses using the canonical HRF. (a) The rat S1 empirical HRF (blue, the shaded area represents standard error) derived using S1 GCaMP and photometry-CBV signals was substantially narrower than the human-based canonical HRF (black dashed line), which is implemented in the SPM package for brain data analysis by default. (b) The time-to-peak of the empirical HRF was significantly shorter than the canonical HRF (p<0.001). (c) The detected S1 activation cluster size was larger when the stimulation paradigm was convolved with the empirical HRF than with the canonical HRF for GLM analysis of the fMRI data (p<0.05corrected). (d) The correlation between the regressor-generated CBV time-course and the fMRI-CBV time-course measured from the corresponding S1 activation cluster was significantly higher when using the empirical HRF versus the canonical HRF for regressor calculation. The correlations were Fisher transformed to meet the requirement as normal distribution for Student T-test and shown in arctanh(r), p<0.001. (e) A significant activation cluster was detected in bilateral PPC by convolving the GCaMP6f signal with the empirical HRF but not the canonical HRF (p<0.05corrected). (f) The correlation between the regressor-generated CBV time-course and the fMRI-CBV time-course measured from the corresponding S1 activation cluster was significantly higher when using the empirical HRF and GCaMP6f signal versus the canonical HRF and GCaMP6f for regressor calculation The correlations were Fisher transformed to meet the requirement as normal distribution for Student T-test and shown in arctanh(r), p<0.001.
Fig. 6
Fig. 6
(a, e, i, and m) Fiber-photometry recording sites in rat cortical areas used for calculating empirical HRFs. Each rat was implanted fibers in PrL, ACC, RSC, and AI (n=10, each rat was recorded two repetitions of 10 min resting-state). (b, f, j, n) The empirical HRFs derived resting-state GCaMP6f and Rhodamine B time-course data recorded by fiber-photometry (blue solid line, the shaded area represents standard error) versus the canonical HRF (black dashed line). (c, g, k, o) The time-to-peak differences of the empirical HRFs versus canonical HRF (Δ time-to-peak); negative values indicate time-to-peak latencies shorter than the canonical HRF (all p<0.001). (d, h, l, p) GLM analyses of fMRI data using spontaneous GCaMP6f signals convolved with the empirical HRFs as regressors detected brain-wide functional networks (left panels), which could not be detected using the same GCaMP6f signals convolved with the canonical HRF as regressors (right panels) (p<0.05corrected, n=7). Note that the GLM coefficients below each optic fiber targeting site were not the strongest among the whole functional networks (left panels). It is likely due to confounds associated with fiber implantation and/or susceptibility effect cause by fiber, which is commonly observed in fMRI studies with optic fiber implant.
Fig. 7
Fig. 7
The average empirical rat cortical HRF derived from fiber-photometry GCaMP6f and Rhodamine B signal in rat S1, PrL, ACC, RSC, and AI is significantly faster and narrower than the canonical HRF. (a) The average empirical rat cortical HRF (blue solid line, the shaded area represents standard error) obtained from 44 total photometry recordings versus the canonical HRF (black dash line). The average empirical rat cortical HRF was pooled from HRFs in S1: n=4/2 repetitions, PrL/ACC/RSC/AI: n=10/2 repetitions. In addition to the S1 HRF, the HRFs of PrL, ACC, RSC, and AI were computed from the same group of animals using a four-channel recording system. The intraindividual HRFs were first averaged, then these average individual HRFs were used to calculate the average empirical rat cortical HRF. (b) The difference in shape between the empirical HRFs for individual cortical areas (colored solid lines) appears to be substantially smaller than between each HRF and the canonical HRF (black dashed line). (c) The time-to-peak latencies of the empirical HRFs are significantly shorter than the canonical HRF (p<0.001). (d) The FWHMs of the empirical HRFs are significantly narrower than the canonical HRF (p<0.001).
Fig. 8
Fig. 8
The CBV-based and BOLD-based HRFs, derived using block-design forepaw stimulation data, showed excellent agreement with each other (ICC=0.95, n=4).
Fig. 9
Fig. 9
Excellent agreement (ICC=0.94) was identified between the HRFs derived using GCaMP6f (green) and stimulation paradigm (gray).
Fig. 10
Fig. 10
Our technique provides an opportunity to address the hypothesis that HRFs are state dependent. Here, we used AAV vectors to co-express hM3Dq and GCaMP6f in rat S1 under the CaMKIIα promotor. (a) GcAMP6f combined with Rhodamine B injection enabled simultaneous measurement of neuronal activity and photometry-CBV, respectively, while hM3Dq activation by clozapine (0.05  mg/kg, i.v.) allowed the induction of an up-regulated state of local neuronal activity. (b) Histological evidence of colocalized expression of GCaMP6f and hM3Dq in S1 principal neurons. (c) Clozapine enhanced S1 GCaMP6f signal and caused a robust increase in S1 photometry-CBV. Note that clozapine is also an antipsychotic drug, yet used here to activate the hM3Dq receptors. (d) Importantly, an empirical HRF calculated from spontaneous resting-state activity time-courses from S1 after clozapine injection was significantly attenuated compared to an empirical HRF calculated from time-courses before clozapine injection, suggesting that HRFs can be state dependent.

Similar articles

Cited by

References

    1. Hillman E. M. C., “Coupling mechanism and significance of the BOLD signal: a status report,” Annu. Rev. Neurosci. 37, 161–181 (2014).ARNSD510.1146/annurev-neuro-071013-014111 - DOI - PMC - PubMed
    1. Logothetis N. K., “What we can do and what we cannot do with fMRI,” Nature 453(7197), 869–878 (2008).10.1038/nature06976 - DOI - PubMed
    1. Kwong K. K., et al. , “Dynamic magnetic resonance imaging of human brain activity during primary sensory stimulation,” Proc. Natl. Acad. Sci. U. S. A. 89(12), 5675–5679 (1992).10.1073/pnas.89.12.5675 - DOI - PMC - PubMed
    1. Boynton G. M., et al. , “Linear systems analysis of functional magnetic resonance imaging in human V1,” J. Neurosci. 16(13), 4207–4221 (1996).JNRSDS10.1523/JNEUROSCI.16-13-04207.1996 - DOI - PMC - PubMed
    1. Devonshire I. M., et al. , “Neurovascular coupling is brain region-dependent,” Neuroimage 59(3), 1997–2006 (2012).NEIMEF10.1016/j.neuroimage.2011.09.050 - DOI - PubMed