

Spectral analysis of ultrasound radiofrequency backscatter for the identification of epicardial adipose tissue
- PMID: 35005059
- PMCID: PMC8732943
- DOI: 10.1117/1.JMI.9.1.017001
Spectral analysis of ultrasound radiofrequency backscatter for the identification of epicardial adipose tissue
Abstract
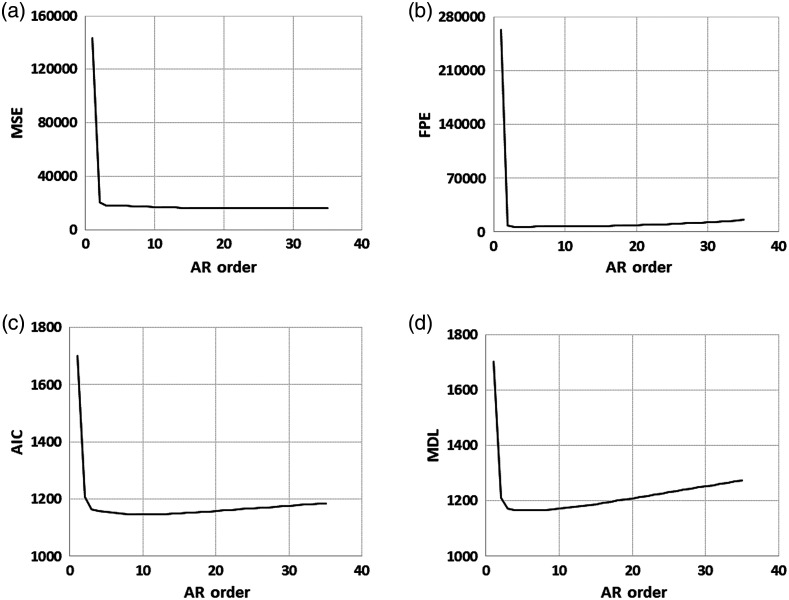
Purpose: The coronary arteries are embedded in a layer of fat known as epicardial adipose tissue (EAT). The EAT influences the development of coronary artery disease (CAD), and increased EAT volume can be indicative of the presence and type of CAD. Identification of EAT using echocardiography is challenging and only sometimes feasible on the free wall of the right ventricle. We investigated the use of spectral analysis of the ultrasound radiofrequency (RF) backscatter for its potential to provide a more complete characterization of the EAT. Approach: Autoregressive (AR) models facilitated analysis of the short-time signals and allowed tuning of the optimal order of the spectral estimation process. The spectra were normalized using a reference phantom and spectral features were computed from both normalized and non-normalized data. The features were used to train random forests for classification of EAT, myocardium, and blood. Results: Using an AR order of 15 with the normalized data, a Monte Carlo cross validation yielded accuracies of 87.9% for EAT, 84.8% for myocardium, and 93.3% for blood in a database of 805 regions-of-interest. Youden's index, the sum of sensitivity, and specificity minus 1 were 0.799, 0.755, and 0.933, respectively. Conclusions: We demonstrated that spectral analysis of the raw RF signals may facilitate identification of the EAT when it may not otherwise be visible in traditional B-mode images.
Keywords: epicardial adipose tissue; radiofrequency signals; spectral analysis; tissue characterization; ultrasound.
© 2022 Society of Photo-Optical Instrumentation Engineers (SPIE).
Figures


Similar articles
-
Spectral Analysis of Ultrasound Radiofrequency Backscatter for the Detection of Intercostal Blood Vessels.Ultrasound Med Biol. 2018 Jul;44(7):1411-1422. doi: 10.1016/j.ultrasmedbio.2018.03.007. Epub 2018 Apr 19. Ultrasound Med Biol. 2018. PMID: 29681422
-
Epicardial Adipose Tissue Thickness and Its Association With the Presence and Severity of Coronary Artery Disease in Clinical Setting: A Cross-Sectional Observational Study.J Clin Med Res. 2016 May;8(5):410-9. doi: 10.14740/jocmr2468w. Epub 2016 Mar 20. J Clin Med Res. 2016. PMID: 27081428 Free PMC article.
-
Clinical Utility of Measuring Epicardial Adipose Tissue Thickness with Echocardiography Using a High-Frequency Linear Probe in Patients with Coronary Artery Disease.J Am Soc Echocardiogr. 2015 Oct;28(10):1240-1246.e1. doi: 10.1016/j.echo.2015.07.006. Epub 2015 Aug 12. J Am Soc Echocardiogr. 2015. PMID: 26275751
-
Epicardial adipose tissue: far more than a fat depot.Cardiovasc Diagn Ther. 2014 Dec;4(6):416-29. doi: 10.3978/j.issn.2223-3652.2014.11.05. Cardiovasc Diagn Ther. 2014. PMID: 25610800 Free PMC article. Review.
-
Epicardial fat and coronary artery disease: Role of cardiac imaging.Atherosclerosis. 2021 Mar;321:30-38. doi: 10.1016/j.atherosclerosis.2021.02.008. Epub 2021 Feb 16. Atherosclerosis. 2021. PMID: 33636676 Review.
Cited by
-
Evaluation of state-of-the-art deep learning models in the segmentation of the left and right ventricles in parasternal short-axis echocardiograms.J Med Imaging (Bellingham). 2025 Mar;12(2):024002. doi: 10.1117/1.JMI.12.2.024002. Epub 2025 Mar 26. J Med Imaging (Bellingham). 2025. PMID: 40151505
-
Mapping adipose tissue in short-axis echocardiograms using spectral analysis.IEEE Int Ultrason Symp. 2023 Sep;2023:10.1109/ius51837.2023.10306900. doi: 10.1109/ius51837.2023.10306900. Epub 2023 Nov 7. IEEE Int Ultrason Symp. 2023. PMID: 39113821 Free PMC article.
References
Grants and funding
LinkOut - more resources
Full Text Sources
Research Materials
Miscellaneous
