. 2021 Dec 22:40:107739.
doi: 10.1016/j.dib.2021.107739. eCollection 2022 Feb.

A dataset describing glycolytic inhibitors overcoming the underestimation of maximal mitochondrial oxygen consumption rate in oligomycin-treated cells

Affiliations

A dataset describing glycolytic inhibitors overcoming the underestimation of maximal mitochondrial oxygen consumption rate in oligomycin-treated cells

Juliana S Ruas et al. Data Brief. .

Abstract

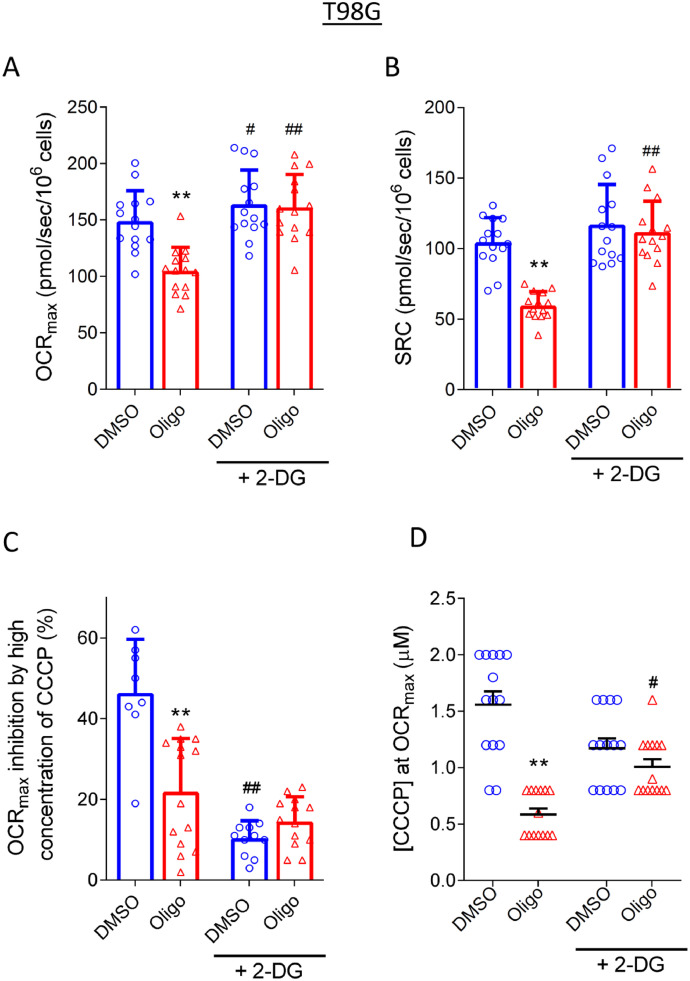
Determination of oxygen consumption is one of the most valuable methodologies to evaluate mitochondrial (dys)function. Previous studies demonstrated that a widely used protocol, consisting of adding the ATP synthase inhibitor oligomycin before mitochondrial respiratory uncoupling by sequential addition of a protonophore (e.g., carbonyl cyanide 3-chlorophenyl hydrazone [CCCP]), may lead to underestimation of maximal oxygen consumption rate (OCRmax) and spare respiratory capacity (SRC) parameters in highly glycolytic tumor cell lines. In this dataset, we report the effects of the glycolytic inhibitors 2-deoxy-D-glucose, iodoacetic acid, and lonidamine on overcoming the underestimation of OCRmax and SRC in oligomycin-treated cells. We propose a protocol in which 2-deoxy-D-glucose is added after oligomycin and just before the sequential addition of CCCP to avoid underestimation of OCRmax and SRC parameters in A549, C2C12, and T98G cells. The oxygen consumption rates were determined in intact suspended cell lines using a high-resolution oxygraph device. The data can be used in several fields of research that require characterization of mitochondrial respiratory parameters in intact cells.

Keywords: 2-Deoxi-D-glucose; Mitochondria; Mitochondrial membrane potential; Oligomycin; Oxygen consumption; Spare respiratory capacity; Tumor cell.


Conflict of interest statement

The authors declare that they have no known competing financial interests or personal relationships which have or could be perceived to have influenced the work reported in this article.

Figures

Fig 1:
Fig. 1
Effects of glycolytic inhibitors on the underestimation of maximal mitochondrial oxygen consumption rate (OCRmax) and spare respiratory capacity (SRC) in oligomycin-treated cells. T98G cells (1 × 106 /mL) were resuspended in a standard incubation medium in the presence or absence of glycolytic inhibitors. A and B: Effects of the glycolytic inhibitors 40 mM 2-deoxy-D-glucose (2-DG), 200 µM iodoacetic acid (IAA), and 400 µM lonidamine (LON) on OCRmax (A) and SRC (B), determined in the presence and absence of 1 µg/mL oligomycin (Oligo). DMSO (the oligomycin solvent) was present at a final concentration of 0.025% (v/v). **P < 0.01, statistically significant difference versus respective DMSO group; ##P < 0.01, statistically significant difference versus respective group without glycolytic inhibitors; two-way ANOVA/Bonferroni post-hoc test.
Fig 2:
Fig. 2
Representative traces of OCR determinations in T98G cells in the presence or absence of 2-DG. T98G cells (1 × 106 /mL) were resuspended in standard incubation medium. Oligomycin (1 µg/mL; Oligo; red traces), 0.025% (v/v) DMSO (blue traces), 40 mM 2-DG, and CCCP (400 nM each addition) were added where indicated by the arrows.
Fig 3:
Fig. 3
2-DG effects on the determination of OCRmax and SRC in T98G cells. T98G cells (1 × 106 /mL) were resuspended in standard incubation medium, and 0.025% (v/v) DMSO, 1 µg/mL oligomycin (Oligo), or 40 mM 2-DG were added to the experiments as indicated. A and B: 2-DG effects on OCRmax and SRC, respectively. C: OCRmax inhibition when cells were incubated in the presence of double-optimal CCCP concentrations. D: CCCP concentrations to reach OCRmax. **P < 0.01, statistically significant difference versus respective DMSO group; #P < 0.05 and ##P < 0.01, statistically significant difference versus respective group without 2-DG; two-way ANOVA/Bonferroni post-hoc test (A-C) or Kruskal-Wallis test/Dunn's post-hoc test (D).
Fig 4:
Fig. 4
2-DG effects on the determination of OCRmax and SRC in A549 cells. A549 cells (1.25 × 106 /mL) were resuspended in standard incubation medium, and 0.025% DMSO (v/v), 1 µg/mL oligomycin or 40 mM 2-DG were added to the experiments as indicated. A and B: 2-DG effects on OCRmax and SRC. C: OCRmax inhibition when cells were incubated in the presence of double-optimal CCCP concentrations. D: CCCP concentrations to reach OCRmax. **P < 0.01, statistically significant difference versus respective DMSO group; #P < 0.05 and ##P < 0.01, statistically significant difference versus respective group without 2-DG; two-way ANOVA/Bonferroni post-hoc test (A-C) or Kruskal-Wallis test/Dunn's post-hoc test (D).
Fig 5:
Fig. 5
2-DG effects on the determination of OCRmax and SRC in C2C12 cells. C2C12 cells (1 × 106 /mL) were resuspended in standard incubation medium, and 0.025% (v/v) DMSO, 1 µg/mL oligomycin or 40 mM 2-DG were added to the experiments as indicated. A and B: 2-DG effects on OCRmax and SRC. C: OCRmax inhibition when cells were incubated in the presence of double-optimal CCCP concentrations. D: CCCP concentrations to reach OCRmax. **P < 0.01, statistically significant difference versus respective DMSO group; #P < 0.05 and ##P < 0.01, statistically significant difference versus respective group without 2-DG; two-way ANOVA/Bonferroni post-hoc test (A-C) or Kruskal-Wallis test/Dunn's post-hoc test (D).
Fig 6:
Fig. 6
Simultaneous determination of OCR and mitochondrial membrane potential (∆Ψ) in T98G cells: 2-DG and oligomycin effects. T98G cells (1.5 × 106/mL) were resuspended in standard incubation medium containing 500 nM TMRM and 1 µM TPB. DMSO (0.025%, v/v), 1 µg/mL oligomycin (Oligo) or 40 mM 2-DG were added to the experiments as indicated. A and B: Graphic correlation of OCR and ∆Ψ values obtained in the absence and presence of 2-DG, respectively. The OCR data were normalized to the respective basal OCR with DMSO (OCRbasal = 1.0). ∆Ψ is expressed as ∆F/F, where F is the fluorescent intensity after the last CCCP-addition (i.e., completely dissipated ∆Ψ) and ∆F is F minus any given fluorescent intensity. C and D: The left ordinate axes represent the effects of DMSO and Oligo on normalized OCRmax (OCRmax/OCRbasal). The right ordinate axes represent ∆Ψ (∆F/F) values when OCRmax was reached in the presence of DMSO or Oligo. Cells were incubated in the absence (A and C) or presence (B and D) of 2-DG. E: Inhibition percentage of OCRmax when ∆Ψ was dissipated (≈0). **P < 0.01, statistically significant difference versus respective DMSO group, ##P < 0.01, statistically significant difference versus respective group without 2-DG; unpaired Student's t-test (C and D) or two-way ANOVA/Bonferroni post-hoc test (E).

References

    1. Ruas J.S., Siqueira-Santos E.S., Amigo I., Rodrigues-Silva E., Kowaltowski A.J., Castilho R.F. Underestimation of the maximal capacity of the mitochondrial electron transport system in oligomycin-treated cells. PLoS ONE. 2016;11 https://10.1371/journal.pone.0150967 - DOI - PMC - PubMed
    1. Ruas J.S., Siqueira-Santos E.S., Rodrigues-Silva E., Castilho R.F. High glycolytic activity of tumor cells leads to underestimation of electron transport system capacity when mitochondrial ATP synthase is inhibited. Sci. Rep. 2018;8:17383. https://10.1038/s41598-018-35679-8 - DOI - PMC - PubMed
    1. Compton S., Kim C., Griner N.B., Potluri P., Scheffler I.E., Sen S., Jerry D.J., Schneider S., Yadava N. Mitochondrial dysfunction impairs tumor suppressor p53 expression/function. J. Biol. Chem. 2011;286:20297–20312. https://10.1074/jbc.M110.163063 - DOI - PMC - PubMed
    1. Rodrigues-Silva E., Siqueira-Santos E.S., Ruas J.S., Ignarro R.S., Figueira T.R., Rogerio F., Castilho R.F. Evaluation of mitochondrial respiratory function in highly glycolytic glioma cells reveals low ADP phosphorylation in relation to oxidative capacity. J. Neurooncol. 2017;133:519–529. https://10.1007/s11060-017-2482-0 - DOI - PubMed
    1. Ruas J. Raw data: A dataset describing glycolytic inhibitors overcoming the underestimation of maximal mitochondrial oxygen consumption rate in oligomycin-treated cells. Mendeley Data. 2021;1 doi: 10.17632/33ybs25n7m.1. - DOI - PMC - PubMed

LinkOut - more resources