

Deep learning improves utility of tau PET in the study of Alzheimer's disease
- PMID: 35005197
- PMCID: PMC8719427
- DOI: 10.1002/dad2.12264
Deep learning improves utility of tau PET in the study of Alzheimer's disease
Abstract
Introduction: Positron emission tomography (PET) imaging targeting neurofibrillary tau tangles is increasingly used in the study of Alzheimer's disease (AD), but its utility may be limited by conventional quantitative or qualitative evaluation techniques in earlier disease states. Convolutional neural networks (CNNs) are effective in learning spatial patterns for image classification.
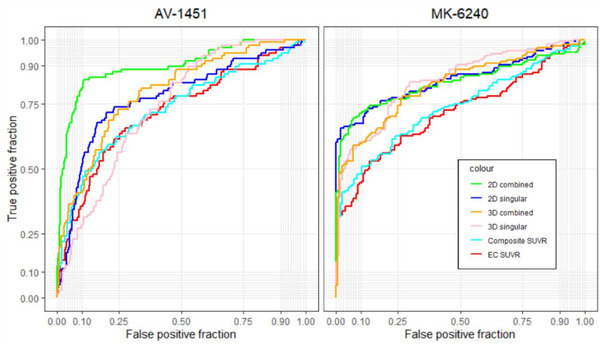
Methods: 18F-MK6240 (n = 320) and AV-1451 (n = 446) PET images were pooled from multiple studies. We performed iterations with differing permutations of radioligands, heuristics, and architectures. Performance was compared to a standard region of interest (ROI)-based approach on prediction of memory impairment. We visualized attention of the network to illustrate decision making.
Results: Overall, models had high accuracy (> 80%) with good average sensitivity and specificity (75% and 82%, respectively), and had comparable or higher accuracy to the ROI standard. Visualizations of model attention highlight known characteristics of tau radioligand binding.
Discussion: CNNs could improve tau PET's role in early disease and extend the utility of tau PET across generations of radioligands.
© 2021 The Authors. Alzheimer's & Dementia: Diagnosis, Assessment & Disease Monitoring published by Wiley Periodicals, LLC on behalf of Alzheimer's Association.
Conflict of interest statement
Dr. Kreisl is a consultant for Cerveau Technologies. However, Cerveau was not involved in the design or execution of this study or in the interpretation of results. Dr. Provenzano is a consultant for and has equity in Imij Technologies, an unrelated company, which was not involved in the design or execution of this study or the interpretation of results. Dr. Provenzano also holds several unrelated neuroimaging MRI patents not pertaining to the current study. Dr. Brickman has provided consultative services to Cognition Therapeutics and Regeneron. Dr. Devanand received research support from the NIA and the Alzheimer's Association. He is a scientific advisor for Acadia, BioExcel, Biogen, Eisai, Genentech, GW Pharmaceuticals, Novo Nordisk. James Zou, David Park, Aubrey Johnson, Xinyang Feng, Michelle Pardo, Jeanelle France, Zeljko Tomljanovica, and Jose A. Luchsinger have no disclosures to report.
Figures


Similar articles
-
Quantitative 18F-AV1451 Brain Tau PET Imaging in Cognitively Normal Older Adults, Mild Cognitive Impairment, and Alzheimer's Disease Patients.Front Neurol. 2019 May 15;10:486. doi: 10.3389/fneur.2019.00486. eCollection 2019. Front Neurol. 2019. PMID: 31156534 Free PMC article.
-
Characterization of MK6240, a tau PET tracer, in autopsy brain tissue from Alzheimer's disease cases.Eur J Nucl Med Mol Imaging. 2021 Apr;48(4):1093-1102. doi: 10.1007/s00259-020-05035-y. Epub 2020 Sep 24. Eur J Nucl Med Mol Imaging. 2021. PMID: 32970217 Free PMC article.
-
Regional profiles of the candidate tau PET ligand 18F-AV-1451 recapitulate key features of Braak histopathological stages.Brain. 2016 May;139(Pt 5):1539-50. doi: 10.1093/brain/aww023. Epub 2016 Mar 2. Brain. 2016. PMID: 26936940
-
The Sensitivity of Tau Tracers for the Discrimination of Alzheimer's Disease Patients and Healthy Controls by PET.Biomolecules. 2023 Feb 3;13(2):290. doi: 10.3390/biom13020290. Biomolecules. 2023. PMID: 36830659 Free PMC article. Review.
-
What's the cut-point?: a systematic investigation of tau PET thresholding methods.Alzheimers Res Ther. 2022 Apr 5;14(1):49. doi: 10.1186/s13195-022-00986-w. Alzheimers Res Ther. 2022. PMID: 35382866 Free PMC article. Review.
Cited by
-
A review of the flortaucipir literature for positron emission tomography imaging of tau neurofibrillary tangles.Brain Commun. 2023 Nov 16;6(1):fcad305. doi: 10.1093/braincomms/fcad305. eCollection 2024. Brain Commun. 2023. PMID: 38187878 Free PMC article. Review.
-
Improved interpretation of 18F-florzolotau PET in progressive supranuclear palsy using a normalization-free deep-learning classifier.iScience. 2023 Jul 20;26(8):107426. doi: 10.1016/j.isci.2023.107426. eCollection 2023 Aug 18. iScience. 2023. PMID: 37564702 Free PMC article.
-
Deep learning application for the classification of Alzheimer's disease using 18F-flortaucipir (AV-1451) tau positron emission tomography.Sci Rep. 2023 May 19;13(1):8096. doi: 10.1038/s41598-023-35389-w. Sci Rep. 2023. PMID: 37208383 Free PMC article.
-
Advancing Tau-PET quantification in Alzheimer's disease with machine learning: introducing THETA, a novel tau summary measure.Res Sq [Preprint]. 2023 Oct 18:rs.3.rs-3290598. doi: 10.21203/rs.3.rs-3290598/v1. Res Sq. 2023. Update in: J Nucl Med. 2024 Sep 3;65(9):1473-1480. doi: 10.2967/jnumed.123.267273. PMID: 37886506 Free PMC article. Updated. Preprint.
-
Classifying mild cognitive impairment from normal cognition: fMRI complexity matches tau PET performance.Alzheimers Dement (Amst). 2025 Aug 12;17(3):e70159. doi: 10.1002/dad2.70159. eCollection 2025 Jul-Sep. Alzheimers Dement (Amst). 2025. PMID: 40799842 Free PMC article.
References
-
- Alzheimer A, Stelzmann R, Schnitzlein H, Murtagh F. An English translation of Alzheimer's 1907 paper,“. Uber Eine Eigenartige Erkankung Der Hirnrinde”. Clin Anat. 1995;8:429‐431. - PubMed
-
- Pascoal TA, Therriault J, Benedet AL, et al. 18F‐MK‐6240 PET for early and late detection of neurofibrillary tangles. Brain. 2020. - PubMed
Grants and funding
LinkOut - more resources
Full Text Sources