

Estimation of dementia prevalence at the local level in the United States
- PMID: 35005210
- PMCID: PMC8719342
- DOI: 10.1002/trc2.12237
Estimation of dementia prevalence at the local level in the United States
Abstract
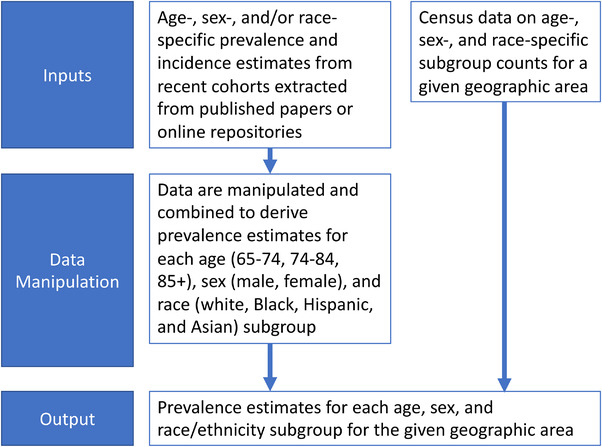
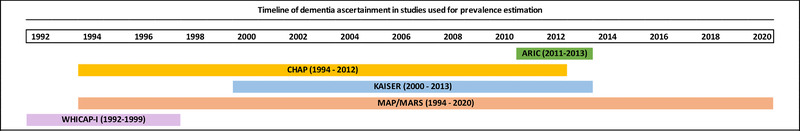
Introduction: Ensuring adequate and equitable distribution of resources to support persons living with dementia relies on understanding the burden and distribution of dementia in a population. Our goal was to develop an approach to estimate dementia prevalence at the local level in the United States using publicly available data.
Methods: Our approach combines publicly available data on dementia prevalence and demographic data from the US Census to estimate dementia prevalence. We illustrate this approach by estimating dementia prevalence in persons aged 65 and older in Philadelphia, PA; Chicago, IL; and Atlanta, GA.
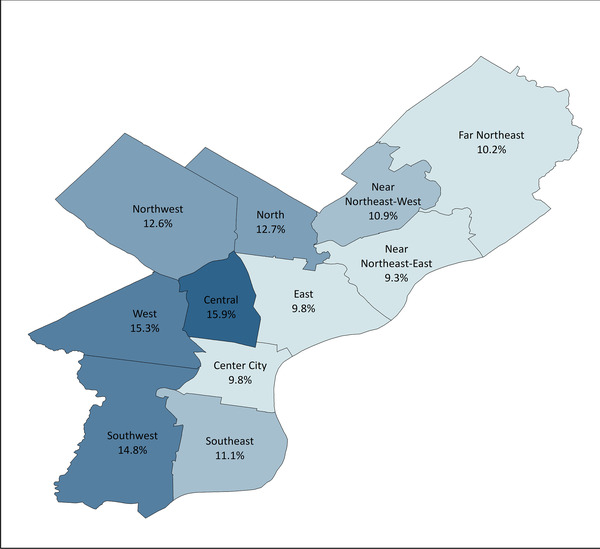
Results: Overall, we estimate the prevalence of dementia among those 65 and older to be 11.9% in Philadelphia, 11.8% Chicago, and 12.3% in Atlanta. Estimates across Philadelphia localities vary from 9.3% to 15.9%.
Discussion: Our approach provides a cost-effective method to generate estimates of dementia prevalence at the local level.
Highlights: Brain health needs assessments require understanding of local dementia prevalence.Our approach can be used to estimate dementia prevalence in individual communities.This information can inform decisions about distribution of resources.
Keywords: Alzheimer's disease; dementia; needs assessment; prevalence; surveillance.
© 2021 The Authors. Alzheimer's & Dementia: Diagnosis, Assessment & Disease Monitoring published by Wiley Periodicals, LLC on behalf of Alzheimer's Association.
Conflict of interest statement
Melinda C. Power reports grants from the United States National Institutes of Health (NIH), Department of Defense (DOD), and DC Health. N Maritza Dowling reports grants from the United States National Institutes of Health (NIH). All authors were supported by a grant from DC Health.
Figures
Similar articles
-
Using Big Data to Estimate Dementia Prevalence in New Zealand: Protocol for an Observational Study.JMIR Res Protoc. 2021 Jan 6;10(1):e20225. doi: 10.2196/20225. JMIR Res Protoc. 2021. PMID: 33404510 Free PMC article.
-
2021 Alzheimer's disease facts and figures.Alzheimers Dement. 2021 Mar;17(3):327-406. doi: 10.1002/alz.12328. Epub 2021 Mar 23. Alzheimers Dement. 2021. PMID: 33756057
-
Caregiver- and patient-directed interventions for dementia: an evidence-based analysis.Ont Health Technol Assess Ser. 2008;8(4):1-98. Epub 2008 Oct 1. Ont Health Technol Assess Ser. 2008. PMID: 23074509 Free PMC article.
-
Systematic review estimating the burden of dementia in the WHO Southeast Asia Region using Bayesian and frequentist approaches.J Glob Health. 2020 Dec;10(2):020701. doi: 10.7189/jogh.10.020701. J Glob Health. 2020. PMID: 33282225 Free PMC article.
-
Considerations for the assessment of suicidal ideation and behavior in older adults with cognitive decline and dementia.Alzheimers Dement (N Y). 2016 Feb 23;2(1):48-59. doi: 10.1016/j.trci.2016.02.001. eCollection 2016 Jan. Alzheimers Dement (N Y). 2016. PMID: 29067293 Free PMC article. Review.
Cited by
-
Unexpected Consequences of Noise-Induced Hearing Loss: Impaired Hippocampal Neurogenesis, Memory, and Stress.Front Integr Neurosci. 2022 May 10;16:871223. doi: 10.3389/fnint.2022.871223. eCollection 2022. Front Integr Neurosci. 2022. PMID: 35619926 Free PMC article. Review.
-
Virginia Memory Project: Using the Healthy Brain Initiative Roadmap to design a statewide dementia registry.Alzheimers Dement. 2025 Feb;21(2):e14478. doi: 10.1002/alz.14478. Epub 2025 Jan 16. Alzheimers Dement. 2025. PMID: 39817562 Free PMC article.
References
LinkOut - more resources
Full Text Sources