. 2021 Dec 8;4(4):e1184.
doi: 10.1002/jsp2.1184. eCollection 2021 Dec.

Single-cell RNA Seq reveals cellular landscape-specific characteristics and potential etiologies for adolescent idiopathic scoliosis

Affiliations

Single-cell RNA Seq reveals cellular landscape-specific characteristics and potential etiologies for adolescent idiopathic scoliosis

Yilin Yang et al. JOR Spine. .

Abstract

Backgrounds: Abnormal vertebral growth and development have been found in adolescent idiopathic scoliosis (AIS) patients, and the proliferation and differentiation of bone development-related cells play important roles in its pathogenesis. However, a comprehensive single-cell-level differentiation roadmap in AIS has not been achieved.

Methods: The present study compared the single-cell level cellular landscapes of spinal cancellous bone tissues between AIS patients and healthy subjects using high throughput single-cell RNA sequencing (scRNA-seq), which covers multiple cellular lineages including osteoblast, chondrocyte, osteoclast and related immunocytes. We constructed the differentiation trajectories of bone development-related cell lineages through pseudotime analysis, and the intercellular-communication networks between bone development-related cells and immunocytes were further developed.

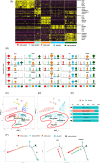
Results: A total of 11 distinct cell clusters were identified according to the genome-wide transcriptome profiles. t-Distributed stochastic neighbor embedding (t-SNE) analysis showed that mesenchymal stem cells (MSC) were classified into three subtypes: MSC-LOXL2, MSC-IGFBP5, and MSC-GJA1. Gene ontology (GO) analysis showed that MSC-GJA1 might possess greater osteoblast differentiation potential than the others. MSC-IGFBP5 was the specific MSC subtype observed only in AIS. There were two distinct gene expression clusters: OB-DPT and OB-OLFML2B, and the counts of osteoblasts derived from AIS was significantly less than that of non-AIS subjects. In AIS patients, MSC-IGFBP5 failed to differentiate into osteoblasts and exhibited negative regulation of cell proliferation and enhanced cell death. CPC-PCNA was found to be the specific chondrocyte progenitor cell (CPC) subtype observed only in AIS patients. The cell counts of OC-BIRC3 in AIS were less than those in controls. Pseudotime analysis suggested two possible distinct osteoclast differentiation patterns in AIS and control subjects. Monocytes in AIS mainly differentiated into OC-CRISP3.

Conclusions: Our single-cell analysis first revealed differences existed in the cellular states between AIS patients and healthy subjects and found the differentiation disruption of specific MSC and CPC clusters in AIS. Cell communication analysis provided the possible pathogenesis of osteoblast and chondrocyte differentiation dysfunction in AIS.

Keywords: adolescent idiopathic scoliosis; differentiation; etiology; single‐cell RNA sequencing.


Figures

FIGURE 1
FIGURE 1
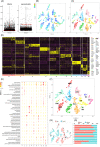
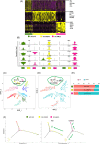
Eleven distinct cell clusters were revealed in control subjects and AIS patients. A, ScRNA‐seq library was normalized according to a minimum library size of 200 genes and a maximum of 20% mitochondrial transcript proportion. B, 8500 genes with high expression variability were identified, which are colored by library size, with darker colors indicating larger libraries. C, t‐Distributed stochastic neighbor embedding (t‐SNE) projection where cells sharing similar transcriptome profiles are clustered by colors representing unsupervised clustering results. D, Heatmap analysis using specific gene expression profiles of known cell types. The identity of each cluster was assigned through matching the expression profile with established cell‐specific marker gene expression for B lymphocyte (BLC), T lymphocyte (TLC), mesenchymal stem cell (MSC), chondrocyte progenitor cell (CPC), neutrophil (NP), osteoblast (OB), monocyte (MC), chondrocyte (CC), dendritic cell (DC), osteoclast (OC) and hematopoietic stem cell (HSC). E, The expected gene ontology (GO) terms were used to verify the identity of each cluster. F, Cluster map suggesting the assigned identity for each cluster. G, Cell counts analysis of identified cell types in control subjects versus AIS patients. H, Cell counts proportions of control subjects versus AIS patients shown as a percentage of total specific cell types. nGene, number of genes; percent.mito, percentage of mitochondrial genes
FIGURE 2
FIGURE 2
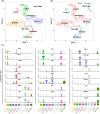
ScRNA‐seq analysis of immune‐related cell group. A, t‐SNE plots of subclusters of immunocytes. We defined two B lymphocyte subclusters (B‐IGHM and B‐JCHAIN), two T lymphocyte subclusters (T‐TRAC and T‐GNLY), two neutrophil subclusters (NP‐MS4A3 and NP‐CA1), one monocyte subcluster (MC‐VSIR), one dentritic cell subcluster (DC‐NR4A3) and one hematopoietic stem cell (HSCTHBD). B, Cell counts analysis of identified immunocyte subtypes in control subjects versus AIS patients, colored by the source donor. C, Violin plots show the expression distributions of specific marker genes across subclusters of immuocytes. Cell types are represented by different colors
FIGURE 3
FIGURE 3
ScRNA‐seq analysis of bone development‐related cell group. A, t‐SNE plots of subclusters of bone development‐related cell group. There are three main subcluster gathering regions, first of which is osteoblast‐derived cell lineage, including three mesenchymal stem cell subclusters and two osteoblast subclusters. The second region consists of chondrocyte‐derived cell lineage, including two chondrocyte progenitor cell subclusters and two chondrocyte subclusters. While the third region consists of osteoclast‐derived cell lineage, which includes one monocyte subcluster and two osteoclast subclusters. B, Cell counts analysis of identified bone development‐related cell subtypes in control subjects versus AIS patients, colored by the source donor
FIGURE 4
FIGURE 4
Subclusters of osteoblast‐derived cell lineage. A, Heatmaps show the differential gene expression pattern of each subcluster from osteoblast‐derived cell lineage. Top 20 differential genes of each subcluster are shown. B, Violin plots show the expression distributions of specific marker genes across MSC and osteoblast subclusters. Cell types are represented by different colors. C, t‐SNE plots of subclusters of osteoblast‐derived cell lineage (within the circled area). We defined three MSC subclusters (MSC‐LOXL2, MSC‐IGFBP5 and MSC‐GJA1) and two osteoblast subclusters (OB‐DPT and OB‐OLFML2B). D, Cell counts analysis of identified MSC and OB subtypes in control subjects versus AIS patients (within the circled area). E, Cell counts proportions of control subjects versus AIS patients shown as a percentage of total specific cell types in MSC and osteoblast subclusters. F, Monocle pseudotime analysis suggests two possible distinct osteoblast differentiation branches, first of which indicates the normal osteoblast differentiation process in control subjects, whereas the second branch indicates the failure of osteoblast differentiation in AIS patients
FIGURE 5
FIGURE 5
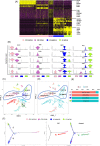
Subclusters of chondrocyte‐derived cell lineage. A, Heatmaps show the differential gene expression pattern of each subcluster from chondrocyte‐derived cell lineage. B, Violin plots show the expression distributions of specific marker genes across CPC and chondrocyte subclusters. Cell types are represented by different colors. C, t‐SNE plots of subclusters of chondrocyte‐derived cell lineage (within the circled area). We defined two CPC subclusters (CPC‐SLC2A1 and CPC‐PCNA) and two chondrocyte subclusters (CC‐MPP13 and CC‐MT1G). D, Cell counts analysis of identified CPC and CC subtypes in control subjects versus AIS patients (within the circled area). E, Cell counts proportions of control subjects versus AIS patients shown as a percentage of total specific cell types in CPC and CC subclusters. F, Monocle pseudotime analysis suggests two trajectories following chondrocyte differentiation, and both CPC‐SLC2A1 and CPC‐PCNA in AIS patients had trouble differentiating into chondrocytes
FIGURE 6
FIGURE 6
Subclusters of osteoclast‐derived cell lineage. A, Heatmaps show the differential gene expression pattern of each subcluster from osteoclast‐derived cell lineage. B, Violin plots show the expression distributions of specific marker genes across MC and osteoclast subclusters. Cell types are represented by different colors. C, t‐SNE plots of subclusters of osteoclast‐derived cell lineage (within the circled area). We defined one monocyte subcluster (MC‐SYK) and two osteoclast subclusters (OC‐CRISP3 and OC‐BIRC3). D, Cell counts analysis of identified MC and OC subtypes in control subjects versus AIS patients (within the circled area). E, Cell counts proportions of control subjects versus AIS patients shown as a percentage of total specific cell types in MC and OC subclusters. F, Monocle pseudotime analysis suggests MC in AIS mainly differentiates into OC‐CRISP3, whereas MC in control subjects could differentiate into two osteoclast clusters including OC‐CRISP3 and OC‐BIRC3
FIGURE 7
FIGURE 7
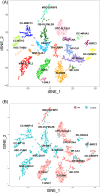
The whole detected cellular landscape in control subjects and AIS patients. A, t‐SNE projection of all cells, colored and labeled by different cell subtypes. B, t‐SNE projection of all cells, colored by the source donor. Most cell‐type associated clusters are both made up of control subjects and AIS patients, in particular, immunocytes in AIS are significantly increased than those in control subjects
FIGURE 8
FIGURE 8
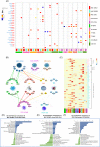
Cell communications between bone development‐related cells and immunocytes. A, The interaction heatmap suggests the ligand‐receptor pairs existed between MSC, CPC subclusters and immunocytes. B, The illustration of ligand‐receptor interactions within MSC and CPC subclusters. C, The ligands and receptors expression heatmap within MSC, CPC and immunocyte subclusters. D‐F, Comparison analysis of hallmark pathway expression between different MSC and CPC subclusters

Similar articles

Cited by

References

    1. Grossman DC, Curry SJ, Owens DK, et al. Screening for adolescent idiopathic scoliosis: US preventive services task force recommendation statement. JAMA. 2018;319(2):165‐172. - PubMed
    1. Li XF, Li H, Liu ZD, Dai LY. Low bone mineral status in adolescent idiopathic scoliosis. Eur Spine J. 2008;17(11):1431‐1440. - PMC - PubMed
    1. Konieczny MR, Senyurt H, Krauspe R. Epidemiology of adolescent idiopathic scoliosis. J Child Orthop. 2013;7(1):3‐9. - PMC - PubMed
    1. Latalski M, Danielewicz‐Bromberek A, Fatyga M, Latalska M, Kröber M, Zwolak P. Current insights into the aetiology of adolescent idiopathic scoliosis. Arch Orthop Trauma Surg. 2017;137(10):1327‐1333. - PMC - PubMed
    1. Kouwenhoven JW, Castelein RM. The pathogenesis of adolescent idiopathic scoliosis: review of the literature. Spine. 2008;33(26):2898‐2908. - PubMed