The Relationship between Tobacco Retailer Density and Neighborhood Demographics in Ohio
- PMID: 35005480
- PMCID: PMC8734554
The Relationship between Tobacco Retailer Density and Neighborhood Demographics in Ohio
Abstract
Introduction: Studies from various parts of the country suggest that tobacco-related health disparities are exacerbated by disparities in the distribution of tobacco retailers (convenience stores, tobacco shops, etc.). The purpose of the present study was to use advanced spatial modeling techniques for count data to estimate current disparities in tobacco retailer density in Ohio.
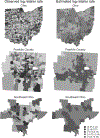
Methods: We identified and geocoded 11,392 tobacco retailers in Ohio. Next, we obtained census tract-level information on race/ethnicity, poverty, and age and obtained county-level information on whether an area was Urban, Suburban, or Rural. Finally, we used negative binomial generalized linear models, adapted for residual spatial dependence, to determine the association between per capita tobacco retailer density and demographic characteristics-summarized by adjusted rate ratios.
Results: There were more (from 1.4-1.9 times as many) retailers per capita in high-poverty, vs. low-poverty tracts. Poverty also interacted with age: the association between high poverty and high retailer density was stronger for tracts with a low youth population. Density was also greater in tracts with a high (vs. low) prevalence of African Americans (1.1 times as many) and Hispanics (1.2 times as many). Finally, density was generally greater in rural (vs. suburban or urban) tracts, although the effect was modified by a three-way interaction: density was particularly high for rural tracts that also had both a high prevalence of poverty and a low youth population.
Discussion: Overall, our findings indicate that Ohio's vulnerable populations are exposed to a greater per capita density of tobacco retailers.
Public health implications: There is a need for state and local-level tobacco control policies that will improve equity and reduce health disparities.
Keywords: Tobacco retailer density; disparities; spatial modeling.
Figures


References
-
- Centers for Disease Control and Prevention Office on Smoking and Health. Smoking and Tobacco Use. 2018. http://www.cdc.gov/tobacco/data_statistics/fact_sheets/fast_facts.
-
- USDHHS. The Health Consequences of Smoking—50 Years of Progress: A Report of the Surgeon General. 2014;Public Health Service, Office of the Surgeon General.
-
- Centers for Disease Control and Prevention, National Center for Chronic Disease Prevention and Health Promotion, Division of Population Health. BRFSS Prevalence & Trends Data. 2015. https://www.cdc.gov/brfss/brfssprevalence/.
-
- Ohio Department of Health. Tobacco-related disparities stat shot. https://www.odh.ohio.gov/-/media/ODH/ASSETS/Files/eh/tobacco/Tobacco-Sta....
Grants and funding
LinkOut - more resources
Full Text Sources
