. 2022 Jan 1;25(1):103722.
doi: 10.1016/j.isci.2021.103722. eCollection 2022 Jan 21.

SARS-CoV-2 infection enhances mitochondrial PTP complex activity to perturb cardiac energetics

Affiliations

SARS-CoV-2 infection enhances mitochondrial PTP complex activity to perturb cardiac energetics

Karthik Ramachandran et al. iScience. .

Abstract

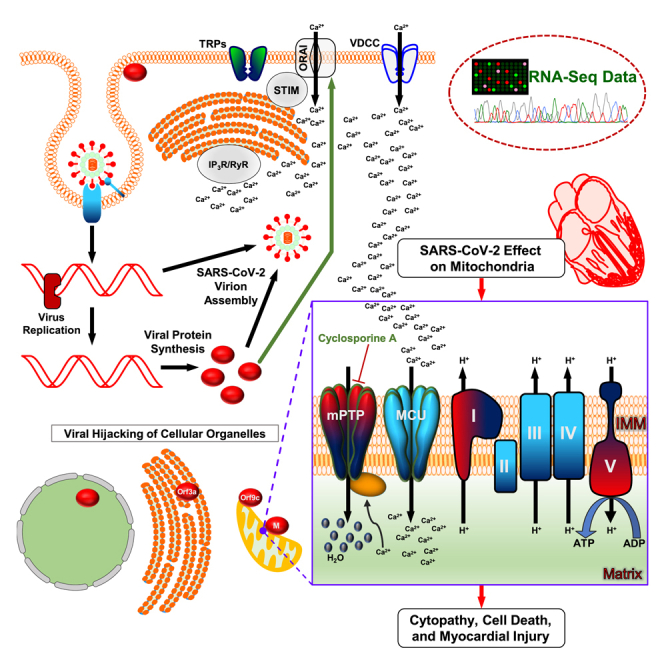
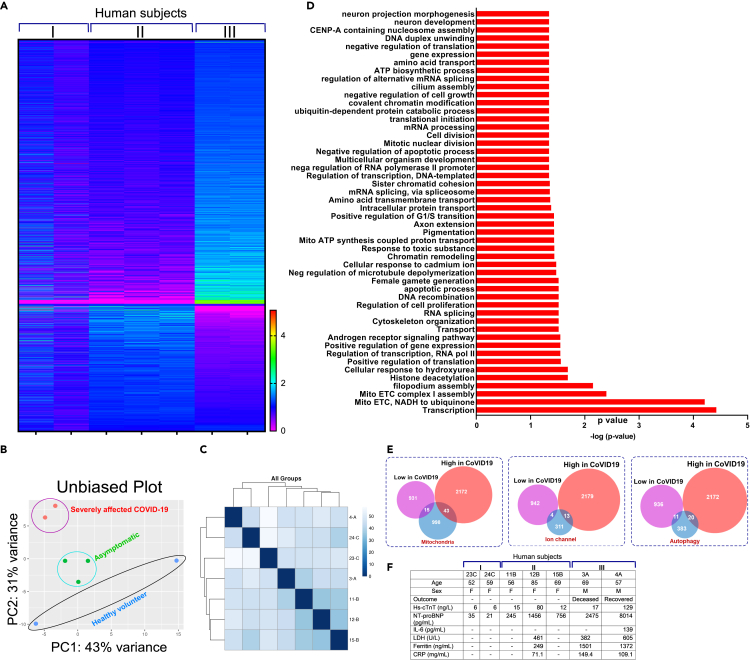
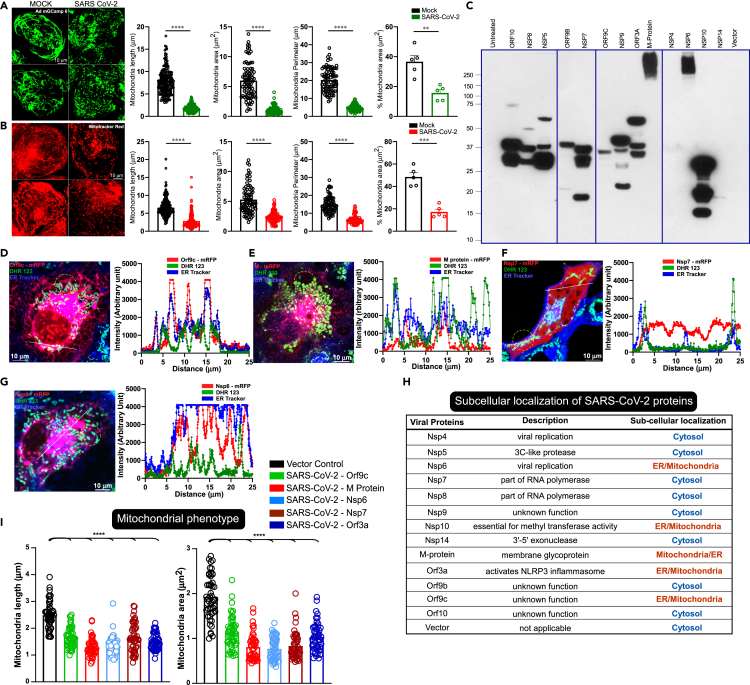
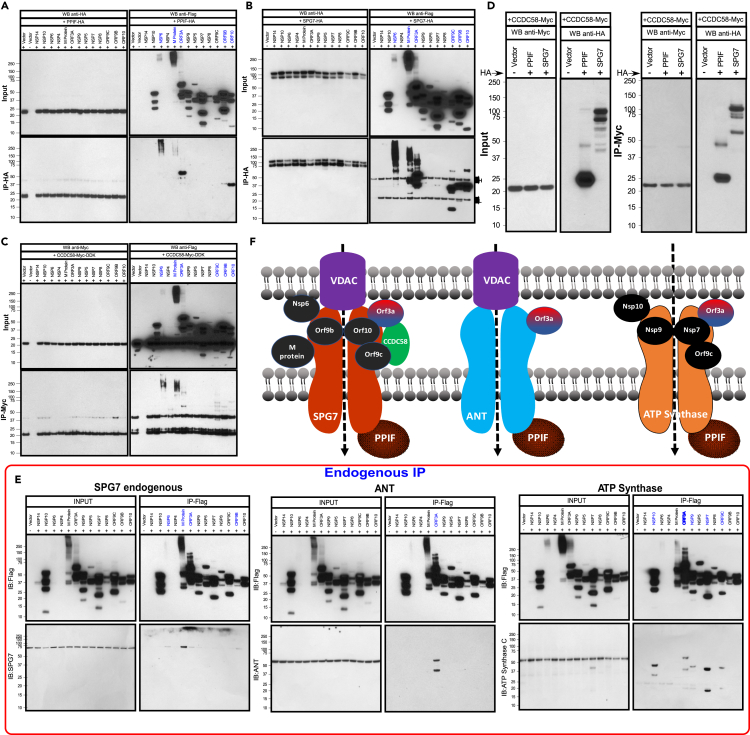
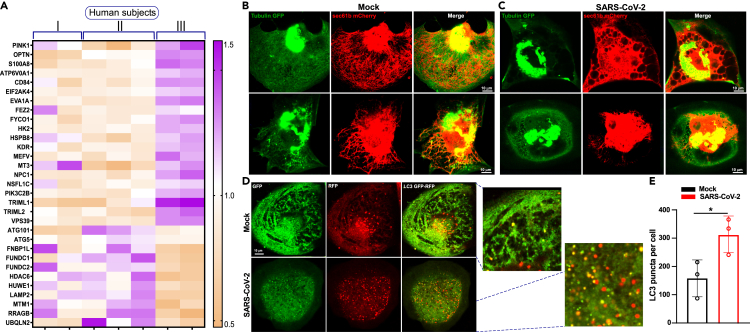
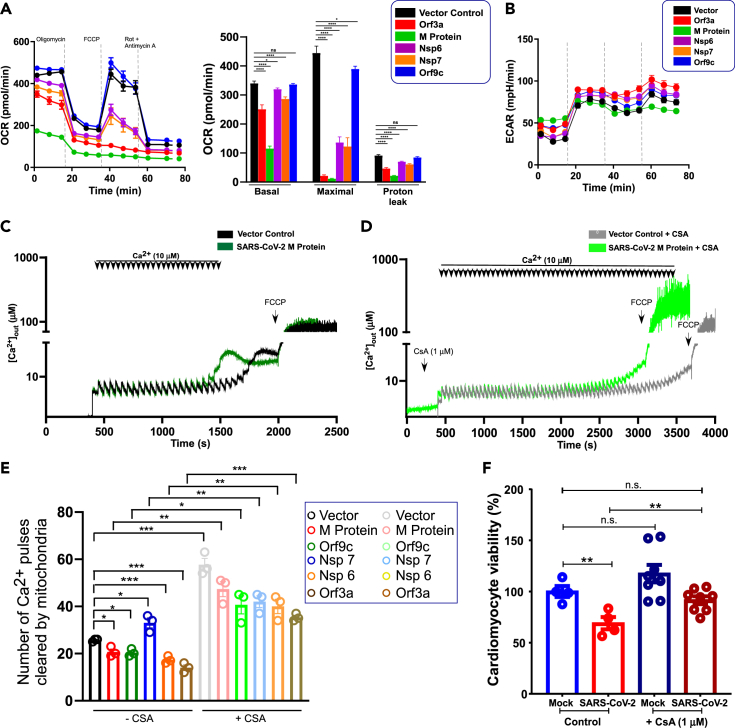
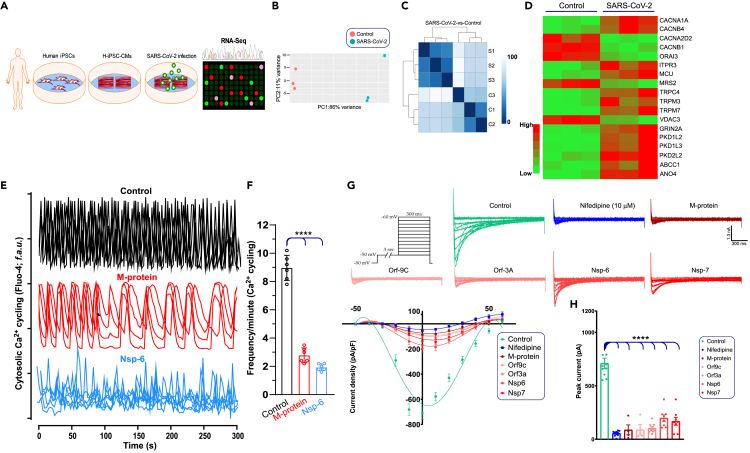
SARS-CoV-2 is a newly identified coronavirus that causes the respiratory disease called coronavirus disease 2019 (COVID-19). With an urgent need for therapeutics, we lack a full understanding of the molecular basis of SARS-CoV-2-induced cellular damage and disease progression. Here, we conducted transcriptomic analysis of human PBMCs, identified significant changes in mitochondrial, ion channel, and protein quality-control gene products. SARS-CoV-2 proteins selectively target cellular organelle compartments, including the endoplasmic reticulum and mitochondria. M-protein, NSP6, ORF3A, ORF9C, and ORF10 bind to mitochondrial PTP complex components cyclophilin D, SPG-7, ANT, ATP synthase, and a previously undescribed CCDC58 (coiled-coil domain containing protein 58). Knockdown of CCDC58 or mPTP blocker cyclosporin A pretreatment enhances mitochondrial Ca2+ retention capacity and bioenergetics. SARS-CoV-2 infection exacerbates cardiomyocyte autophagy and promotes cell death that was suppressed by cyclosporin A treatment. Our findings reveal that SARS-CoV-2 viral proteins suppress cardiomyocyte mitochondrial function that disrupts cardiomyocyte Ca2+ cycling and cell viability.

Keywords: Cardiovascular medicine; Transcriptomics; Virology.


Conflict of interest statement

All authors declare no competing interests.

Figures

None
Graphical abstract
Figure 1
Figure 1
Transcriptome profiling reveals robust perturbation of mitochondrial energetics components during COVID-19 progression (A) Heatmap of all RNA transcripts in PBMCs from healthy SARS-CoV-2-negative volunteers (n = 2), symptomatic (n = 3), and severely affected COVID-19 patients (n = 2). (B) PCA plot of normalized FPKM of RNA-seq from seven samples. (C) Unsupervised hierarchical cluster analysis of COVID-19 patient transcripts. (D) List of enriched transcript categories differentially expressed in COVID-19 patients. (E) Venn diagram represents three major categories of gene ontology. (F) Patient characteristics and blood test results.
Figure 2
Figure 2
SARS-CoV-2 infection and its proteins targeting promote mitochondrial fragmentation in human iPSC-cardiomyocytes (A) Representative confocal images of Ad mitoGCaMP6 as a mitochondrial marker in iPSC-CMs before or after 24 h of SARS-CoV-2 infection. SARS-CoV-2 MOI 1. Bar graphs depict the analysis of mitochondrial shape parameters. (B) Representative confocal images of MitoTracker Red as a mitochondrial marker in iPSC-CMs before or after 24 h of SARS-CoV-2 infection. SARS-CoV-2 MOI 1. Bar graphs depict the analysis of mitochondrial shape parameters. (A and B) Data are presented as the mean ± SEM, n = 5 independent experiments. ∗∗p <0.01, ∗∗∗p <0.01, ∗∗∗∗p <0.0001. (C) Ectopic expression of individual SARS-CoV-2 proteins in COS-7 Cells. (D-H) Individual viral proteins were transiently transfected in COS-7 cells to visualize the intracellular localization of viral proteins tagged with mRFP (red) on a single-cell basis. Representative confocal images of live cells stained with ER (ER Tracker, blue) and mitochondrial markers (DHR123, green). Spatial overlap and intensity profiles demonstrate ER and mitochondrial localization of viral proteins. (H) Table depicts subcellular localization of thirteen SARS-CoV-2 proteins. (I) Analysis of mitochondrial phenotypes (length and area) in cells expressing SARS-CoV-2 proteins. Data are presented as mean ± SEM, n = 3–6 independent experiments. ∗∗∗∗p <0.0001.
Figure 3
Figure 3
Severely affected COVID-19 PBMCs exhibited an elevation of mitochondrial resident CCDC58 candidate (A-B) Heatmap and plot of mitochondrial perturbation subpopulations from groups I, II, and III human subjects. (C) Assessment of CCDC58 cellular localization. HeLa cells were transiently cotransfected with FLAG-tagged CCDC58 and mitochondrial marker Cox-8A-mRFP plasmid constructs. Immunofluorescence analysis of CCDC58 localization shows the mitochondrial localization. (D) Spatial overlap and intensity profiles demonstrate mitochondrial colocalization of CCDC58 and COX8A mitochondrial targeting polypeptide. (E) Representative traces of Ca2+ uptake in NegshRNA or CCDC58 KD HEK293 cells. (F) CCDC58 mRNA expression in NegshRNA or CCDC58 shRNA HEK293 cells. Mean ± SEM. n = 3. (G) Representative traces of Ca2+ uptake in HEK293T cells expressing Neg shRNA, NegshRNA + M-Protein, CCDC58 KD, or CCDC58 KD + M-Protein. (H) Calcium retention capacity in HEK293T cells quantified as the number of Ca2+ (10 μM) pulses taken up. Data presented as mean ± SEM. n = 3. ∗p <0.05 ∗∗∗p <0.001
Figure 4
Figure 4
SARS-CoV-2 proteins interact with mitochondrial PTP complex (A) COS-7 cells were cotransfected with HA-tagged PPIF and FLAG-tagged SARS-CoV-2 protein plasmid constructs. Following immunoprecipitation with HA antibody, total cell lysates and immunoprecipitated materials were subjected to western blot analysis. Cell lysates were probed with anti-FLAG or anti-HA antibodies. Immunoprecipitated samples were probed with anti-FLAG (top right) and anti-HA antibodies (bottom right). n = 3. (B) Western blot analysis of cell lysates (left) or immunoprecipitates (right) from COS-7 cells coexpressing HA-tagged SPG7 and FLAG-tagged SARS-CoV-2 protein plasmid constructs. n = 3. (C) Western blot analysis of cell lysates (left) or immunoprecipitates (right) from COS-7 cells coexpressing Myc-tagged CCDC58 and FLAG-tagged SARS-CoV-2 protein plasmid constructs. n = 3. (D) Western blots of cell lysates or immunoprecipitated material from COS-7 cells transiently coexpressing PPIF, SPG7, or CCDC58 proteins. Cells were lysed, immunoprecipitated with Myc antibody, and immunoblotted for HA. n = 3. (E) SARS-CoV-2 proteins and Mitochondrial PTP Complex binding. COS-7 cells were transfected with FLAG-tagged SARS-CoV-2 protein plasmid constructs. Following immunoprecipitation with FLAG antibody, SPG7, ANT, and ATP synthase interactions were assessed by western blot using specific antibodies. (F) Scheme depicts protein-protein interaction of mitochondrial PTP complex with SARS-CoV-2 proteins.
Figure 5
Figure 5
SARS-CoV-2 infection exacerbates autophagy in human iPSC-cardiomyocytes (A) Heatmap depicts the enrichment of cellular and mitochondrial quality control transcripts in severely affected COVID-19 patients. (B and C) Effect of SARS-CoV-2 on cardiomyocytes cyto-skeletal and ER architecture. Representative confocal images of Tubulin-GFP and ER marker (Sec61b-mCherry) expressing iPSC-CMs before or after 24 h of SARS-CoV-2 infection. A multiplicity of infection (MOI) of 1 was used for SARS-CoV-2 in Ad5-tfLC3 (mRFP-GFP tandem fluorescent-tagged LC3, tfLC2, adenovirus)-infected iPSC-CMs. (D) Representative confocal images of mRFP-GFP tfLC3 in iPSC-CMs before or after 24 h of SARS-CoV-2 infection. SARS-CoV-2 MOI 1. (E) Quantification of autophagy was performed as normalized LC3 puncta. Data are presented as the mean ± SEM, n = 3–4 independent experiments. ∗p <0.05.
Figure 6
Figure 6
mPTP complex blocker cyclosporin A restores mitochondrial bioenergetics cardiomyocyte viability from SARS-CoV-2-induced damage (A) Mitochondrial oxygen consumption rate (OCR) of vector or SARS-CoV-2 stably expressing COS-7 cells. Bar graph depicts basal, maximal, and proton leak. Mean ± SEM. n = 3–4. The p values were determined by one-way ANOVA with Tukey's test. Data are presented as the mean ± SEM, n = 3–4 independent experiments. ∗p <0.05, ∗∗∗∗p <0001. n.s., not significant. (B) The traces represent extracellular acidification rate and these data are derived from (A) (C-D) Representative traces of number of Ca2+ pulses cleared by mitochondria (CRC). Vector or SARS-CoV-2 M-protein stably expressing HEK293 cells were permeabilized and exposed to boluses of 10 μM Ca2+ pulses with (C) or without (D) cyclosporin A (1 μM) at the indicated time point. (E) Quantification of mitochondrial CRC in both control and viral protein expressing conditions. Data are presented as the mean ± SEM, n = 3–6 independent experiments. ∗p <0.05, ∗∗p <0.01, ∗∗∗p <001. n.s., not significant. (F) Assessment of cardiomyocyte viability following SARS-CoV-2 infection. hiPSC-cardiomyocytes were challenged with virus at an MOI of 1 for 24 h. After viral infections, cells were subjected to MTT assay to determine the viability. Data are presented as the mean ± SEM, n = 4–8 independent experiments. ∗∗p <0.01, n.s., not significant.
Figure 7
Figure 7
SARS-CoV-2 proteins suppress LTCC channel activity in cardiomyocytes (A) Schematic overview of the study. Twenty days after the start of differentiation, hiPSC-CMs were exposed to SARS-CoV-2 virus (1 MOI) for 24 h before RNA isolation to perform RNA-seq analysis. (B) PCA plot of normalized FPKM of RNA-seq from control (n = 3) and SARS-CoV-2-infected hiPSC-CMs (n = 3). (C) Cluster analysis of control and SARS-CoV-2 infected hiPSC-CMs. (D) Targeted ion channel transcripts differentially modulated in hiPSC-CMs upon SARS-CoV-2 infection (n = 3). (E) Representative optical recordings show Fluo-4 Ca2+ cycling traces in both control (RFP-tagged plasmid) and RFP-tagged SARS-CoV-2 M-protein or NSP-6 overexpressing hiPSC-CMs. (F) Quantification of Ca2+ oscillations frequency in cardiomyocytes. These data are derived from traces in A. Data are presented as the mean + SEM, n = 3–4 independent experiments. (G) Current-voltage relationship of CaV1.2 channels in control and viral protein-overexpressing hiPSC-CMs. (H) Peak current densities (pA) for control or SARS-CoV-2 expressing hiPSC-CMs. n = 6–12. Data are presented as the mean ± SEM, n = 4–10 independent experiments. ∗∗∗∗p <0.0001.

References

    1. Alavian K.N., Beutner G., Lazrove E., Sacchetti S., Park H.A., Licznerski P., Li H., Nabili P., Hockensmith K., Graham M., et al. An uncoupling channel within the c-subunit ring of the F1FO ATP synthase is the mitochondrial permeability transition pore. Proc. Natl. Acad. Sci. U S A. 2014;111:10580–10585. - PMC - PubMed
    1. Baughman J.M., Perocchi F., Girgis H.S., Plovanich M., Belcher-Timme C.A., Sancak Y., Bao X.R., Strittmatter L., Goldberger O., Bogorad R.L., et al. Integrative genomics identifies MCU as an essential component of the mitochondrial calcium uniporter. Nature. 2011;476:341–345. - PMC - PubMed
    1. Bers D.M. Calcium and cardiac rhythms: physiological and pathophysiological. Circ. Res. 2002;90:14–17. - PubMed
    1. Bers D.M. Calcium cycling and signaling in cardiac myocytes. Annu. Rev. Physiol. 2008;70:23–49. - PubMed
    1. Bers D.M. Cardiac sarcoplasmic reticulum calcium leak: basis and roles in cardiac dysfunction. Annu. Rev. Physiol. 2014;76:107–127. - PubMed