. 2021 Dec 9;25(1):103600.
doi: 10.1016/j.isci.2021.103600. eCollection 2022 Jan 21.

Elucidating complex triplet-state dynamics in the model system isopropylthioxanthone

Affiliations

Elucidating complex triplet-state dynamics in the model system isopropylthioxanthone

Nikolaos Liaros et al. iScience. .

Abstract

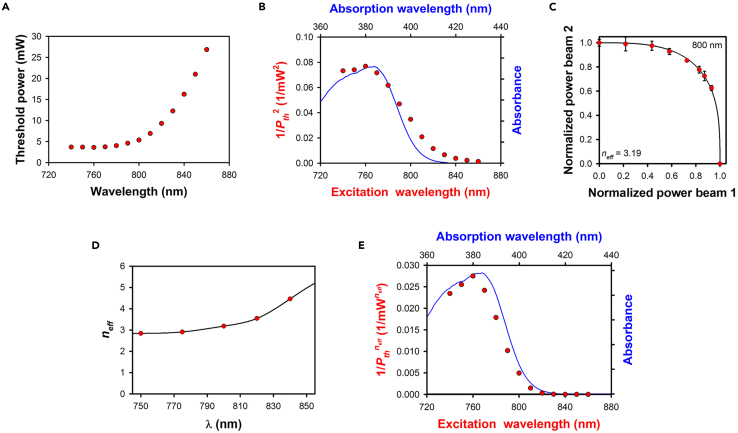
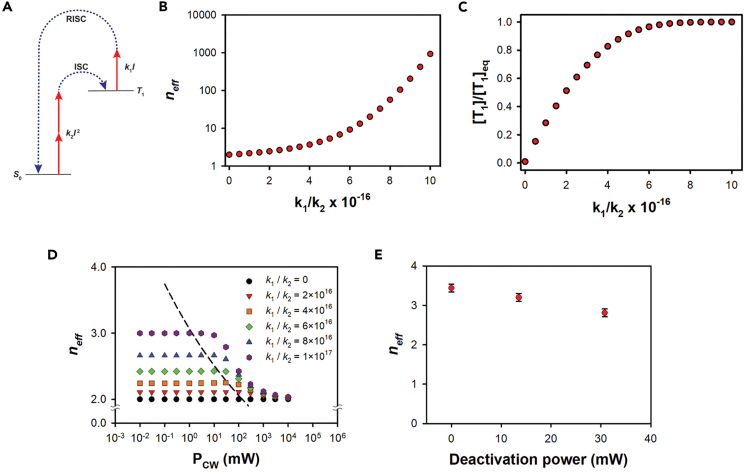
We introduce techniques for probing the dynamics of triplet states. We employ these tools, along with conventional techniques, to develop a detailed understanding of a complex chemical system: a negative-tone, radical photoresist for multiphoton absorption polymerization in which isopropylthioxanthone (ITX) is the photoinitiator. This work reveals that the same color of light used for the 2-photon excitation of ITX, leading to population of the triplet manifold through intersystem crossing, also depletes this triplet population via linear absorption followed by reverse intersystem crossing (RISC). Using spectroscopic tools and kinetic modeling, we identify the reactive triplet state and a non-reactive reservoir triplet state. We present compelling evidence that the deactivation channel involves RISC from an excited triplet state to a highly vibrationally excited level of the electronic ground state. The work described here offers the enticing possibility of understanding, and ultimately controlling, the photochemistry and photophysics of a broad range of triplet processes.

Keywords: Chemistry; Nonlinear optics; Theoretical photophysics.


Conflict of interest statement

The authors declare no competing interests.

Figures

None
Graphical abstract
Figure 1
Figure 1
Multiphoton exposure of an ITX/PETA photoresist (A) Threshold average power for initiation of multiphoton absorption polymerization measured at wavelengths from 750 nm to 850 nm. (B) Polymerization action spectrum of the photoresist (symbols) and absorption spectrum of ITX in methanol (solid line). (C) Representative 2-BIT data obtained at 800 nm (symbols) with the best-fit exponent (solid line). The error bars represent ±1 standard deviation, as determined by making multiple measurements. (D) Dependence of neff (symbols) on the excitation wavelength, with a cubic-spline fit (solid line). (E) Linearized polymerization action spectrum taking into account neff for each wavelength (symbols) and absorption spectrum of ITX in methanol (solid line).
Figure 2
Figure 2
Deactivation and self-deactivation of ITX (A) Transient-absorption spectra of ITX in ethylene glycol with 355 nm, 7 ns excitation pulses. The ΔOD scale is correct for the spectrum with a 10 μs delay. Each subsequent spectrum, moving from longer delays to shorter delays, has been offset by 0.1 units vertically from the previous one for clarity. The vertical dashed lines indicate spectral features that are discussed in the text. (B) AFM images of lines written in an ITX/PETA photoresist with 800 nm, 150 fs laser pulses at a stage velocity of 20 μm/s. A chopped, spatially overlapped, 800 nm, CW beam was used to inhibit polymerization. The average excitation power was 5 mW and the deactivation power was 30 mW. The scale bar represents 4 μm. (C) Deactivation action spectrum of the photoresist following excitation with 800 nm, 150 fs laser pulses at an average excitation power of 8.2 mW. The blue square is for deactivation with a 635 nm diode laser, and the red circles are for deactivation with a Ti:sapphire oscillator in CW mode. (D) Ultrafast pump/probe spectrum of ITX in glyme. Excitation was performed at 400 nm, and white-light continuum was used as the probe. See text for an explanation of the labels (A–C). (E) Representative Jablonski diagram for ITX in a polar solvent. (F) Delay-time dependence of the threshold pulse energy for deactivation at 630 nm of the ITX/PETA photoresist following excitation with 315 nm pulses. Both beams had a pulse duration of 7 ns and a repetition rate of 10 Hz. The error bars represent the estimated uncertainty in determining the deactivation threshold. (G) 2-BIT data and the corresponding neff values for photoresists based on PETA (circles, 1.5 wt% ITX, and down triangles, 0.5 wt% ITX), TMPTA (up triangles, 1.5 wt% ITX), PETA and ethyl lactate (squares, 1.5 wt% ITX), and PETA and triethylamine (diamonds, 1.5 wt% ITX). The error bars in (F) and (G) represent ±1 standard deviation, as determined by making multiple measurements.
Figure 3
Figure 3
Luminescence studies of ITX in PEG-400 (A) Luminescence as a function of CW deactivation power. Excitation was performed using 800 nm, 150 fs pulses, and deactivation was performed at 740 (triangles), 800 nm (squares), and 840 nm (diamonds). (B) Inhibition of luminescence by 800 nm light with detection in different spectral windows: unfiltered (circles), with a 445 nm bandpass filter to capture predominantly fluorescence (triangles), and with a 550 nm longpass filter to capture only phosphorescence (squares). (C) Inhibition of luminescence by 635 nm light using a longpass filter with a 645 nm cutoff. Phosphorescence deactivation is extremely efficient at this wavelength. (D) 2-BCEIn data for fluorescence (circles) and phosphorescence (triangles) with ultrafast, 800 nm excitation. The difference in neff between the two datasets indicates that self-deactivation plays a role in the phosphorescence data. The error bars in all panels represent ±1 standard deviation, as determined by making multiple measurements.
Figure 4
Figure 4
Kinetic model for self-deactivation (A) Schematic of a kinetic model that incorporates 2-photon excitation with rate constant k2I2 and linear deactivation with rate constant k1I, where I is the irradiance. (B) Dependence of neff on k1/k2 (in units of kg/s3) for parameters given in the text. (C) Ratio of the triplet population to the equilibrium triplet population as a function of k1/k2 for the same parameters as in (B). (D) Dependence of neff on the power of a CW deactivation beam for different values of k1/k2 for the same parameters as in (B). The dashed line indicates the positions of the maxima in the curves. (E) Value of neff as a function of deactivation power in 2-BITD experiments on the ITX/PETA photoresist. The error bars represent ±1 standard deviation, as determined by making multiple measurements.
Figure 5
Figure 5
Relationship between feature size and neff in an ITX/PETA photoresist (A) Spatial dependence of the fractional triplet population in the kinetic model for different values of neff at the peak intensity. The spatial intensity distribution was assumed to be Gaussian, and k2 was fixed at 2.21 × 10−26 s5/kg2. (B) Minimum experimental linewidth as a function of excitation wavelength for the ITX/PETA photoresist (red, right axis) and a control photoresist with Lucirin TPO-L as the photoinitiator (blue, left axis). These data demonstrate that a higher neff in the ITX photoresist correlates with a broader linewidth. The error bars represent ±1 standard deviation, as determined by making multiple measurements.
Figure 6
Figure 6
Schematic representation of the most important photophysical processes that take place in the ITX photoresist, with the relevant states (S0, S1, T1, T2, and Tn) that are involved Green arrows indicate absorption of a photon, pink arrows indicate non-radiative relaxation, and blue arrows indicate radiative relaxation. Solid horizontal lines indicate vibrationless electronic states and dashed horizontal lines indicate vibrationally excited electronic states. The energy levels are not to scale. For each process, the final state is marked in red.

Similar articles

Cited by

References

    1. Abdullah K.A., Kemp T.J. Solvatochromic effects in the fluorescence and triplet—triplet absorption spectra of xanthone, thioxanthone and N-methylacridone. J. Photochem. 1986;32:49–57. doi: 10.1016/0047-2670(86)85006-7. - DOI
    1. Allonas X., Ley C., Bibaut C., Jacques P., Fouassier J.P. Investigation of the triplet quantum yield of thioxanthone by time-resolved thermal lens spectroscopy: solvent and population lens effects. Chem. Phys. Lett. 2000;322:483–490. doi: 10.1016/s0009-2614(00)00462-0. - DOI
    1. Amirzadeh G., Schnabel W. On the photoinitiation of free radical polymerization-laser flash photolysis investigations on thioxanthone derivatives. Macromol.Chem. Phys. 1981;182:2821–2835. doi: 10.1002/macp.1981.021821027. - DOI
    1. Andrzejewska E., Zych-Tomkowiak D., Andrzejewski M., Hug G.L., Marciniak B. Heteroaromatic thiols as co-initiators for type II photoinitiating systems based on camphorquinone and isopropylthioxanthone. Macromolecules. 2006;39:3777–3785. doi: 10.1021/ma060240k. - DOI
    1. Angulo G., Grilj J., Vauthey E., Serrano-Andres L., Rubio-Pons O., Jacques P. Ultrafast decay of the excited singlet states of thioxanthone by internal conversion and intersystem crossing. ChemPhysChem. 2010;11:480–488. doi: 10.1002/cphc.200900654. - DOI - PubMed

LinkOut - more resources