. 2021 Dec 13;25(1):103605.
doi: 10.1016/j.isci.2021.103605. eCollection 2022 Jan 21.

Intracellular IL-32 regulates mitochondrial metabolism, proliferation, and differentiation of malignant plasma cells

Affiliations

Intracellular IL-32 regulates mitochondrial metabolism, proliferation, and differentiation of malignant plasma cells

Kristin Roseth Aass et al. iScience. .

Abstract

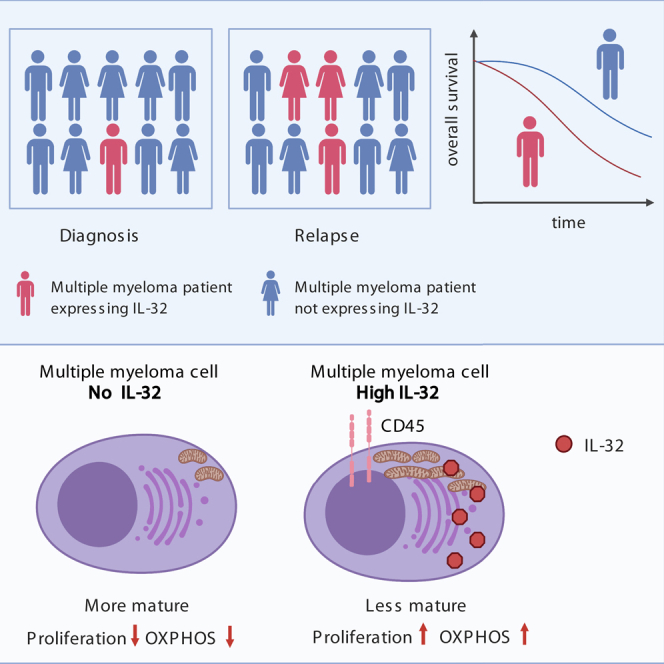
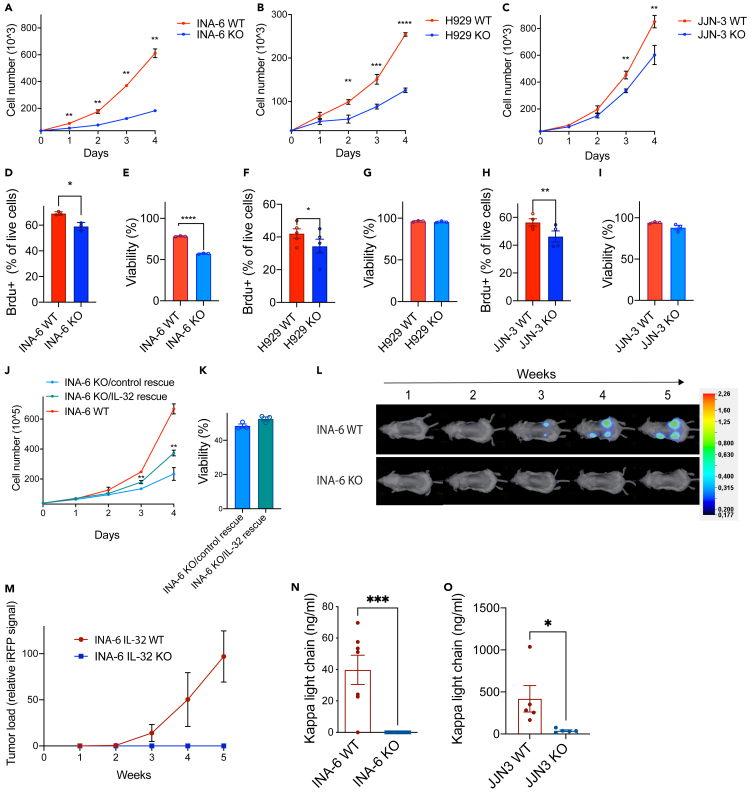
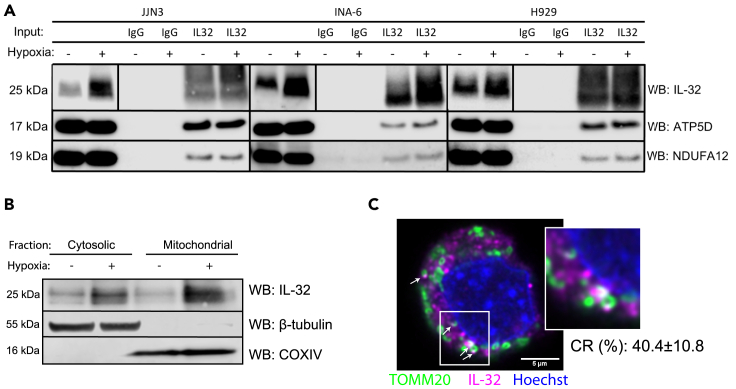
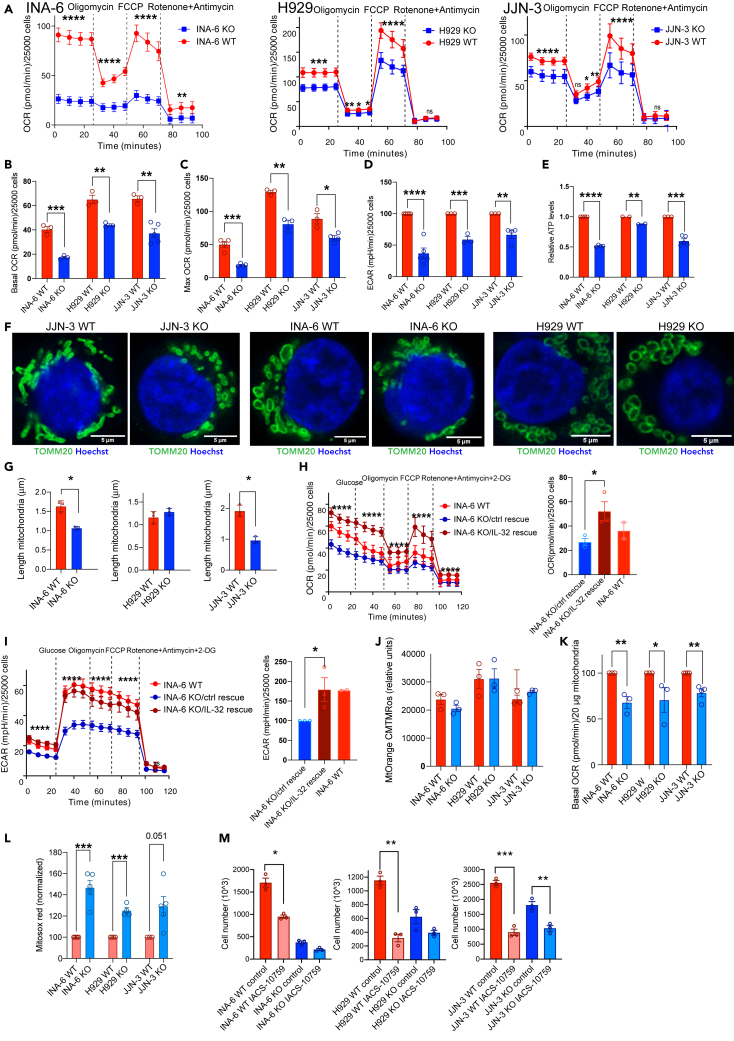
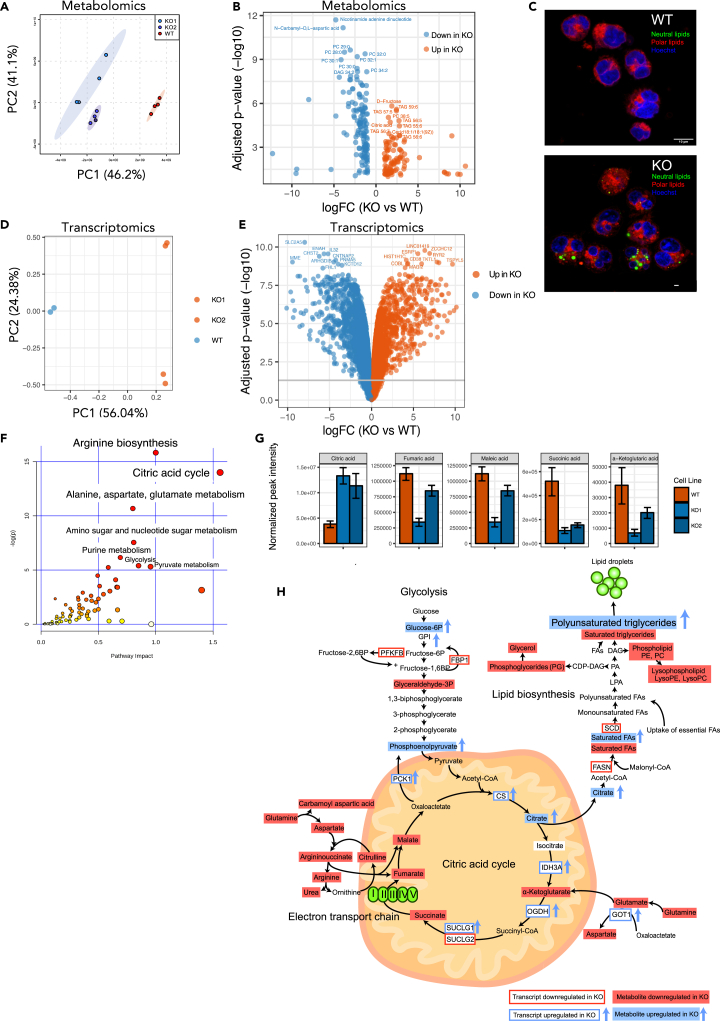
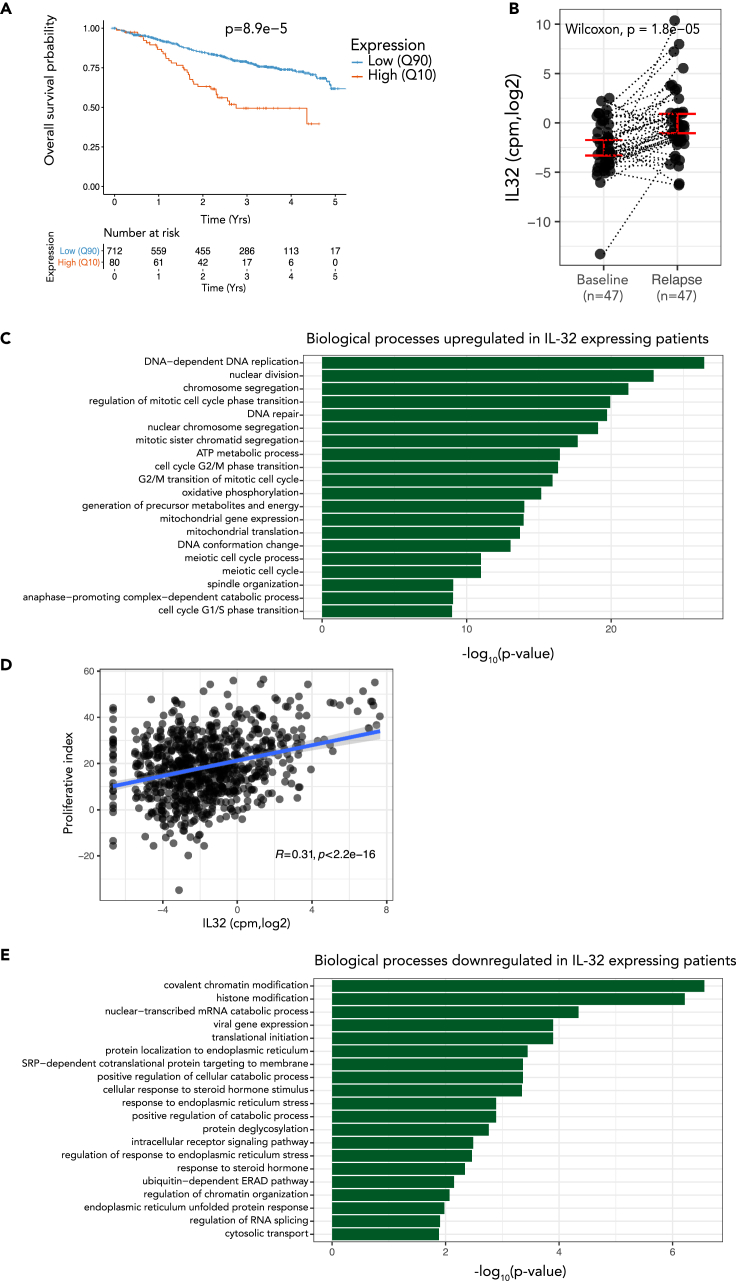
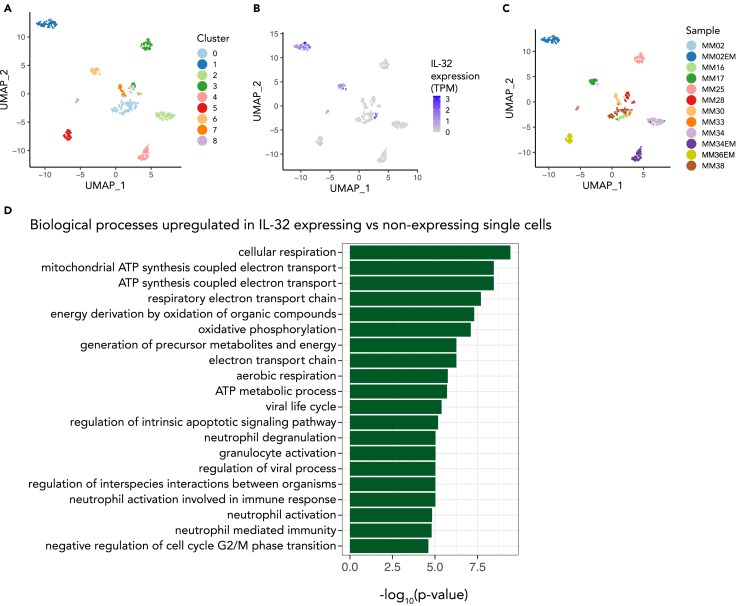
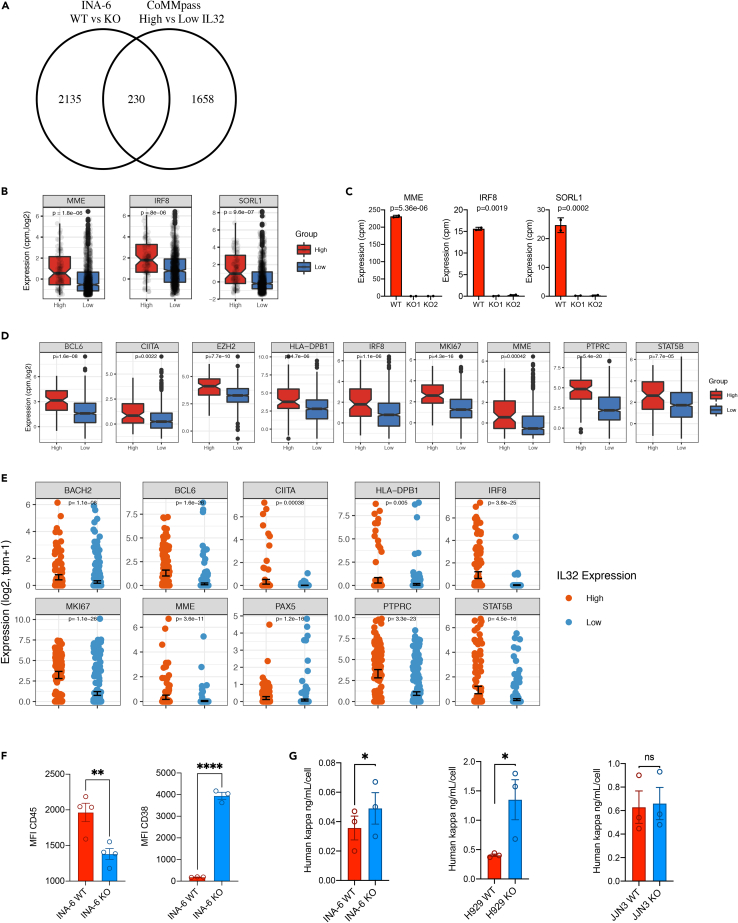
Interleukin-32 (IL-32) is a nonclassical cytokine expressed in cancers, inflammatory diseases, and infections. Its expression is regulated by two different oxygen sensing systems; HIF1α and cysteamine dioxygenase (ADO), indicating that IL-32 may be involved in the response to hypoxia. We here demonstrate that endogenously expressed, intracellular IL-32 interacts with components of the mitochondrial respiratory chain and promotes oxidative phosphorylation. Knocking out IL-32 in three myeloma cell lines reduced cell survival and proliferation in vitro and in vivo. High-throughput transcriptomic and MS-metabolomic profiling of IL-32 KO cells revealed that cells depleted of IL-32 had perturbations in metabolic pathways, with accumulation of lipids, pyruvate precursors, and citrate. IL-32 was expressed in a subgroup of myeloma patients with inferior survival, and primary myeloma cells expressing IL-32 had a gene signature associated with immaturity, proliferation, and oxidative phosphorylation. In conclusion, we demonstrate a previously unrecognized role of IL-32 in the regulation of plasma cell metabolism.

Keywords: Cancer; Cell biology; Immunology.


Conflict of interest statement

There are no conflicts of interests.

Figures

None
Graphical abstract
Figure 1
Figure 1
IL-32 is important for myeloma cell proliferation in vitro and tumor engraftment in vivo (A–C) INA-6, H929, and JJN-3 IL-32 KO cells were generated by CRISPR/Cas9. Proliferation of IL-32 KO and WT mock cells was assessed by automated cell counting every day for 4 days. Mean ± SD of 3 technical replicates of one representative experiment of ≥3 independent experiments are shown. Significance was evaluated by calculating mean for each day and performing multiple t tests. (D) % 5-bromo-2′-deoxyuridine(brdu)-positive live INA-6 KO and WT mock cells after 4 h. Data shown are mean ± SEM ≥3 independent experiments. Statistical significance was determined by paired Student's t test. (E) Viability of INA-6 IL-32 KO and WT mock cells was evaluated by flow cytometry using annexin/PI staining. Data shown are mean ± SEM ≥3 independent experiments. Statistical significance was determined by paired Student's t test. (F) % 5-bromo-2′-deoxyuridine(brdu)-positive live H929 KO and WT mock cells after 4 h. Data shown are mean ± SEM ≥3 independent experiments. Statistical significance was determined by paired Student's t test. (G) Viability of H929 IL-32 KO and WT mock cells was evaluated by flow cytometry using annexin/PI staining. Data shown are mean ± SEM ≥3 independent experiments. Statistical significance was determined by paired Student's t test. (H) % 5-bromo-2′-deoxyuridine(brdu)-positive live JJN-3 KO and WT mock cells after 4 h. Data shown are mean ± SEM ≥3 independent experiments. Statistical significance was determined by paired Student's t test. (I) Viability of JJN-3 IL-32 KO and WT mock cells was evaluated by flow cytometry using annexin/PI staining. Data shown are mean ± SEM ≥3 independent experiments. Statistical significance was determined by paired Student's t test. (J) IL-32 was reintroduced into INA-6 KO cells by transduction with an IL-32 lentiviral vector and proliferation of INA-6 KO/IL-32 rescue cells, and INA-6 KO/control rescue cells was assessed by cell counting. Mean ± SD of 3 technical replicates of one representative experiment of ≥3 independent experiments are shown. Significance was evaluated by calculating mean for each day and performing multiple t tests. (K) Viability of INA-6 KO/IL-32 rescue cells and INA-6 KO/control rescue was evaluated by flow cytometry using annexin/PI staining. Data shown are mean ± SEM ≥3 independent experiments. Statistical significance was determined by paired Student's t test. (L) 1 × 106 iRFP labelled INA-6 IL-32 KO and WT mock cells were implanted on humanized bone scaffolds on the flanks of RAG −/− y c−/− BALB/c mice, and tumor burden was assessed every week. The figure shows representative images of tumor burden mice injected with WT mock and KO cells. WT: N = 9, KO: N = 10. The scale bar shows the intensity of fluorescence in the 700 white channel. (M) Tumor development quantified by the pooled iRFP signal of all scaffolds. Figure shows mean ± SEM of WT: 27 scaffolds, KO: 30 scaffolds. (N) Blood was collected at the end of the experiment described in (G), and serum human kappa light chain was quantified. (O) 1 × 105 JJN-3 WT (N = 5) or KO (N = 5) cells were injected into the tibia of male RAG2−/−GC−/− mice. After 20 days blood was collected, and serum human kappa light chain was quantified. ∗p ≤0.05, ∗∗p ≤0.01, ∗∗∗p ≤0.001, ∗∗∗∗p ≤0.0001.
Figure 2
Figure 2
IL-32 is localized to the mitochondria and interacts with components of the mitochondrial respiratory chain (A) CO-IP was performed by pull-down of endogenous IL-32 in INA-6, JJN-3, and H929 cells. Representative immunoblots of ATP5D, NDUFA12, and IL-32 are shown. The vertical lines in the IL-32 lanes are to indicate that to improve visualization contrast/brightness were adjusted differently for the total cell lysate (2 lanes to the left) and for the IP samples (4 lanes to the right). (B) Representative immunoblot of IL-32 in the mitochondrial and cytosolic fraction of JJN-3 cells cultured in normoxia (20% oxygen) and hypoxia (2% oxygen). (C) Representative confocal image of hypoxic JJN-3 cells stained for IL-32 (magenta, Alexa 647), mitochondria (TOMM20, green, Alexa 488), and nucleus (blue, Hoechst). Imaging was performed with a Leica SP9, using a 63 × 1.4 (oil) objective and LAS X software and deconvoluted using Huygens. Scale bar: 5μM. Arrows indicate areas of colocalization of TOMM20 and IL-32. Correlation rate (CR, in %) is the mean ± SD calculated from N = 4 images analyzed in Leica Application Suite X.
Figure 3
Figure 3
IL-32 enhances mitochondrial respiration (A) Representative Seahorse Mito Stress Test assay measuring OCR in INA-6, H929, and JJN-3 KO and WT mock. Four first measurements show basal OXPHOS, after injection of oligomycin: non-ATP oxygen consumption (proton leak), after FCCP injection: maximal OCR, after injection of rotenone and antimycin: nonmitochondrial respiration. Data show mean ± SD of 20 technical replicates. The differences between KO and WT mock cells were significant using two-way ANOVA and Sidàk's multiple comparison test (p ≤0.0001). (B) Mean basal respiration (basal OCR) in INA-6, H929, and JJN-3 KO and WT mock cell lines. Data shown are mean ± SEM of 3 independent experiments. (C) Mean maximal respiration (max OCR) in INA-6, H929, and JJN-3 KO and WT mock cell lines. Data shown are mean ± SEM of 3 independent experiments. (D) Mean basal glycolysis (±SEM) in IL-32 KO and WT cell lines analyzed by Seahorse Glycolysis Stress Test measuring ECAR. Data shown are mean ± SEM of 3 independent experiments. (E) Relative ATP levels in INA-6, H929, and JJN-3 KO and WT mock cells quantified by CTG-assay. Data shown are mean ± SEM of 3 independent experiments. (F) Representative confocal images of mitochondria of IL-32 JJN-3 KO and WT mock cells stained for TOMM20 (green, Alexa 488) and nuclei (Hoechst, blue). Imaging was performed with a Leica SP9, using a 63 × 1.4 (oil) objective and LAS X software and deconvoluted using Huygens. Scale bar: 5μM. Arrows indicate areas of colocalization of TOMM20 and IL-32. (G) Length of mitochondria in INA-6, H929, and JJN-3 IL-32 KO and WT mock cells analyzed in Fiji Software. Data are presented as mean length (u m) ±SEM of mitochondria imaged with the same staining as in (F) in 3 independent experiments (see STAR Methods for details). (H) Representative graph showing OXPHOS in INA-6 KO/IL-32 rescue cells and IL-6 KO/rescue control (mean ± SD of more than 20 technical replicates). The difference between INA-6 control rescue and INA-6 IL-32 rescue was significant using two-way ANOVA (P ≤0.0001). Bar plot shows mean basal OCR (±SEM) of 3 independent experiment. INA-6 WT mock cells were included for comparison. (I) Representative graph showing glycolysis in INA-6 KO/IL-32 rescue cells and INA-6 KO/control rescue cells (mean ± SD) of more than 20 technical replicates. The difference between INA-6 KO/control rescue cells and INA-6 KO/IL-32 rescue cells was significant using two-way ANOVA and Sidàk's multiple comparison test (P ≤0.0001). The bar plot shows mean basal glycolysis (ECAR) (±SEM) of 3 independent experiment. INA-6 WT mock cells were included for comparison. (J) Membrane potential in isolated mitochondria from IL-32 KO and WT mock cells quantified by Mitotracker Orange CMTMRos fluorescence. The bar plots show mean ± SEM of 3 independent experiments. (K) Mean basal respiration (basal OCR) in isolated mitochondria from INA-6, H929, and JJN-3 KO and WT mock cell lines. Data are shown as mean ± SEM of 3 independent experiments. (L) Mitochondrial ROS in INA-6, H929, and JJN-3 KO and WT mock cell lines quantified by Mitosox Red staining. Figure shows Mitosox fluorescence of KO and WT cells normalized to WT for each independent experiment (N >3). Data are shown as mean ± SEM. (M) INA-6, H929, and JJN-3 IL-32 KO and WT mock cells were grown in medium supplemented with IACS-10759 (10 nM), and number of cells was determined by automated counting after 4 days of culture. Data shown are mean total number of cells ±SEM of 3 independent experiments. Difference in proliferation between untreated control and inhibitor-treated samples was assessed for KO and WT mock cells by RM one-way ANOVA followed by Sidak's multiple comparison test. ns, not significant; ∗p ≤0.05, ∗∗p ≤0.01, ∗∗∗p ≤0.001, ∗∗∗∗p ≤0.0001.
Figure 4
Figure 4
Loss of IL-32 leads to perturbations in metabolic pathways (A) PCA plot of metabolomes from two clones of INA-6 KO cells and WT mock cells. (B) Volcano plot showing significant different metabolites (p <0.05) between KO cells and WT mock cells (metabolite expression from replicates from two KO clones were merged) See also Table S1. Significance was determined by two-sided Student's t test using MetaboAnalyst 4.0 software. (C) Representative image of lipid droplets in INA-6 IL-32 KO and WT mock cells, stained with Nile Red and Hoechst. Polar lipids (red) were excited at 590 nm (600–700 nm) and neutral lipids (green) at 488 nm (500–580 nm). Confocal imaging was performed with a Leica TCS SP8 STED 3X, using a 63 × 1.4 (oil) objective and LAS X software. Scale bar: 10 μM. See Figure S4 for overview images. (D) Two INA-6 KO cell lines and WT mock cells were subjected to RNA sequencing, and the PCA plot shows the overall differences in gene expression between KO cells and WT mock cells. (E) Volcano plot showing the most significantly upregulated and downregulated genes in INA-6 KO cells (2 clones) versus WT mock cells. Statistical significance analyzed by Linear Models for Microarray Analysis (limma) in R with Benjamini-Hochberg-adjusted p values. See also Table S2 for complete gene list. (F) Joint pathway analysis (SMPDB pathways, MetaboAnalyst 4.0) of transcriptomic and metabolomic data from 2 INA-6 IL-32 KO clones and WT mock cells. The inverse logged p-value of the different pathways is shown on the y-axis, and the size and color on the dots (increased size and increasingly red) correspond to the increased inverse log p-value. Significance was determined by two-sided Student's t test using MetaboAnalyst 4.0 software. The joint pathway analysis is based on metabolites in Table S1 and genes (fold change >0.5 or < −0.5 and adjusted p value <0.05) in Table S2. (G) Significantly (p <0.05) altered citric acid cycle intermediates in two KO clones (KO1, KO2) versus WT mock cells (See also Table S1). Data are presented as mean peak intensity ± SD of 4 replicates. (H) Illustration of significantly differentially expressed genes and metabolites from the most enriched pathways in the joint pathway enrichment analysis in (F) Significance was determined by two-sided Student's t test using MetaboAnalyst 4.0 software.
Figure 5
Figure 5
IL-32 expression in primary myeloma cells is associated with inferior survival, cell division, and oxidative phosphorylation (A) Overall survival of IL-32 expressing patients (10th percentile) compared with nonexpressing patients (90th percentile) in the IA13 CoMMpass dataset P = 8.9e-5, using Cox proportional-hazards regression model. (B) IL-32 expression in individual patients at diagnosis and first relapse in RNA-sequenced CD138+ cells from CoMMpass IA13. Significance was determined by Wilcoxon signed-rank test. (C) GO-analysis of the upregulated genes (Benjamini-Hochberg-adjusted p value <0.05; log2 fold change >0 for up-regulated genes) in IL-32-expressing patients (10th percentile) compared with IL-32 nonexpressing patients (90th percentile). Top significantly enriched biological processes upregulated in IL-32 expressing patients are shown. The GO terms are ordered by the Benjamini-hochberg adjusted p values. See also Tables S3 and S4. (D) Correlation between IL32 and a proliferative index gene signature (calculated as the sum of expression values of the gene set as described in Hose et al. (2009). (E) GO-analysis of the downregulated genes (Benjamini-Hochberg-adjusted p value <0.05; log2 fold change <0 for down-regulated genes, respectively) in IL-32-expressing patients (10th percentile) compared with IL-32 nonexpressing patients (90th percentile). Top significantly enriched biological processes downregulated in IL-32 expressing patients are shown. The GO terms are ordered by the Benjamini-Hochberg adjusted p values. See also Tables S3 and S4.
Figure 6
Figure 6
Single cell transcriptome analysis of IL-32-expressing myeloma cells (A) Uniform manifold approximation and projection (UMAP) plot colored by the identified cell clusters from a single-cell dataset (GSE106218) with primary myeloma cells. Analyzed with Seurat package in R. (B) UMAP plot colored by the level of IL32-expression per cell. (C) UMAP plot colored by patient sample. (D) Top 20 gene ontology terms (biological processes) for genes enriched in IL-32 expressing patient cells. The GO terms are ordered by the Benjamini-Hochberg adjusted p values. The data were obtained from Ryu et al. (Ryu et al., 2020).
Figure 7
Figure 7
IL-32 expression promotes a more immature plasma cell phenotype (A) Venn-diagram of overlapping significant genes (p <0.01) that were more highly expressed in WT cells compared with KO cells (comparing two INA-6 KO clones [KO1, KO2] with WT mock cells) and upregulated in IL-32 patients (comparing IL-32- expressing patients versus nonexpressing patients). See also Table S5. (B) Gene expression of MME, IRF8, and SORL1 in patients expressing IL-32 (10th percentile) compared with nonexpressing (90th percentile) patients. Significance determined by limma in R. (C) Gene expression of MME, IRF8, and SORL1 in INA-6 IL-32 KO1, KO2, and WT mock cells. Significance determined by limma in R with Benjamini-Hochberg-adjusted p-values. Data presented are mean cpm ± SD of two replicates. (D) Evaluation of gene expression of markers associated with less differentiated stages of B cell maturation in CoMMpass IA13, comparing IL-32 expressing patients (upper 10th percentile) with nonexpressing patients (lower 90th percentile). Significance determined by limma in R. Boxplots show the median and 25th/75th quantiles and smallest/largest value within the 1.5 times interquartile rang. (E) Scatterplot of genes associated with less differentiated stages of B cell maturation in single cells with (N = 142) and without (N = 346) IL32-expression (from single cell transcriptomics). p values were calculated using the FindMarkers function in Seurat by comparing the high and low IL32 groups. (F) Surface expression of CD45 and CD38 in INA-6 KO and WT cells. Data are presented as median fluorescence intensity (MFI) from 3 independent experiments and significance determined by unpaired student's t test. Bare plots show mean ± SEM. (G) Concentration of kappa light chain/cell detected in conditioned media from WT and KO cells as indicated. p values were calculated by the ratio paired t test. ns, not significant; ∗p ≤0.05, ∗∗p ≤0.01, ∗∗∗p ≤0.001, ∗∗∗∗p ≤0.0001.

Similar articles

Cited by

References

    1. Aass K.R., Kastnes M.H., Standal T. Molecular interactions and functions of IL-32. J. Leukoc. Biol. 2021;109:143–159. doi: 10.1002/JLB.3MR0620-550R. - DOI - PubMed
    1. Azab A.K., Hu J., Quang P., Azab F., Pitsillides C., Awwad R., Thompson B., Maiso P., Sun J.D., Hart C.P., et al. Hypoxia promotes dissemination of multiple myeloma through acquisition of epithelial to mesenchymal transition-like features. Blood. 2012;119:5782–5794. doi: 10.1182/blood-2011-09-380410. - DOI - PMC - PubMed
    1. Bailur J.K., McCachren S.S., Doxie D.B., Shrestha M., Pendleton K., Nooka A.K., Neparidze N., Parker T.L., Bar N., Kaufman J.L., et al. Early alterations in stem-like/marrow-resident T cells and innate and myeloid cells in preneoplastic gammopathy. JCI Insight. 2019;4:e127807. doi: 10.1172/jci.insight.127807. - DOI - PMC - PubMed
    1. Bayeva M., Khechaduri A., Wu R., Burke M.A., Wasserstrom J.A., Singh N., Liesa M., Shirihai O.S., Langer N.B., Paw B.H., Ardehali H. ATP-binding cassette B10 regulates early steps of heme synthesis. Circ. Res. 2013;113:279–287. doi: 10.1161/CIRCRESAHA.113.301552. - DOI - PMC - PubMed
    1. Bianchi G., Munshi N.C. Pathogenesis beyond the cancer clone(s) in multiple myeloma. Blood. 2015;125:3049–3058. doi: 10.1182/blood-2014-11-568881. - DOI - PMC - PubMed