. 2021 Dec 10;25(1):103607.
doi: 10.1016/j.isci.2021.103607. eCollection 2022 Jan 21.

Integrative proteo-transcriptomic and immunophenotyping signatures of HIV-1 elite control phenotype: A cross-talk between glycolysis and HIF signaling

Affiliations

Integrative proteo-transcriptomic and immunophenotyping signatures of HIV-1 elite control phenotype: A cross-talk between glycolysis and HIF signaling

Sara Svensson Akusjärvi et al. iScience. .

Abstract

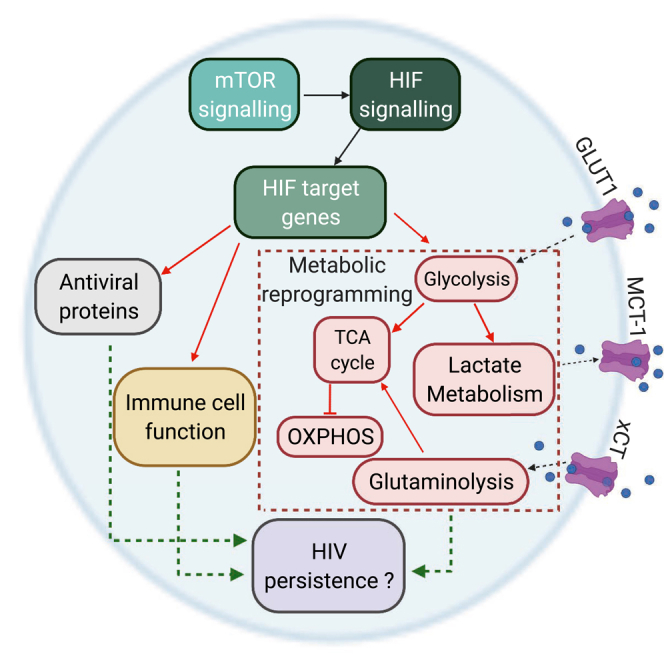
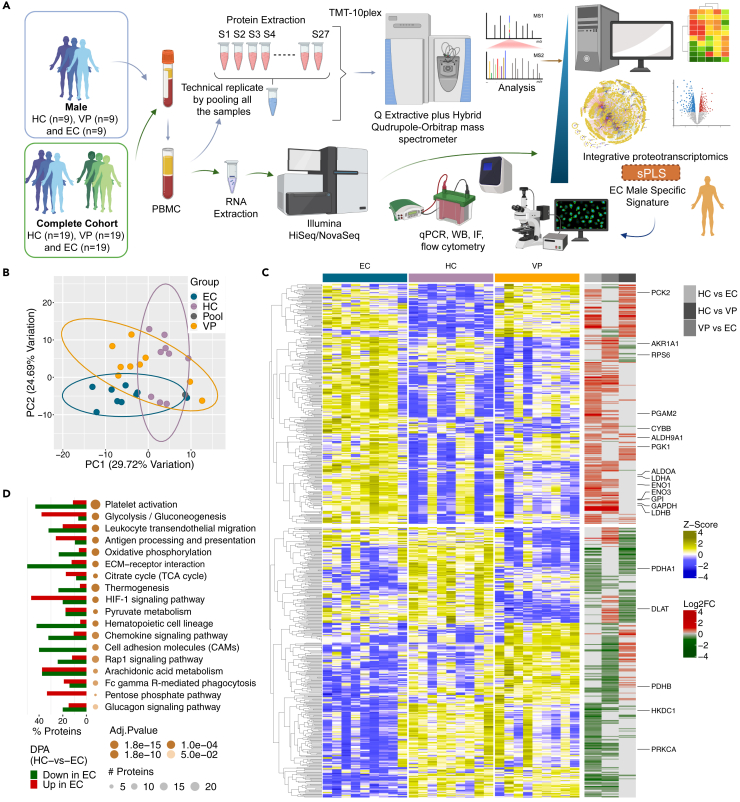
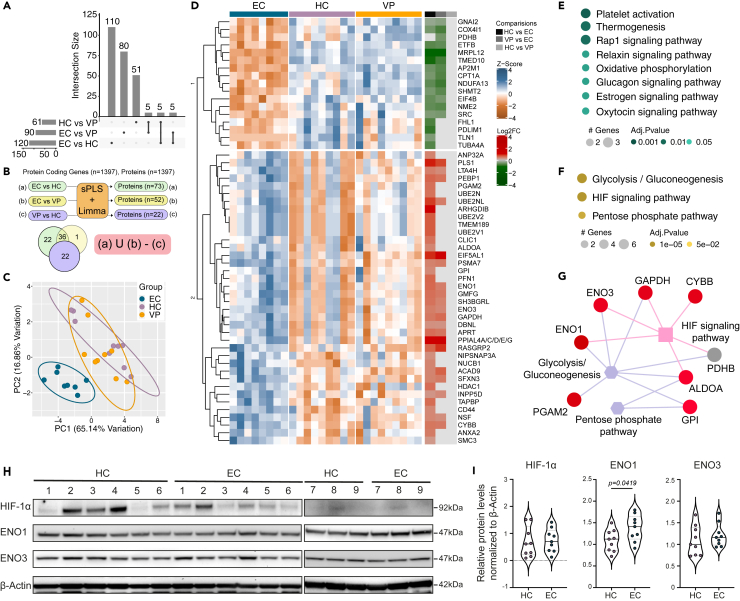
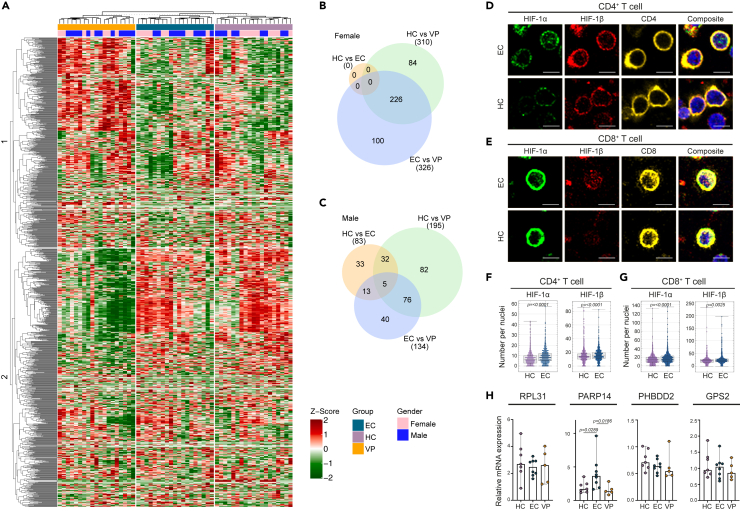
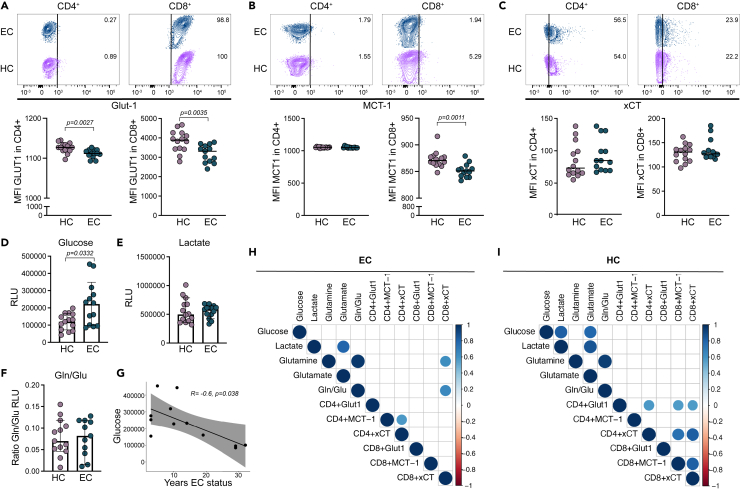
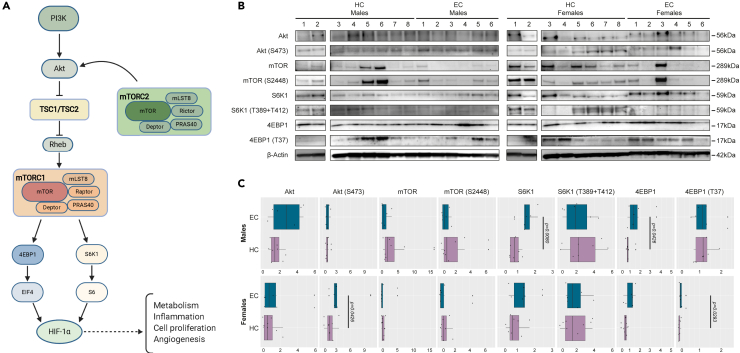
Natural control of HIV-1 is a characteristic of <1% of HIV-1-infected individuals, so called elite controllers (EC). In this study, we sought to identify signaling pathways associated with the EC phenotype using integrative proteo-transcriptomic analysis and immunophenotyping. We found HIF signaling and glycolysis as specific traits of the EC phenotype together with dysregulation of HIF target gene transcription. A higher proportion of HIF-1α and HIF-1β in the nuclei of CD4+ and CD8+ T cells in the male EC were observed, indicating a potential increased activation of the HIF signaling pathway. Furthermore, intracellular glucose levels were elevated in EC even as the surface expression of the metabolite transporters Glut1 and MCT-1 were decreased on lymphocytes indicative of unique metabolic uptake and flux profile. Combined, our data show that glycolytic modulation and altered HIF signaling is a unique feature of the male EC phenotype that may contribute to natural control of HIV-1.

Keywords: Glycobiology; Immunology; Molecular biology; Omics; Virology.


Conflict of interest statement

The authors declare no competing interests.

Figures

None
Graphical abstract
Figure 1
Figure 1
HIF signaling and glycolysis are unique characteristics in male EC on a proteomic level Study design and proteomic analysis. (A) Study design and workflow of sample processing, data generation, and integrative analysis of proteomic and transcriptomic data. PBMCs were prepared from a cohort of male HIV-1-negative individuals (HC, n = 9), elite controllers (EC, n = 9), and viremic progressors (VP, n = 9); and protein lysates were analyzed on Q Exactive Plus Hybrid Quadrupole-Orbitrap mass spectrometer while RNA was sent for Illumina HiSeq/NovaSeq sequencing together with a larger cohort of both male and female HC (n = 19), EC (n = 19), and VP (n = 19). Raw data processing, analysis, and data integration were performed by an in-house R script and sparse partial least squares (sPLS) regression and classification. (B) Principal component analysis showing distribution of all the samples with respect to proteomics data. The data is plotted on 2D space after normalization and batch correction. The first two principal components capturing maximum of variances were used. Data ellipses were drawn at the level of 0.95. (C) Heatmap visualizing quantile normalized and Z-scaled expression patterns of proteins significantly dysregulated in any of the pairwise comparisons among the study cohorts. Column annotations represent the cohorts and the different analysis pairs used for comparison. Proteins are clustered hierarchically based on the Euclidean distance. (D) Visualization of functional analysis of significantly dysregulated proteins in EC compared to HC. The size of the bubbles is relative to the number of features within each pathway while the color gradients represent adjusted p value of the enrichment test. The bar graph denotes number of proteins increased or decreased in each pathway. See also Figure S1.
Figure 2
Figure 2
Proteo-transcriptomic integration confirms HIF signaling and glycolysis as unique features of the male EC phenotype Proteo-transcriptomic analysis in HC (n = 9), EC (n = 9), and VP (n = 9). (A) Upset plot describing the number of features detected by each of the sparse partial least squares models. (B) Schematic representation of the derivation of EC-specific proteins. (C) PCA plot representing sample clustering with respect to EC-specific proteins. The first two principal components capturing maximum of variance were used. Data ellipses were drawn at the level of 0.9. (D) Heatmap visualizing quantile normalized and Z-scaled expression pattern of EC-specific proteins. Column annotation represents the cohorts and the different groups used for pairwise comparison. Proteins are hierarchically clustered based on Euclidean distance. (E) Functional analysis results of proteins belonging to cluster 1 in (D). Size of the bubble and the color gradient are relative to number of features in each pathway and adjusted p value of the enrichment test, respectively. (F) Functional analysis results of the proteins belonging to cluster 2 in (D). The bubble size and color gradient are relative to number of features in each pathway and adjusted p value of the enrichment test, respectively. (G) Schematic representation of the proteins belonging to pathways in (F). Circular nodes in red represents upregulated proteins in EC, in relation to HC, and gray color denotes non-significant expression levels. (H) Western blot analysis of HIF target genes identified in (G) for male HC (n = 9), and EC (n = 9). (I) Violin plots representing relative protein quantification of HIF-1α, ENO1, and ENO3 normalized to β-Actin from (H) using unpaired t test (significance level, p < 0.05) represented with violin plot with mean. See also Figure S2.
Figure 3
Figure 3
Dysregulation of HIF target gene transcription in EC Analysis of HIF target genes transcription. (A) Heatmap visualizing log2 transformed and Z-scaled expression pattern of HIF target genes from transcriptomic data of male and female HC (n = 19), EC (n = 19), and VP (n = 19). Column annotation represents the study cohorts and sex of each sample. Genes are hierarchically clustered based on Euclidean distance. (B) Venn diagram of differentially expressed HIF target genes within the female cohort. (C) Venn diagram of differentially expressed HIF target genes within the male cohort. (D and E) Immunofluorescence detection of HIF-1α and HIF-1β in CD4+ T cells (D) and CD8+ T cells (E) of EC (n = 3) and HC (n = 3). Scale bar is 5μM. (F and G) Protein detection of HIF-1α and HIF-1β in nuclei of CD4+ (F) and CD8+ T cells (G). (H) qPCR validation of HIF target gene mRNA expression in male HC (n= 7), EC (n= 8), and VP (n= 5) of RPL31, PARP14, RHBDD2, and GPS2. (F–H) Statistical analysis was performed using Mann-Whitney U-test (significance level, p < 0.05), represented as median with 95% CI (H) or median with IQR (F and G). See also Figure S3.
Figure 4
Figure 4
The metabolic uptake and secretion profiles are unique in EC Metabolite secretion and uptake analysis in EC (n = 13) and HC (n = 14). (A–C) Receptor expression on CD4+ and CD8+ T cells of Glut-1 (A), MCT-1 (B), and xCT (C). Contour plots are representative images showing median expression profile in % of cells and graphs show the median fluorescence intensity (MFI). (D–F) Intracellular levels of glucose (D), lactate (E), and glutamine/glutamate (Gln/Glu) ratio (F). Graphs show the relative light unit (RLU) and were performed in duplicates. (G) Correlation analysis of intracellular glucose levels with duration of EC status. (H and I) Correlation matrix of intracellular metabolite levels and transporter expression in EC (H) and HC (I). Statistical analysis was performed using Mann-Whitney U-test (significance level, p < 0.05) and represented with median and 95% CI or Spearman correlation (significance level, p < 0.05). See also Figure S4.
Figure 5
Figure 5
Dysregulated mTOR signaling in EC Evaluation of mammalian target of Rapamycin (mTOR) activity in male and female HC (n =16) and EC (n =12). (A) Schematic describing proteins involved in mTOR signaling. (B) Western blot image showing protein detection of Akt, Akt (S473), mTOR, mTOR (S2448), S6K1, S6K1 (T389 + T412), 4EBP1, 4EBP1 (T37), and β-Actin. (C) Relative protein quantification of Akt, Akt (S473), mTOR, mTOR (S2448), S6K1, S6K1 (T389 + T412), 4EBP1, and 4EBP1 (T37), normalized to β-Actin from (B). (C) Statistical significance was determined using Mann-Whitney U-test (Significance level, p < 0.05) and represented median with 95% CI. See also Figure S5.

References

    1. Besnard E., Hakre S., Kampmann M., Lim H.W., Hosmane N.N., Martin A., Bassik M.C., Verschueren E., Battivelli E., Chan J., et al. The mTOR complex controls HIV latency. Cell Host Microbe. 2016;20:785–797. - PMC - PubMed
    1. Andrews S. http://www.bioinformatics.babraham.ac.uk/projects/fastqc/
    1. Blighe K., Lun A. https://github.com/kevinblighe/PCAtools
    1. Chowdhury F.Z., Ouyang Z., Buzon M., Walker B.D., Lichterfeld M., Yu X.G. Metabolic pathway activation distinguishes transcriptional signatures of CD8+ T cells from HIV-1 elite controllers. AIDS. 2018;32:2669–2677. - PMC - PubMed
    1. Clerc I., Abba Moussa D., Vahlas Z., Tardito S., Oburoglu L., Hope T.J., Sitbon M., Dardalhon V., Mongellaz C., Taylor N. Entry of glucose- and glutamine-derived carbons into the citric acid cycle supports early steps of HIV-1 infection in CD4 T cells. Nat. Metab. 2019;1:717–730. - PMC - PubMed