. 2021 Dec 11;25(1):103610.
doi: 10.1016/j.isci.2021.103610. eCollection 2022 Jan 21.

The evolution of knowledge on genes associated with human diseases

Affiliations

The evolution of knowledge on genes associated with human diseases

Thomaz Lüscher-Dias et al. iScience. .

Abstract

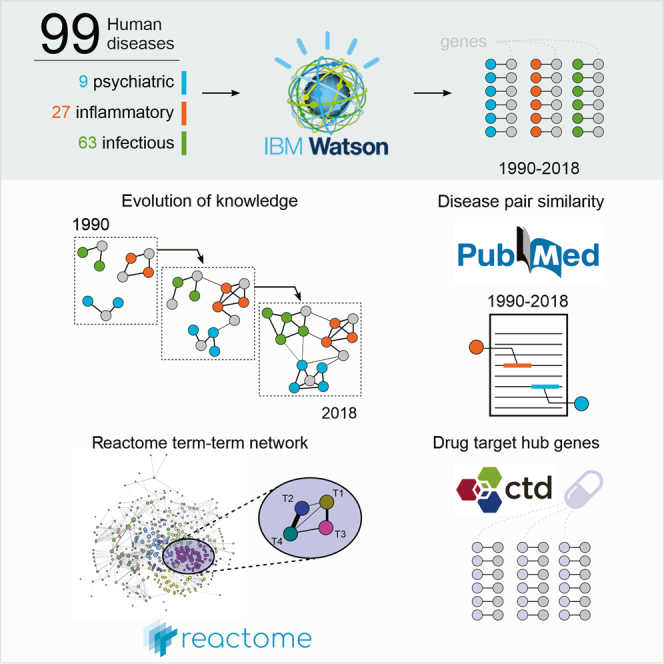
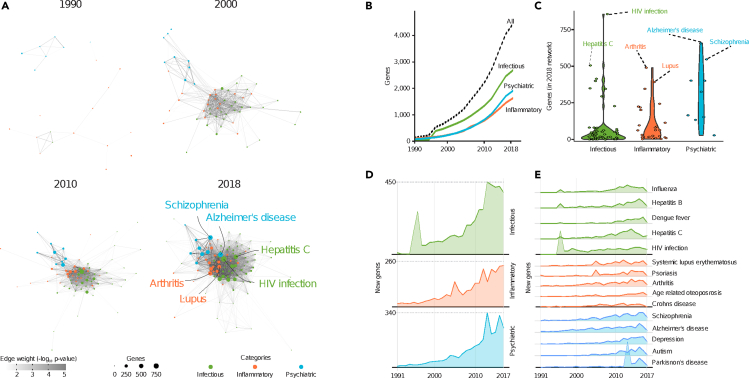
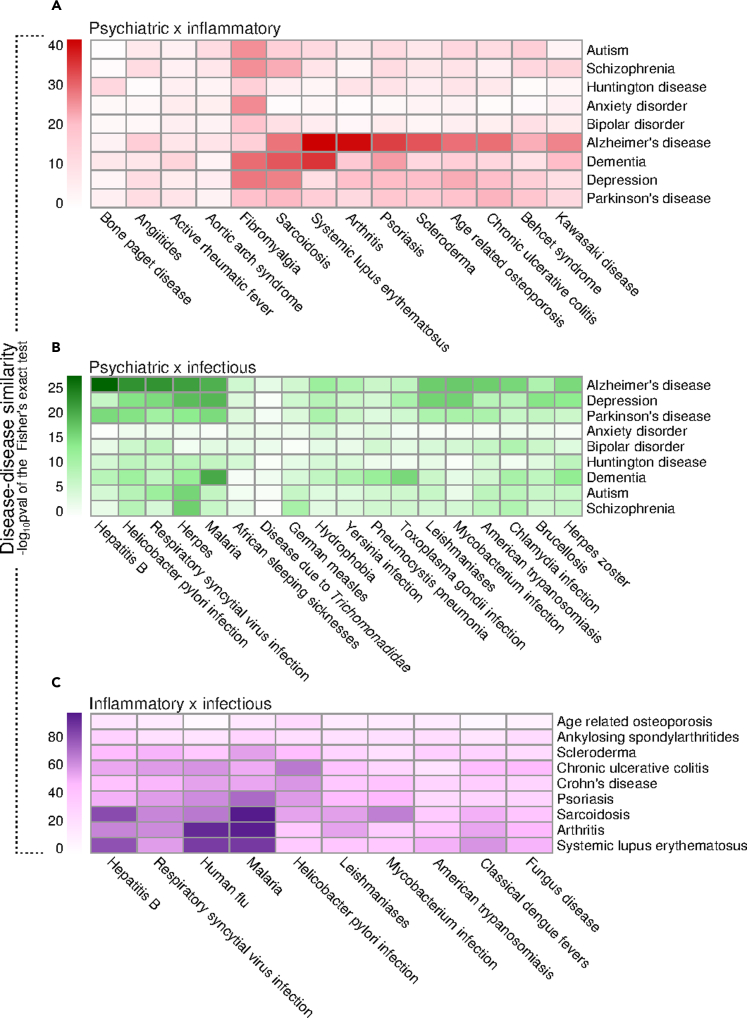
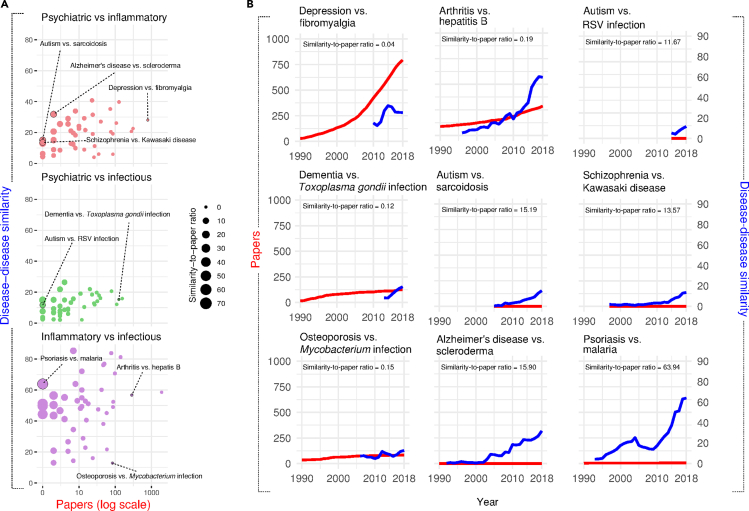
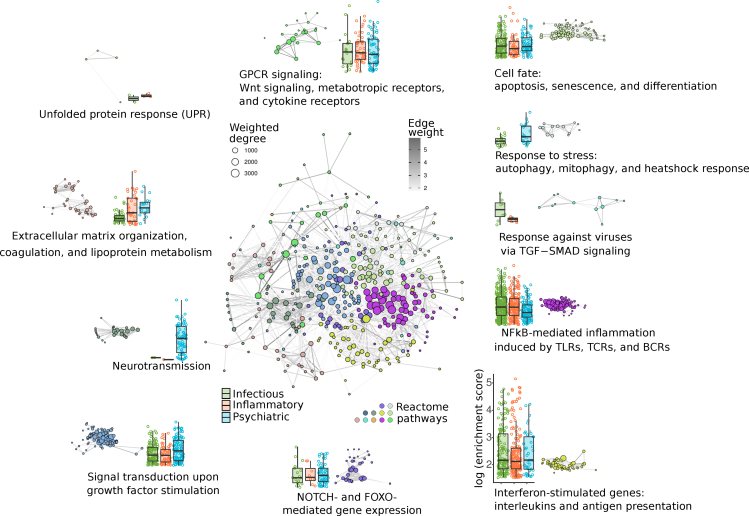
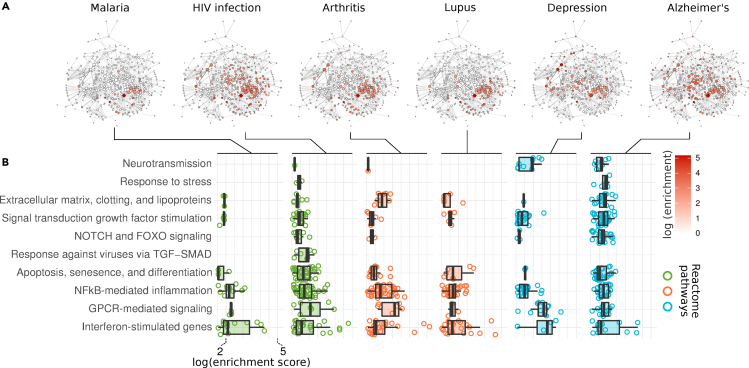
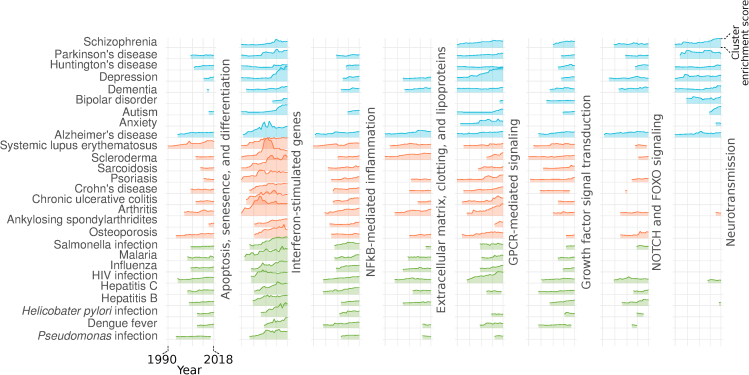
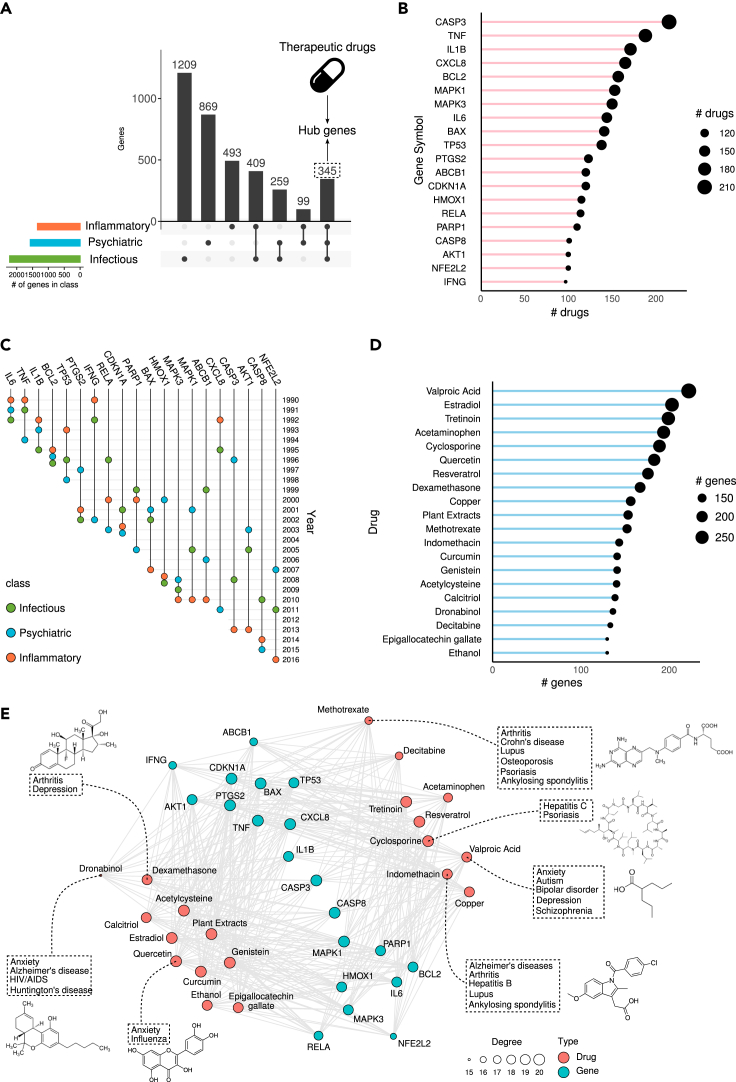
Thousands of biomedical scientific articles, including those describing genes associated with human diseases, are published every week. Computational methods such as text mining and machine learning algorithms are now able to automatically detect these associations. In this study, we used a cognitive computing text-mining application to construct a knowledge network comprising 3,723 genes and 99 diseases. We then tracked the yearly changes on these networks to analyze how our knowledge has evolved in the past 30 years. Our systems approach helped to unravel the molecular bases of diseases and detect shared mechanisms between clinically distinct diseases. It also revealed that multi-purpose therapeutic drugs target genes that are commonly associated with several psychiatric, inflammatory, or infectious disorders. By navigating this knowledge tsunami, we were able to extract relevant biological information and insights about human diseases.

Keywords: Association analysis; Bioinformatics; Molecular network; Systems biology.


Conflict of interest statement

The authors declare no competing interests.

Figures

None
Graphical abstract
Figure 1
Figure 1
Evolution of knowledge on the molecular bases of human diseases (A) Representative disease-disease knowledge networks on infectious, inflammatory, and psychiatric disorders in 1990, 2000, 2010, and 2018. All quantitative analyses were performed using the 29 yearly networks from 1990 to 2018. Nodes represent diseases and are proportional to the number of genes associated with each disease in each year. Edge weights are proportional to the significance of gene-sharing between each pair of diseases. Only edges with a p value < 0.01 are depicted. (B) Cumulative number of genes associated with each disease category and with all diseases from 1990 to 2018. (C) Distribution of the number of genes associated with each disease and category in 2018. (D) Number of new genes added to the network in each category per year. (E) Number of new genes added to the network in selected diseases each year. Color code: green—infectious diseases, orange—inflammatory diseases, and blue—psychiatric disorders.
Figure 2
Figure 2
Evolution of disease relationships between categories Disease-disease similarity between diseases of different categories in the 2018 network according to their shared genes. The similarity score was defined as the –log10pval of the Fisher's exact test result of the gene overlap between each disease pair. Each heatmap represents the similarity score between diseases of two different categories: (A) psychiatric versus inflammatory diseases. (B) psychiatric versus infectious diseases. (C) inflammatory versus infectious diseases.
Figure 3
Figure 3
Evolution of the knowledge gap between diseases of different categories (A) Number of papers versus disease-disease similarity for all disease pairs from distinct categories. Each point represents a disease pair, and the size of the point is proportional to the similarity-to-paper ratio for that pair. This index was obtained as a ratio of the similarity score to the total number of papers published for each disease pair in 2018. (B) Selected cases of disease pairs with low to high similarity-to-paper ratios depicting the evolution in the number of papers on each pair and the evolution of the similarity between them.
Figure 4
Figure 4
Reactome term network built from the ORA results of the genes associated with human diseases in 2018 Significant Reactome ORA terms (p.adjust <0.01) obtained from the genes of the top 9 diseases in the 2018 network were connected to each other according to the significance of the gene sharing between them (edge weight). Only terms with a gene sharing with a p.adjust <0.01 were connected. We detected 11 clusters (node colors) of closely related terms using the Louvain clustering algorithm in the R package igraph (Csardi and Nepusz, 2006) and compared the enrichment score distribution of the terms in these clusters in each disease category (boxplots). Boxplots are colored according to the disease categories: green—infectious diseases, orange—inflammatory diseases, and light blue—psychiatric disorders. Dots in the boxplots represent individual enriched Reactome pathways that belong to each network cluster.
Figure 5
Figure 5
Key biological pathways are enriched among the genes associated with human diseases in 2018 (A) ORA networks depicting the enrichment score of Reactome pathways in selected infectious, inflammatory, and psychiatric disorders. The networks in A have the same topology of the network in Figure 04. The nodes are colored according to the logarithm of enrichment score (−log10pval) of the terms represented by each node. (B) ORA enrichment score distribution of the terms in the clusters and diseases from panel (A). Boxplots are colored according to the category of each disease: green—infectious, orange—inflammatory, and light blue—psychiatric. Dots in the boxplots represent individual Reactome pathways that belong to the clusters listed in the y axis and that were enriched in each disease.
Figure 6
Figure 6
Evolution of knowledge on biological pathways Ridge plots of the enrichment score of selected clusters from the network in Figure 04 for the top 9 diseases in each category from 1990 to 2018. The height of the ridges are proportional to the mean enrichment score (mean log10pval) of the Reactome pathways in each cluster listed in the y axis.
Figure 7
Figure 7
Evolution of drug target hub genes (A) Upset plot showing the common genes between all categories (hub genes), between two categories exclusively and genes that are unique to each category. (B) Number of therapeutic drugs of inflammatory, infectious, and psychiatric diseases that target the top 20 target hub genes according to the comparative toxicogenomics database (CTD). (C) Timeline of the association of the top 20 target hub genes to the gene-disease network. The year in which each gene was associated with the first disease of each category is depicted by the circles with distinct colors for each category. (D) Number of hub genes targeted by the top 20 drugs that target more hubs according to CTD. (E) Drug-gene network depicting the top 20 drugs and that target hub genes. We selected a few drugs and illustrated their molecular structure and diseases for which they are listed as therapeutic according to CTD.

Similar articles

References

    1. Bai T., Gong L., Wang Y., Wang Y., Kulikowski C.A., Huang L. A method for exploring implicit concept relatedness in biomedical knowledge network. BMC Bioinformatics. 2016;17:265. doi: 10.1186/s12859-016-1131-5. - DOI - PMC - PubMed
    1. Balak D.M., Hajdarbegovic E. Drug-induced psoriasis: Clinical perspectives. Psoriasis (Auckl) 2017;7:87–94. doi: 10.2147/PTT.S126727. - DOI - PMC - PubMed
    1. Barabási A.-L., Gulbahce N., Loscalzo J. Network medicine: A network-based approach to human disease. Nat. Rev. Genet. 2011;12:56–68. doi: 10.1038/nrg2918. - DOI - PMC - PubMed
    1. de Baumont A., Maschietto M., Lima L., Carraro D.M., Olivieri E.H., Fiorini A., Barreta L.A.N., Palha J.A., Belmonte-de-Abreu P., Moreira Filho C.A., Brentani H. Innate immune response is differentially dysregulated between bipolar disease and schizophrenia. Schizophr. Res. 2015;161:215–221. doi: 10.1016/j.schres.2014.10.055. - DOI - PubMed
    1. Ben-Zvi I., Kivity S., Langevitz P., Shoenfeld Y. Hydroxychloroquine: From malaria to autoimmunity. Clin. Rev. Allergy Immunol. 2012;42:145–153. doi: 10.1007/s12016-010-8243-x. - DOI - PMC - PubMed

LinkOut - more resources