. 2021 Dec 13;25(1):103624.
doi: 10.1016/j.isci.2021.103624. eCollection 2022 Jan 21.

Beat-to-beat dynamic regulation of intracellular pH in cardiomyocytes

Affiliations

Beat-to-beat dynamic regulation of intracellular pH in cardiomyocytes

Yankun Lyu et al. iScience. .

Abstract

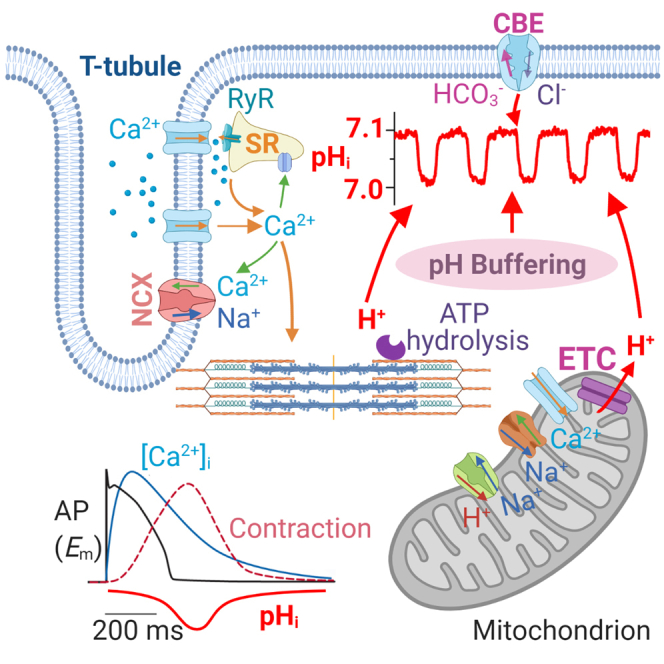
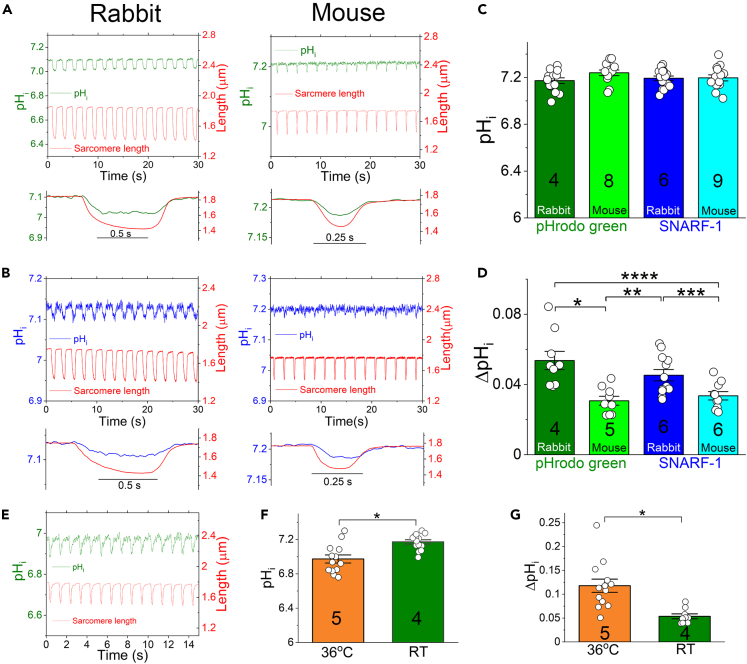
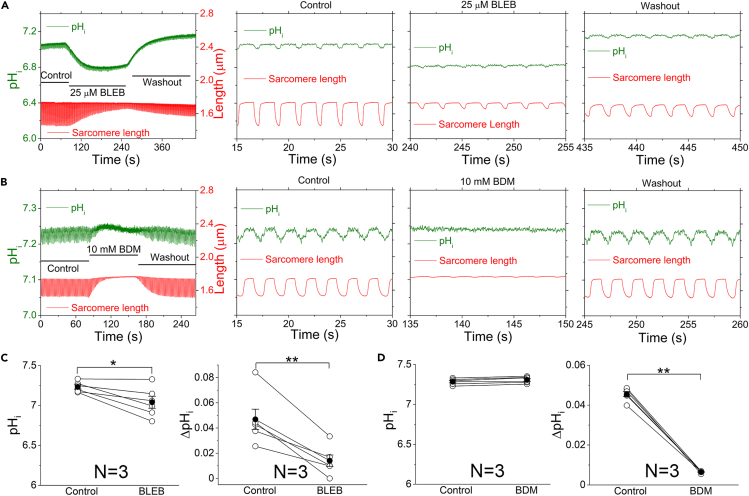
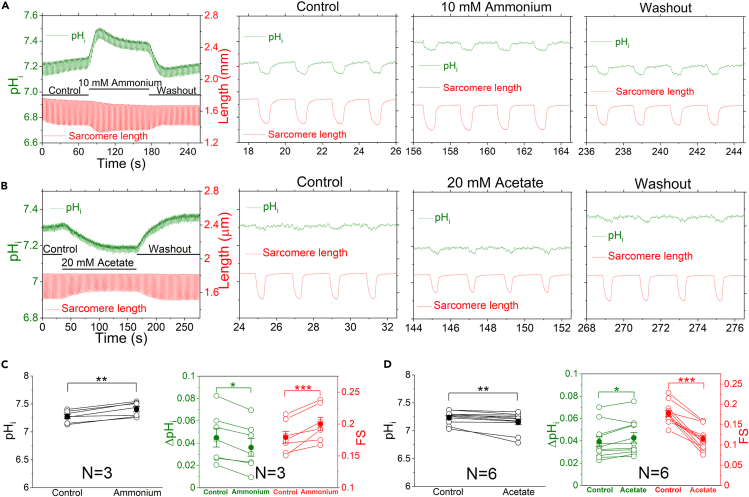
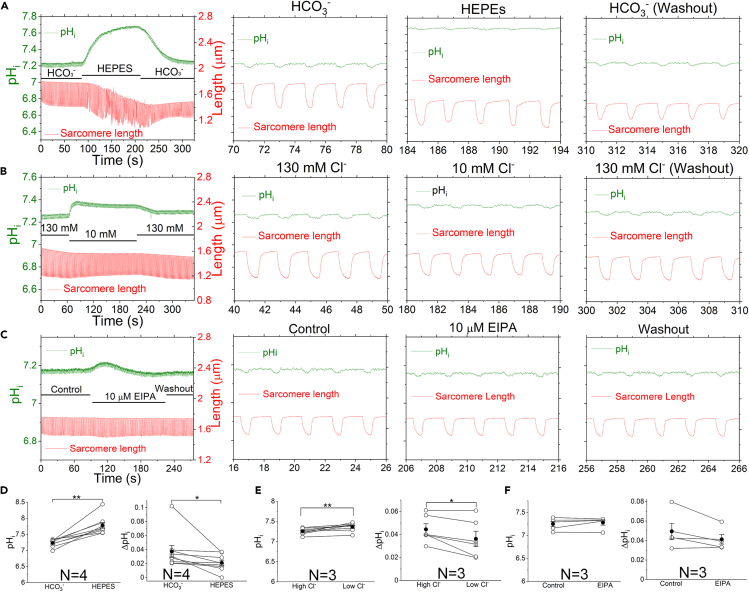
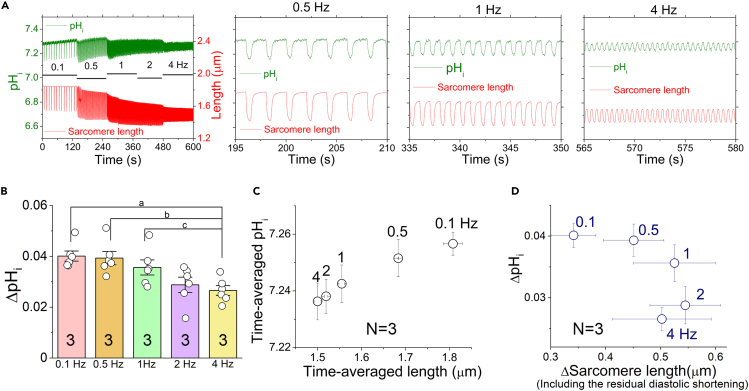
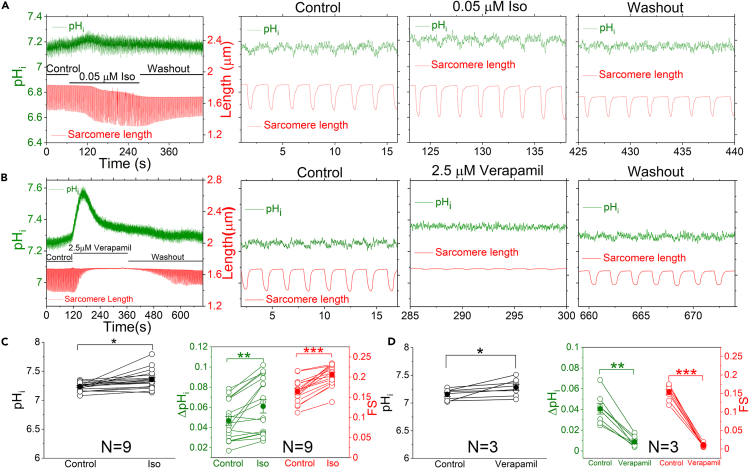
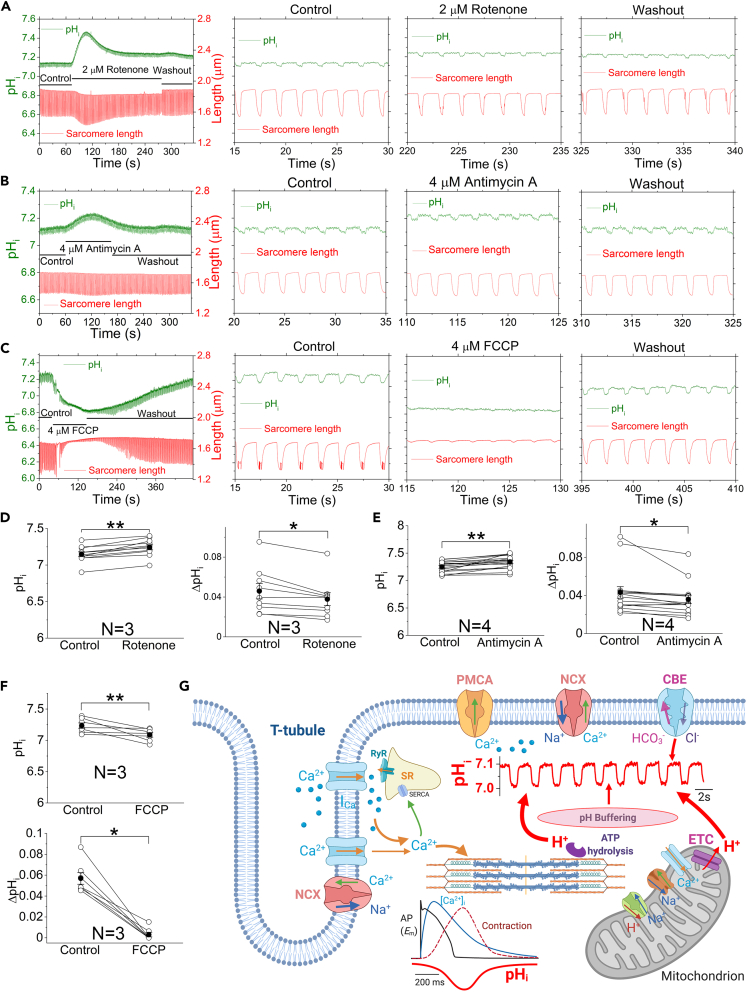
The mammalian heart beats incessantly with rhythmic mechanical activities generating acids that need to be buffered to maintain a stable intracellular pH (pHi) for normal cardiac function. Even though spatial pHi non-uniformity in cardiomyocytes has been documented, it remains unknown how pHi is regulated to match the dynamic cardiac contractions. Here, we demonstrated beat-to-beat intracellular acidification, termed pHi transients, in synchrony with cardiomyocyte contractions. The pHi transients are regulated by pacing rate, Cl-/HCO3 - transporters, pHi buffering capacity, and β-adrenergic signaling. Mitochondrial electron-transport chain inhibition attenuates the pHi transients, implicating mitochondrial activity in sculpting the pHi regulation. The pHi transients provide dynamic alterations of H+ transport required for ATP synthesis, and a decrease in pHi may serve as a negative feedback to cardiac contractions. Current findings dovetail with the prevailing three known dynamic systems, namely electrical, Ca2+, and mechanical systems, and may reveal broader features of pHi handling in excitable cells.

Keywords: Cardiovascular medicine; Molecular biology; Molecular dynamics.


Conflict of interest statement

The authors declare no competing interests.

Figures

None
Graphical abstract
Figure 1
Figure 1
pHi transients in rabbit and mouse ventricular cardiomyocytes recorded at RT and 36°C (A) Representative traces of pHi in rabbit (left) and mouse (right) ventricular myocytes in parallel with the sarcomere length measurement at RT. Cardiomyocytes were paced at 0.5 Hz with pHrodo green loading. The averaged traces of pHi and sarcomere shortening are overlapped and shown in the lower panel. (B) Representative traces of pHi in rabbit (left) and mouse (right) ventricular myocytes in parallel with the sarcomere length measurement at RT. Cardiomyocytes were paced at 0.5 Hz with SNARF-1 loading. The averaged traces of pHi and sarcomere shortening are overlapped and shown in the lower panel. (C) Comparisons of the baseline pHi measured at RT in rabbit (n = 14 and 16 for pHrodo green and SNARF-1, respectively) and mouse cardiomyocytes (n = 13 and 14 for pHrodo green and SNARF-1, respectively). Animal numbers (N) are shown in the bar graphs. (D) Comparisons of the absolute pHi transient amplitudes (ΔpHi) in cardiomyocytes using pHrodo green (rabbit: n = 9, mouse: n = 9; ∗p = 0.010), and SNARF-1 (rabbit: n = 12, mouse: n = 10; ∗∗p = 0.012; ∗∗∗p = 0.028, ∗∗∗∗p = 0.021) at RT (one-way ANOVA combined with Tukey's post hoc analyses), where n represents cell numbers. (E) pHi measurement in rabbit ventricular myocytes using pHrodo green with simultaneous sarcomere length measurement paced at 1 Hz at 36°C. (F and G) Comparisons of baseline pHi (F, n = 14 and 13 for RT and 36°C, respectively; ∗p = 0.00069) and ΔpHi (G, n = 9 and 13 for RT and 36°C, respectively; ∗p = 0.0014) in rabbit ventricular myocytes (two-sample t test). Data are represented as mean ± SEM. See also Figures S2 and S3.
Figure 2
Figure 2
Reduction of pHi transients by the inhibition of cardiomyocyte contractions (A) Inhibition of the contraction by 25 μM BLEB reduced the pHi transients. (B) Inhibition of the contraction by 10 mM BDM abolished the pHi transients. The right three panels in A and B showed three fragments of the time course at three conditions as shown on the top. (C) Comparisons of baseline pHi (∗p = 0.0074, n = 6, paired sample t test) and ΔpHi (∗∗p = 0.0009; n = 6, paired sample t test) in the absence and presence of 25 μM BLEB. (D) Comparisons of baseline pHi and ΔpHi in the absence and presence of 10mM BDM (∗∗p = 0.0055, n = 6; paired sample t test). The open circles represent the individual data points, and the filled circles and the error bars represent Mean ± S.E.M. N and n represent the animal numbers and cell numbers, respectively. See also Figure S4.
Figure 3
Figure 3
Regulation of pHi transients by alterations of pHi (A) Effects of cellular alkalization by perfusing solutions containing 10 mM ammonium. (B) Effects of cellular acidification by perfusing solutions containing 20 mM acetate. The right three panels in A and B showed three fragments of the time course at three conditions as shown on the top. (C) Comparisons of baseline pHi, ΔpHi and sarcomere fractional shortening (FS) in the absence and presence of 10 mM ammonium (∗p = 0.00072, ∗∗p = 0.00078, ∗∗∗p = 0.0042, n = 7; paired sample t test). (D) Comparisons of pHi, ΔpHi and FS in the absence and presence of 20 mM acetate (∗p = 0.036, ∗∗p = 0.00098, ∗∗∗p = 0.000028, n = 11; paired sample t test). N and n represent animal numbers and cell numbers, respectively. Data are represented as mean ± SEM.
Figure 4
Figure 4
Effects of sarcolemma H+-equivalent transporter activities on baseline pHi and pHi transients (A) The time course of pHi measurement when the cell was perfused with Tyrode's solutions either using HCO3- or HEPES as pH buffer (left). (B) The time course of pHi measurement when the cell was perfused with Tyrode's solutions containing higher (130 mM) and lower (10 mM) Cl (left). (C) The time course of pHi measurement when the cell was perfused by Tyrode's containing 10 μM EIPA (left). The right three panels in A, B, and C showed three fragments of the time course at three conditions as shown on the top of the panel. (D) Comparisons of baseline pHi and ΔpHi of A (∗p = 0.0039, n = 8; ∗∗p = 0.0039, n = 9; paired Wilcoxon signed-rank test). (E) Comparisons of baseline pHi and ΔpHi of B (∗p = 0.022, n = 6; ∗∗p = 0.0046, n = 9; paired sample t test). (F) Comparisons of baseline pHi and ΔpHi of C (n = 5). N and n represent animal numbers and cell numbers, respectively. Data are represented as mean ± SEM.
Figure 5
Figure 5
Increasing the pacing rate reduced the pHi transients (A) The time course of pHi measurement was shown on the left, and the right three panels showed three fragments of the time course at three pacing rates. (B) Comparisons of ΔpHi at different pacing rates (The p values for a: 0.018; b: 0.0087; c: 0.01. n = 6, one-way repeated measures ANOVA combined with Tukey's post hoc analyses). Animal numbers (N) are shown in the bar graphs. (C) The relationship between the time-averaged sarcomere length and the time-averaged pHi during pacing at different pacing rates (n = 6). (D) The relationship between ΔpHi and ΔSarcomere length (including the residual diastolic shortening) at different pacing rates (n = 6). N and n represent animal numbers and cell numbers, respectively. Data are represented as mean ± SEM. See also Figures S5 and S6.
Figure 6
Figure 6
Activation of β-adrenergic signaling by isoproterenol increased the pHi transients (A) The time course of pHi measurement with the perfusion of Tyrode's solutions containing 0.05 μM isoproterenol (Iso) was shown on the left, and the right three panels showed three fragments of the time course at three conditions. (B) The time course of pHi measurement with the perfusion of Tyrode's solutions containing 2.5 μM verapamil was shown on the left, and the right three panels showed three fragments of the time course at three conditions. (C) Comparisons of baseline pHi (∗p = 0.0024, n = 18), ΔpHi and sarcomere fractional shortening (FS) (∗∗p = 0.00084, n = 18; ∗∗∗p = 0.0000076, n = 18) in the absence and presence of 0.05 μM of isoproterenol (paired sample t test). (D) Comparisons of baseline pHi (∗p = 0.035, n = 8), ΔpHi and FS (∗∗p = 0.00010, n = 8; ∗∗∗p = 0.00000017, n = 8) in the absence and presence of 2.5 μM of verapamil (paired sample t test). N and n represent animal numbers and cell numbers, respectively. Data are represented as mean ± SEM.
Figure 7
Figure 7
Inhibition of mitochondrial ETC reduced the pHi transients (A–C) Time courses of pHi measurement when the cell was perfused by Tyrode's containing 2 μM rotenone (A, left), or containing 4 μM antimycin A (B, left), or containing 4 μM FCCP (C, left). The right three panels showed three fragments of the time course at three conditions as shown on the top. (D) Comparisons of baseline pHi (∗∗p = 0.000083, n = 11, paired sample t test) and ΔpHi of A (∗p = 0.0078, n = 9; ΔpHi: 0.046 ± 0.008 in control vs 0.038 ± 0.006 with rotenone, paired Wilcoxon signed-rank test). After washout, ΔpHi = 0.045 ± 0.007, and is not statistically different compared to control (p = 0.86). (E) Comparisons of baseline pHi (∗∗p = 0.00056, n = 17, paired sample t test) and ΔpHi of B (∗p = 0.00031, n = 15. ΔpHi: 0.046 ± 0.007 in control vs 0.037 ± 0.006 with antimycin A, paired Wilcoxon signed-rank test). After washout, ΔpHi = 0.045 ± 0.005, and is not statistically different compared to control (p = 0.67). (F) Comparisons of baseline pHi (∗∗p = 0.0002, n = 7, paired sample t test) and ΔpHi of C (∗p = 0.016, n = 7, paired Wilcoxon signed-rank test. ΔpHi: 0.057 ± 0.006 in control vs 0.003 ± 0.002 with FCCP). After washout, ΔpHi = 0.055 ± 0.005, and is not statistically different compared to control (p = 0.63). N and n represent animal numbers and cell numbers, respectively. Data are represented as mean ± SEM. (G) A summary diagram (created using BioRender.com) showing the beat-to-beat pHi regulatory system that dovetails with the prevailing dynamic electrical, Ca2+, and mechanical regulatory systems. SR: sarcoplasmic reticulum; RYR: ryanodine receptor; SERCA: sarcoplasmic reticulum Ca2+ ATPase; PMCA: plasma membrane Ca2+-ATPase; NCX: Na+/Ca2+ exchanger; AP: action potential; CBE: Cl/HCO3- exchanger; Em: membrane potential; ETC: electron transport chain.

Similar articles

  • Demonstration of Beat-to-Beat, On-Demand ATP Synthesis in Ventricular Myocytes Reveals Sex-Specific Mitochondrial and Cytosolic Dynamics.
    Rhana P, Matsumoto C, Santana LF. Rhana P, et al. bioRxiv [Preprint]. 2025 Jul 10:2025.07.07.663572. doi: 10.1101/2025.07.07.663572. bioRxiv. 2025. PMID: 40672169 Free PMC article. Preprint.
  • Short-Term Memory Impairment.
    Cascella M, Al Khalili Y. Cascella M, et al. 2024 Jun 8. In: StatPearls [Internet]. Treasure Island (FL): StatPearls Publishing; 2025 Jan–. 2024 Jun 8. In: StatPearls [Internet]. Treasure Island (FL): StatPearls Publishing; 2025 Jan–. PMID: 31424720 Free Books & Documents.
  • Systemic Inflammatory Response Syndrome.
    Baddam S, Burns B. Baddam S, et al. 2025 Jun 20. In: StatPearls [Internet]. Treasure Island (FL): StatPearls Publishing; 2025 Jan–. 2025 Jun 20. In: StatPearls [Internet]. Treasure Island (FL): StatPearls Publishing; 2025 Jan–. PMID: 31613449 Free Books & Documents.
  • The Black Book of Psychotropic Dosing and Monitoring.
    DeBattista C, Schatzberg AF. DeBattista C, et al. Psychopharmacol Bull. 2024 Jul 8;54(3):8-59. Psychopharmacol Bull. 2024. PMID: 38993656 Free PMC article. Review.
  • Management of urinary stones by experts in stone disease (ESD 2025).
    Papatsoris A, Geavlete B, Radavoi GD, Alameedee M, Almusafer M, Ather MH, Budia A, Cumpanas AA, Kiremi MC, Dellis A, Elhowairis M, Galán-Llopis JA, Geavlete P, Guimerà Garcia J, Isern B, Jinga V, Lopez JM, Mainez JA, Mitsogiannis I, Mora Christian J, Moussa M, Multescu R, Oguz Acar Y, Petkova K, Piñero A, Popov E, Ramos Cebrian M, Rascu S, Siener R, Sountoulides P, Stamatelou K, Syed J, Trinchieri A. Papatsoris A, et al. Arch Ital Urol Androl. 2025 Jun 30;97(2):14085. doi: 10.4081/aiua.2025.14085. Epub 2025 Jun 30. Arch Ital Urol Androl. 2025. PMID: 40583613 Review.

Cited by

References

    1. Backx P.H., Gao W.D., Azan-Backx M.D., Marban E. Mechanism of force inhibition by 2,3-butanedione monoxime in rat cardiac muscle: roles of [Ca2+]i and cross-bridge kinetics. J. Physiol. 1994;476:487–500. doi: 10.1113/jphysiol.1994.sp020149. - DOI - PMC - PubMed
    1. Bartos D.C., Morotti S., Ginsburg K.S., Grandi E., Bers D.M. Quantitative analysis of the Ca(2+) -dependent regulation of delayed rectifier K(+) current IKs in rabbit ventricular myocytes. J. Physiol. 2017;595:2253–2268. doi: 10.1113/JP273676. - DOI - PMC - PubMed
    1. Bassani R.A., Bassani J.W., Bers D.M. Mitochondrial and sarcolemmal Ca2+ transport reduce [Ca2+]i during caffeine contractures in rabbit cardiac myocytes. J. Physiol. 1992;453:591–608. doi: 10.1113/jphysiol.1992.sp019246. - DOI - PMC - PubMed
    1. Bell C.J., Bright N.A., Rutter G.A., Griffiths E.J. ATP regulation in adult rat cardiomyocytes: time-resolved decoding of rapid mitochondrial calcium spiking imaged with targeted photoproteins. J. Biol. Chem. 2006;281:28058–28067. doi: 10.1074/jbc.M604540200. - DOI - PubMed
    1. Bell D., McDermott B.J. Inhibition by verapamil and diltiazem of agonist-stimulated contractile responses in mammalian ventricular cardiomyocytes. J. Mol. Cell Cardiol. 1995;27:1977–1987. doi: 10.1016/0022-2828(95)90019-5. - DOI - PubMed