. 2021 Dec 16;25(1):103644.
doi: 10.1016/j.isci.2021.103644. eCollection 2022 Jan 21.

Gut Ruminococcaceae levels at baseline correlate with risk of antibiotic-associated diarrhea

Affiliations

Gut Ruminococcaceae levels at baseline correlate with risk of antibiotic-associated diarrhea

Xiaoqiong Gu et al. iScience. .

Abstract

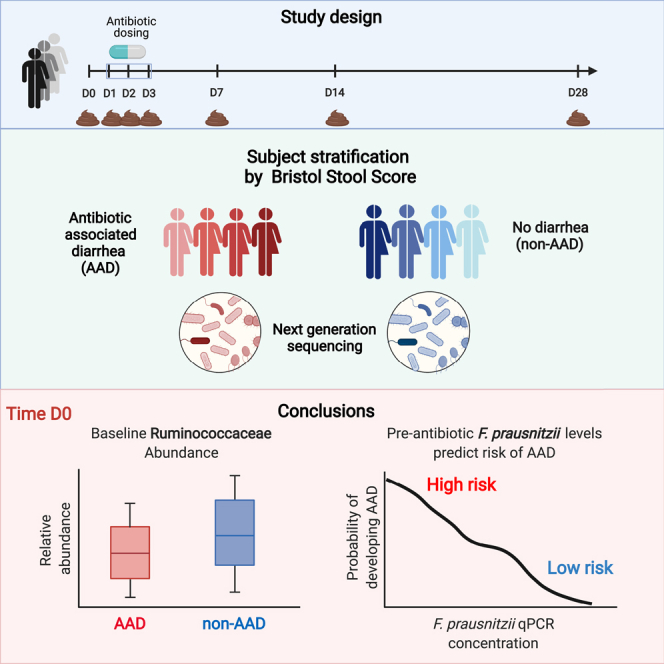
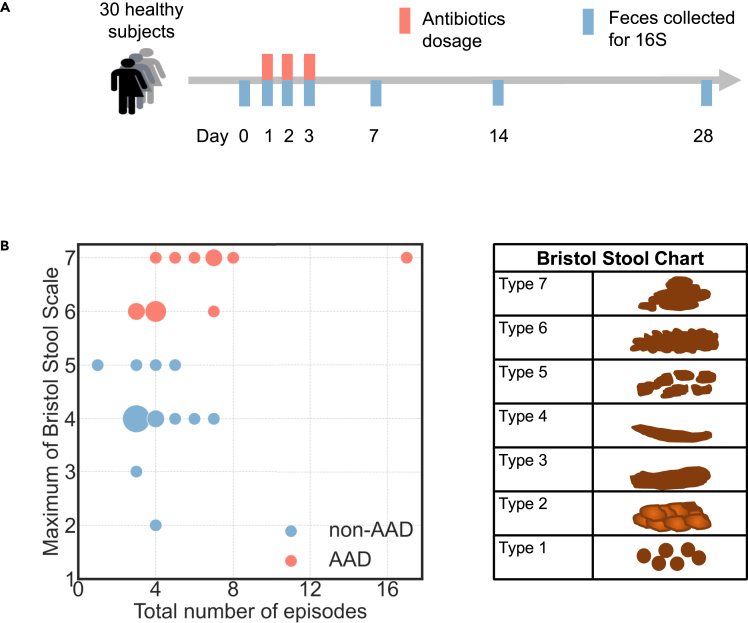
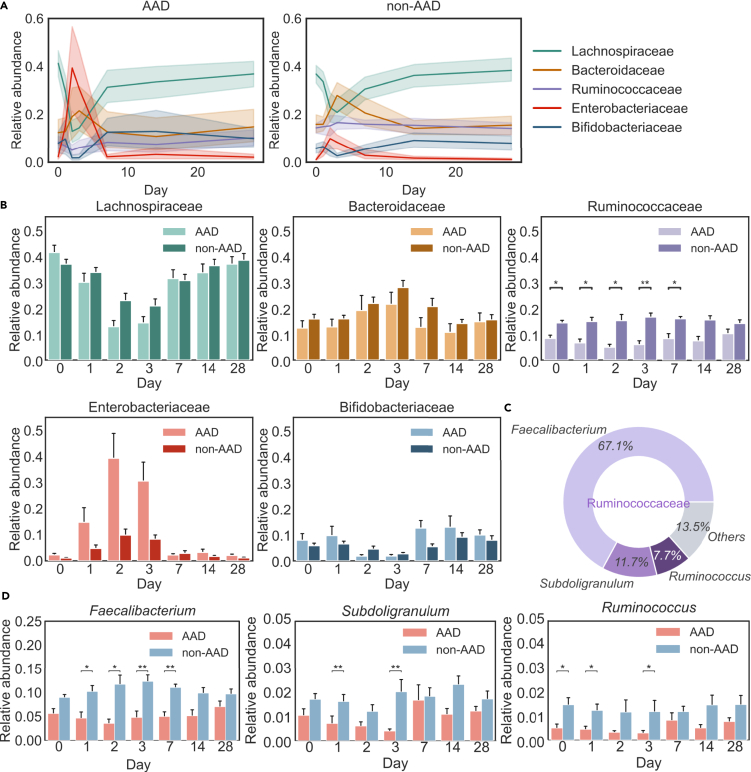
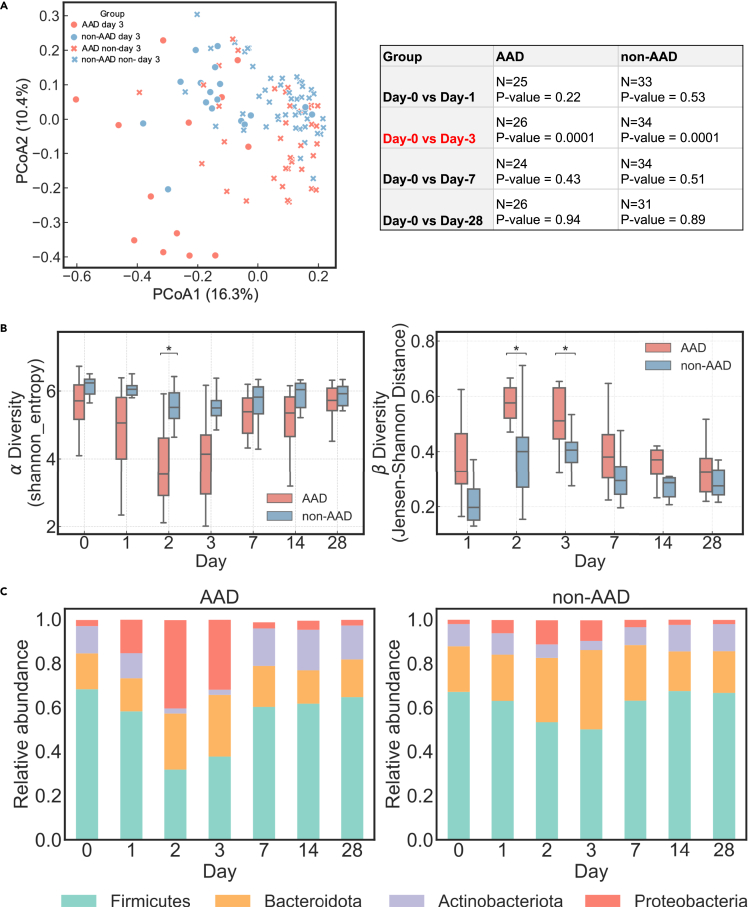
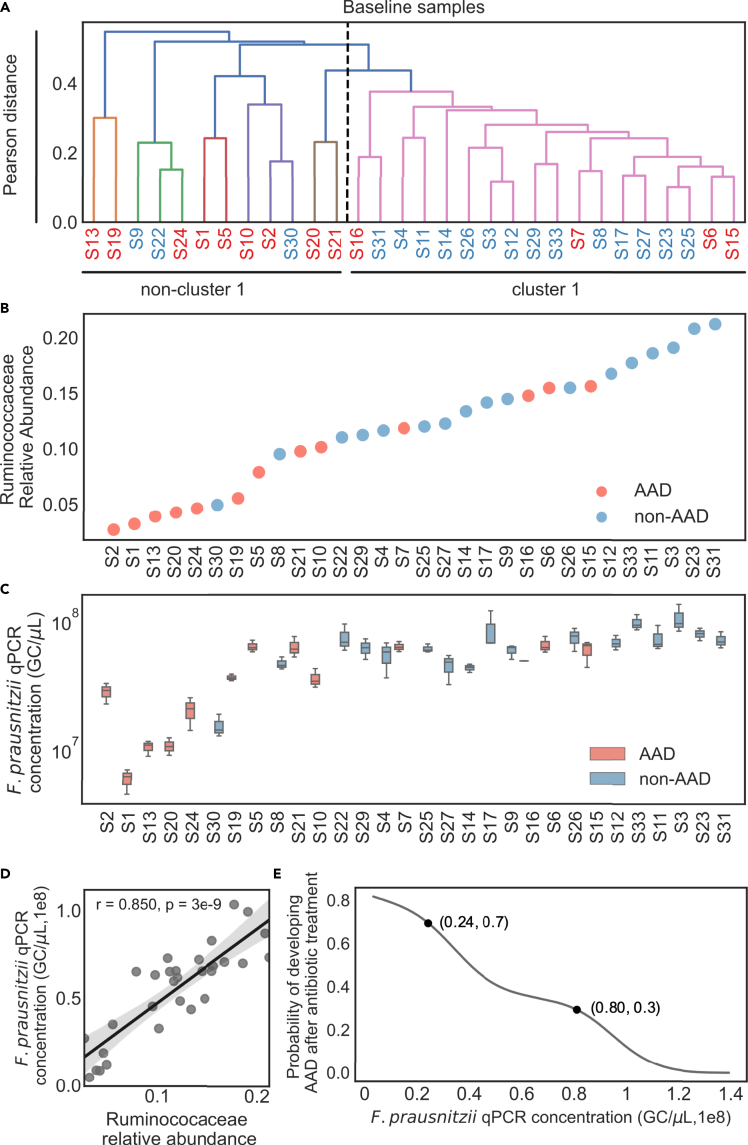
Antibiotic-associated diarrhea (AAD) affects a significant proportion of patients receiving antibiotics. We sought to understand if differences in the gut microbiome would influence the development of AAD. We administered a 3-day course of amoxicillin-clavulanate to 30 healthy adult volunteers, and analyzed their stool microbiome, using 16S rRNA gene sequencing, at baseline and up to 4 weeks post antibiotic administration. Lower levels of gut Ruminococcaceae were significantly and consistently observed from baseline until day 7 in participants who developed AAD. Overall, participants who developed AAD experienced a greater decrease in microbial diversity. The probability of AAD could be predicted based on qPCR-derived levels of Faecalibacterium prausnitzii at baseline. Our findings suggest that a lack of gut Ruminococcaceae influences development of AAD. Quantification of F. prausnitzii in stool prior to antibiotic administration may help identify patients at risk of AAD, and aid clinicians in devising individualized treatment regimens to minimize such adverse effects.

Keywords: Health sciences; Microbiome; Pathophysiology.


Conflict of interest statement

Eric J Alm is co-founder of Finch Therapeutics, a microbiome-based therapeutics company. All other authors have no conflicts of interests to declare.

Figures

None
Graphical abstract
Figure 1
Figure 1
AAD vs non-AAD classification across the duration of the study (A) Study design of 30 healthy adult volunteers administered amoxicillin-clavulanate with paired fecal sampling. (B) The segregation of AAD and non-AAD groups according to the maximum Bristol Stool Scale on either day 1, 2 or 3 of antibiotic treatment. The total number of episodes indicates the number of episodes across day 1–3.
Figure 2
Figure 2
Ruminococcaceae differentiates the AAD and non-AAD groups across the duration of the study (A) Profound community changes were found in the AAD group compared with the non-AAD group at the family level. Solid lines represent the mean; color shadings represent 95% confidence intervals. (B) Dynamics of 5 most abundant families across the duration of the study between the AAD and non-AAD groups (Bonferroni-corrected, two-sided Mann-Whitney U test, p ≤ 0 ·05, ∗; p ≤ 0 · 01, ∗∗). Error bars represent 68% confidence intervals. (C) Pie charts of 3 most abundant genera in Ruminococcaceae across the duration of the study. (D) Dynamics of 3 most abundant genera in Ruminococcaceae, Faecalibacterium, Subdoligranulum, and Ruminococcus across the duration of the study between AAD and non-AAD groups (Bonferroni-corrected, two-sided Mann-Whitney U test, p ≤ 0 · 05, ∗; p ≤ 0 · 01, ∗∗). Primer sets used are listed in Table S4 (Caporaso et al., 2011).
Figure 3
Figure 3
Amoxicillin-clavulanate causes greater gut microbiome diversity loss and community disturbance in the AAD group compared with the non-AAD group (A) Principal coordinates analysis (PCoA) based on ASV-level Bray–Curtis dissimilarity. Display is based on sample scores on the primary axis (PCoA1, 16.3% variance explained) and secondary axis (PCoA2, 10.4% variance explained). To reduce the redundancy of sample points on the plot, we picked microbiomes on day 3 to represent the post-dosing period (days 1–3). Days 0, 3, 7, and 28 were included as the datapoints with days 0, 7, and 28 represented simply as “non-day 3”. The greatest variation observed in the AAD group occurs on day 3. Individuals return to their baseline microbiomes from day 7. PERMANOVA results show that there were no significant differences between day 0 and 7 in both AAD (p = 0.43, N = 24) and non-AAD groups (p = 0.51, N = 24). (B) Within-sample species diversity (α diversity of ASVs, Shannon entropy index) greatly decreased in the AAD group compared with the non-AAD group on day 2. The similarity of each individual's gut microbiota to their baseline communities (β diversity of ASVs, Jensen–Shannon distance) greatly decreased in the AAD group compared with the non-AAD group cross days 2–3. Significant difference between the AAD and non-AAD groups are labeled with asterisks (Bonferroni-corrected, two-sided Mann–Whitney U test, p ≤ 0 · 05, ∗; p ≤ 0 · 01, ∗∗). (C) A sharp increase of Proteobacteria, and a decrease of Firmicutes and Actinobacteria were observed in the AAD group on days 2 and 3.
Figure 4
Figure 4
Predicting the risk of AAD based on the relative abundance of Ruminococcaceae at baseline Red and blue labels denote individuals with AAD and non-AAD, respectively. (A) Inter-individual microbial community variation of amplicon sequence variants (ASVs) at baseline. Hierarchical clustering of the baseline fecal bacterial composition of 30 healthy individuals (average linkage, with correlation matrix). The color threshold for signifying clusters was set to a Pearson distance of ‘0 · 4’. Majority (14/17) of non-AAD individuals were grouped into Cluster 1. Majority of AAD individuals (9/13) were excluded from Cluster 1 to form several individual branches. (B) Distribution of Ruminococcaceae relative abundance at baseline among the AAD and non-AAD groups. Each number refers to the individual at baseline. (C) qPCR concentration for the species F. prausnitzii was normalized to 16S rRNA gene copy (Data represent median ± IQR range, n = 3). Each number refers to the individual at baseline. (D) Correlations between Ruminococcaceae relative abundance and F. prausnitzii median absolute quantification (Spearman's ρ = 0 · 850, p = 3·0 × 10−9). Line depicts the best linear fit and blue shading the 95% confidence interval of the linear fit. (E) Calculated predictive precision of developing AAD using F. prausnitzii absolute abundance quantified by qPCR assay. Primer sets used are listed in Table S4 (Carroll et al., 2012; Van Hul et al., 2020).

Similar articles

Cited by

References

    1. Allen S.J., Wareham K., Wang D., Bradley C., Hutchings H., Harris W., Dhar A., Brown H., Foden A., Gravenor M.B., et al. Lactobacilli and bifidobacteria in the prevention of antibiotic-associated diarrhoea and Clostridium difficile diarrhoea in older inpatients (PLACIDE): a randomised, double-blind, placebo-controlled, multicentre trial. Lancet. 2013;382:1249–1257. - PubMed
    1. Antharam V.C., Li E.C., Ishmael A., Sharma A., Mai V., Rand K.H., Wang G.P. Intestinal dysbiosis and depletion of butyrogenic bacteria in Clostridium difficile infection and nosocomial diarrhea. J. Clin. Microbiol. 2013;51:2884–2892. - PMC - PubMed
    1. Bajaj J.S., Ridlon J.M., Hylemon P.B., Thacker L.R., Heuman D.M., Smith S., Sikaroodi M., Gillevet P.M. Linkage of gut microbiome with cognition in hepatic encephalopathy. Am. J. Physiol. Gastrointest. Liver Physiol. 2012;302:G168–G175. - PMC - PubMed
    1. Bartlett J.G. Antibiotic-associated diarrhea. Clin. Infect. Dis. 2015;18:349–351. - PubMed
    1. Beaugerie L., Petit J.C. Antibiotic-associated diarrhoea. Best Pract. Res. Clin. Gastroenterol. 2004;18:337–352. - PubMed

LinkOut - more resources