Review
. 2021 Dec 20:13:100193.
doi: 10.1016/j.mtbio.2021.100193. eCollection 2022 Jan.

Microfluidic mechanoporation for cellular delivery and analysis

Affiliations
Review

Microfluidic mechanoporation for cellular delivery and analysis

Pulasta Chakrabarty et al. Mater Today Bio. .

Abstract

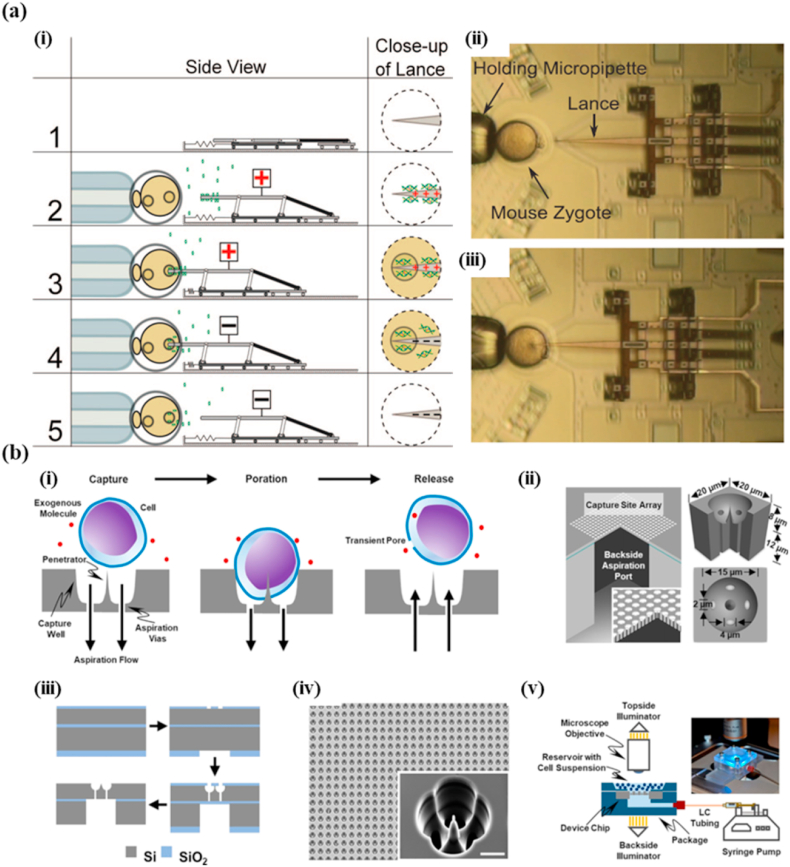
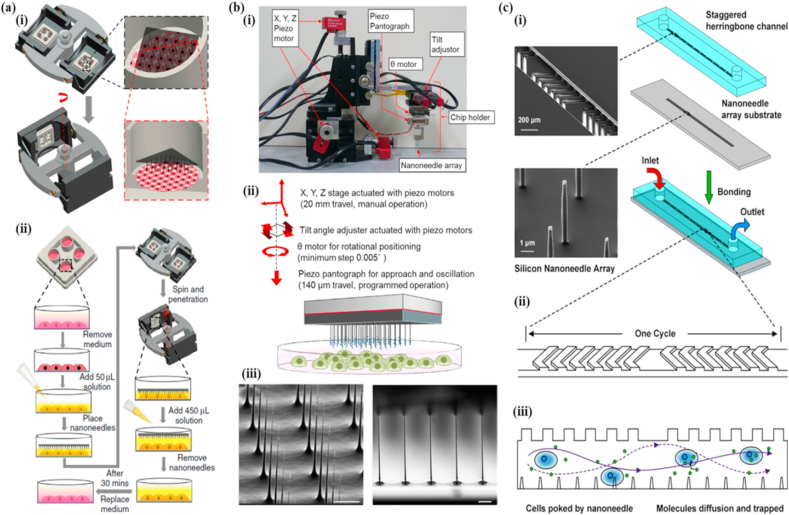
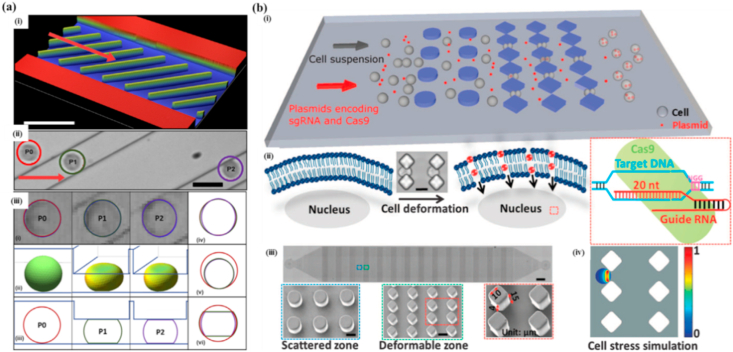
Highly efficient intracellular delivery strategies are essential for developing therapeutic, diagnostic, biological, and various biomedical applications. The recent advancement of micro/nanotechnology has focused numerous researches towards developing microfluidic device-based strategies due to the associated high throughput delivery, cost-effectiveness, robustness, and biocompatible nature. The delivery strategies can be carrier-mediated or membrane disruption-based, where membrane disruption methods find popularity due to reduced toxicity, enhanced delivery efficiency, and cell viability. Among all of the membrane disruption techniques, the mechanoporation strategies are advantageous because of no external energy source required for membrane deformation, thereby achieving high delivery efficiencies and increased cell viability into different cell types with negligible toxicity. The past two decades have consequently seen a tremendous boost in mechanoporation-based research for intracellular delivery and cellular analysis. This article provides a brief review of the most recent developments on microfluidic-based mechanoporation strategies such as microinjection, nanoneedle arrays, cell-squeezing, and hydroporation techniques with their working principle, device fabrication, cellular delivery, and analysis. Moreover, a brief discussion of the different mechanoporation strategies integrated with other delivery methods has also been provided. Finally, the advantages, limitations, and future prospects of this technique are discussed compared to other intracellular delivery techniques.

Keywords: Cell viability; Cellular delivery; Mechanoporation; Microfluidics; Transfection efficiency.


Conflict of interest statement

The authors declare the following financial interests/personal relationships which may be considered as potential competing interests: Tuhin Subhra Santra reports financial support was provided by the DBT/Wellcome Trust India Alliance Fellowship.

Figures

Image 1
Graphical abstract
Fig. 1
Fig. 1
Historical development of microfluidic mechanoporation
Fig. 2
Fig. 2
(a) PDMS-based microinjection device. (i) Fluid stream moves the cell towards fixed needle (V1 open, V2 closed) (ii) Cell piercing by impinging on microneedle. (iii) Cell lift from needle and transport to collection reservoir due to reversed fluid stream (V1 closed, V2 open). (iv) Microscopic image of the device. (v) Focused image of the nanoneedle area where microinjection takes place. (vi) Image of the final device. Reprint with permission from The Royal Society of Chemistry [36]. (b) Vacuum-based cell immobilization arrays for microinjection. (i) Schematic of the cell immobilization device. (ii) Schematic of microinjection into a single cell using the device. (iii) Schematic of the entire microinjection system. (iv) Differential interference contrast (DIC) image of micropipette injection into a mouse zygote. (v) Development of mouse zygotes into blastocysts after robotic injection. Reprint with permission from Springer [37].
Fig. 3
Fig. 3
(a) Metamorphic nanoinjector device. (i) DNA nanoinjection steps. Step 1: Nanoinjector at rest before any injection process. Step 2: Lance elevation and DNA accumulation on lance tip due to applied positive charge. Step 3: Cell penetration by the movement of the lance at a constant elevation. Step 4: DNA release into the cell due to applied negative charge. Step 5: Lance's movement at a constant height out of the cell. Optical microscopy image (top view) (ii) before and after (iii) nanoinjection of a mouse zygote. Reprint with permission from AIP Publishing LLC [48]. (b) UHT microinjection device. (i) Schematic of the UHT microinjection concept showing cell capture, poration, and release. (ii) Illustration of a single DMP device design (isometric view with a quarter section removed). (iii) Illustration of device fabrication on a silicon-on-insulator substrate. (iv) Scanning Electron Microscopy (SEM) image of a device portion with an inset displaying a single capture site with higher magnification (Scale bar ​= ​5 ​μm). (v) Schematic of device chip packaging, placing it upon a fluorescence microscope stage and connecting it to a controllable syringe pump for manipulating the fluid in the aspiration circuit (a photograph of the final device is shown in the inset). Reprint with permission from the American Chemical Society [105].
Fig. 4
Fig. 4
High throughput automated microinjection device for small adherent cells. (a) Schematic of cell injection system with the injection module, control module, and vision module integrated. (b) Schematic of cell holder: (i) Thin layer. (ii) Thick layer. (iii) 2-layer stacked structure (front view). (iv) Overall design of the microfluidic chip. (c) 3-D view indicating flow direction when negative pressure is applied to the cell holder. Reprint with permission from IEEE [55].
Fig. 5
Fig. 5
Schematic of different intracellular delivery approaches using microneedle arrays. (a) Hollow microneedles. (b) Solid microneedles. (c) Coated microneedles. (d) Dissolvable microneedles. (e) Porous microneedles. Reprint with permission from Springer [86].
Fig. 6
Fig. 6
(a) In-plane hollow microneedle array integrated with PDMS microfluidic chip. (i) SEM image of microneedles. (ii) Image of the microneedle array integrated with the PDMS chip. (iii) Rhodamine B injection using the device. (iv) Image showing successful injection. Reprint with permission from Elsevier [56]. (b) Schematic of hollow microneedle array with a PDMS syringe, demonstrating delivery into the skin. Reprint with permission from Springer Nature [57]. (c) SLA-based 3D-printed microneedle array device. (i) Schematic of experimental setup, showing the inlets and the 3D chamber integrated with hollow microneedle array. Inset shows the 3 inlets and confocal scanning laser microscope (CLSM) image after delivery to porcine skin. (ii) Optical image of the printed device. Inset shows zoomed in view of the (iii) inlet, showing solution mixing from the three streams, (iv) hollow microneedle array. Reprint with permission from AIP Publishing [58].
Fig. 7
Fig. 7
(a) Vertical nanowires. (i) SEM image of nanowires fabricated by (i) chemical vapor deposition, and (ii) reactive ion etching (Scale bar ​= ​1 ​μm). Schematic of a cell (iii) before, and (iv) after penetration by nanowire. (v) SEM image of rat hippocampal neurons (false colored yellow) on a Si nanowire array (false colored blue) after 1 day (Scale bar ​= ​10 ​μm). Reprint with permission from PNAS [97]. (b) Schematic of nanostraws device (not drawn to scale) with microscopy image of the nanostraws. Reprint with permission from The Royal Society of Chemistry [130].
Fig. 8
Fig. 8
(a) Solid nanoneedle array device employing centrifugation-induced supergravity. (i) Device schematic showing basic design and operating principle. (ii) Workflow of the delivery procedure using the nanoneedle array device. Reprint with permission from Macmillan Publishers Limited [59]. (b) Oscillating nanoneedle array device. (i) Picture of the nanoneedle array manipulator. (ii) Schematic representation of the different actuation methods possible using the manipulator. (iii) SEM image of nanoneedle arrays. Reprint with permission from Scientific Reports Nature [60]. (c) Solid nanoneedle array device with a staggered herringbone channel. (i) Two-layered device with staggered herringbone channel and a nanoneedle array substrate fabricated independently and then bonded together. (ii) One-cycle of the PDMS channel. (iii) Working principle of motion inside the channel and subsequent cargo delivery by nanopore generation. The asymmetric grooving induced two spinning flow lines and promoted chaotic mixing in the channel (indicated by the purple line. Reprint with permission from Bentham Science Publishers [38].
Fig. 9
Fig. 9
Cell squeezing (SQZ) device. (a) (i) Illustration of device methodology for transient cell membrane disruption when passed through micro constrictions. (ii) Zoomed-in image of the finished device showing parallel constrictions. (iii) Image explaining delivery procedure from inlet to outlet reservoir through the chip. (b) Delivery efficiency and cell viability of (i) NuFFs, (ii) primary murine dendritic cells (iii) embryonic stem cells, demonstrating 3-kDa and 70-kDa dextran delivery, measured by flow cytometry. (iv) Delivery efficiency and cell viability of Hela cells demonstrating 3-kDa and CNT delivery. Reprint with permission from PNAS [40].
Fig. 10
Fig. 10
Cell squeezing devices. (a) Illustration of cell flow and compression. (i) Microfluidic device with diagonal ridges. The red arrow indicates the direction of cell flow. (ii) A single cell at multiple positions (P1, P2, and P3), passing through the channel. (iii) (i) Top view corresponding to P1, P2, and P3. (ii) 3-D representation of cell flow before entering the ridge (P1) and during compression in the ridge (P2, P3). (iii) Side view corresponding to P1, P2, and P3. (iv) Top view. (v) Spherical projection of the cell. (vi) Side view. Reprint with permission from Elsevier [41]. (b) (i) Deformation of cells when passed through microconstrictions. (ii) Illustration of cell deformation, transient hole generation, when passed through microconstrictions, and genome editing (Scale bar ​= ​15 ​mm). (iii) Microscope image of the device (Scale bar ​= ​0.5 ​mm), SEM image of the scattered and deformable zones (Scale bar ​= ​15 ​mm), Image of single microconstriction of 15 ​mm in depth, 4 ​mm width, 10 ​mm length. (iv) Cell stress simulation when passing through a microconstriction and subsequent stress gradient on cell. Reprint with permission from the American Association for the Advancement of Science [42].
Fig. 11
Fig. 11
Cell squeezing devices. (a) Cell squeezing using double deformation device. (i) Microscope image of the device (Scale bar ​= ​100 ​μm) with a zoomed view (Scale bar ​= ​5 ​mm). (ii) SEM image of single deformation device (Scale bar ​= ​20 ​μm). (iii) SEM image of double deformation device (Scale bar ​= ​20 ​μm). (iv) Schematic and bright field imaging of cell squeezing for the two processes. Reprint with permission from WILEY-VCH Verlag GmbH & Co [43]. (b) Cell squeezing using 2-D point constrictions. (i) Illustration of intracellular delivery using the microfluidic platform. The inset is a micrograph showing a zoomed-in section of the device without the cover glass (Scale bar ​= ​20 ​μm). (ii) Illustration of a single cell passing through the constrictions and undergoing deformation in two dimensions. (iii) 3-D illustration of cell deformation and delivery when passing through the channel. Reprint with permission from the American Chemical Society [44].
Fig. 12
Fig. 12
Exosome nanoporator (ENP) device. (a) Schematic of the ENP device. (b) Working principle of the device demonstrating cargo loading into exosomes after being subjected to mechanical compression and fluid shear in the nanochannel. The channel dimensions are represented. Reprint with permission from WILEY-VCH Verlag GmbH & Co [45].
Fig. 13
Fig. 13
(a) Schematic of microfluidic jet injection. Reprint with permission from IOP Publishing Ltd [46]. (b) Inertial microfluidic cell hydroporator (iMCH). (i) Schematic of the working mechanism of the proposed device. The device is capable of delivering a wide range of materials into the cell. (ii) Cells colliding onto a sharp tip at the T-junction present on the channel wall were captured using a high-speed microscope. Reprint with permission from the American Chemical Society [47].
Fig. 14
Fig. 14
(a) (i) Schematic and illustration of the proposed device and delivery methodology. (ii) Illustration of cell stretching, transient pore generation, biomolecular delivery, and resealing. Reprint with permission from The Royal Society of Chemistry [50]. (b) Droplet squeezing platform. (i) Schematic of the microfluidic device. (ii) Illustration of delivery process along with high-speed microscope images, showing (1) encapsulation, (2) deformation, and (3) restoration. (iii) Single-cell encapsulated monodispersed droplets (cells indicated by red arrow). (iv) Illustration of droplet squeezing and cargo delivery by convection-based transport. (v) Bright-field and fluorescence images of endocytosis and droplet squeezing-mediated uptake of 3–5 ​kDa FITC-dextran into K562 ​cells after 18 ​h (Scale bar ​= ​50 ​μm). Reprint with permission from the American Chemical Society [53].
Fig. 15
Fig. 15
(a) Hydroporation device employing spiral vortex flow. (i) Schematic of spiral flow at cross-junction. (ii) (1) Illustration of cell deformation using a spiral vortex. (2) Cell rotation at cross-junction captured using high-speed microscopy. (iii) Device design using computer-aided design (CAD). (iv) Cell deformation using hydrodynamic forces at the Cross junction and T-junction. (v) Illustration of nanomaterial delivery into the cell. Reprint with permission from the American Chemical Society [51]. (b) μVS device. (i) Schematic of the μVS-based delivery system (not to scale). (ii) Photographic image of the microfluidic chip. (iii) Image of microfluidic channel showing the flow direction, post dimensions, and post spacing (captured using SEM). (iv) Image of assorted hardware used to push cel, mRNA suspension through the chip. Reprint with permission from Scientific Reports Nature [52].
Fig. 16
Fig. 16
(a) Electro-injection of fluorescein into GUV. (i) DIC image showing two adjacent unilamellar vesicles on the coverslip surface and two multilamellar liposomes. (ii) An applied mechanical force, changing the vesicle into a kidney-like shape by moving the injection tip on the vesicle and towards the microelectrode. (iii) Membrane permeabilization due to the applied electric field, consequent tip insertion fluorescein injection into the vesicle. (iv) The removal of injection tip and counter electrode from the vesicle. (v) Fluorescence image of an injected vesicle. Reprint with permission from the American Chemical Society [72]. (b) Double-barrel nanopipette. (i) Schematic of cell surface detection and subsequent injection using the double-barrel nanopipette. (ii) SEM image of the nanopipette. (iii) Normalized fluorescence intensity after injection. Reprint with permission from The Royal Society of Chemistry [73]. (c) DFE delivery device. (i) Schematic of device operation. a. Squeezing of cells as they pass through constriction channels. b. Cells being subjected to electric pulses that drive DNA into the cytoplasm and nucleus through the disrupted membrane. (ii) Magnified image of the DFE device. a. Identical and parallel constriction channels on a Si wafer for cell squeezing. b. Microelectrodes on a pyrex wafer for electroporation. (iii) Final device obtained by joining the Si and pyrex wafer. Reprint with permission from Springer Nature [74].
Fig. 17
Fig. 17
Schematic of the magnetic nanospear-mediated delivery device. (a) Schematic of Si/Ni/Au nanospear encapsulated with eGFP-expression plasmid magnetically guided and inserted into a target cell. (b) Illustration of multiple nanospears for high-throughput transfection. (c) SEM image of nanospear arrays. (d) Image showing controlled trajectory of a single nanospear and targeted intracellular delivery (Scale bar ​= ​10 ​μm). (e) GFP expression by target U87 ​cell were obtained using fluorescence microscopy 24 ​h after treatment (Scale bar ​= ​10 ​μm). (f) SEM image of nanospears inside a target cell (Scale bar ​= ​10 ​μm). (g) False colored, magnified SEM image of nanospears inside a target cell. Reprint with permission from the American Chemical Society [75].
Fig. 18
Fig. 18
(a) Photothermal nanoblade. (i) The different stages describing the mechanism for membrane cutting and cargo delivery. (ii) SEM image of the Ti-coated glass microcapillary pipette (The arrowhead is directed towards the glass filament edge, which is present inside the micropipette). Reprint with permission from the American Chemical Society [77]. (b) Nanostraw electroporation device. (i) Schematic of the device. (ii) Schematic of biomolecular delivery by field localization at the nanostraw tip. (iii) SEM image of nanostraws (diameter ​= ​250 ​nm, array density ​= ​0.2 straws/μm2). (iv) SEM image of cells cultured on the nanostraws membrane. Reprint with permission from the American Chemical Society [78].
Fig. 19
Fig. 19
(a) Nanostraw optoporation device. (i) Illustration of the delivery method using plasmonic nanotube. a. Excitation of nanotube by a laser pulse. b. Generation of transient nanopores by pressure waves. c. Intracellular biomolecule delivery through the nanopores. d. Closing down of nanopores. (ii) SEM images of a. 3 ​× ​3 nanopillars array. b. NIH3T3 cells culture upon the nanotube array. Reprint with permission from WILEY-VCH Verlag GmbH & Co [80]. (b) T-NEA device. (i) Illustration of the experimental setup and siRNA delivery into suspended cell types. (ii) SEM image of the Cu-nanoarrays (length ​∼ ​5 ​μm, diameter <50 ​nm, density ​∼ ​10 nanowires/μm2). (iii) Photograph of the T-NEA device. (iv) Open circuit voltage induced by human tapping motion on the TENG. (v) Electric field distribution simulation at a single CuO-nanowire tip. Reprint with permission from Elsevier [79].

Similar articles

Cited by

References

    1. Stewart M.P., Sharei A., Ding X., Sahay G., Langer R., Jensen K.F. In vitro and ex vivo strategies for intracellular delivery. Nature. 2016;538:183–192. doi: 10.1038/nature19764. - DOI - PubMed
    1. Brooks J., Minnick G., Mukherjee P., Jaberi A., Chang L., Espinosa H.D., Yang R. High throughput and highly controllable methods for in vitro intracellular delivery. Small. 2020:1–20. doi: 10.1002/smll.202004917. 2004917. - DOI - PMC - PubMed
    1. Rusk N. Seamless delivery. Nat. Methods. 2011;8 doi: 10.1038/nmeth.f.331. 44–44. - DOI
    1. Liu J., Fraire J.C., De Smedt S.C., Xiong R., Braeckmans K. Intracellular labeling with extrinsic probes : delivery strategies and applications. Small. 2020:1–25. doi: 10.1002/smll.202000146. 2000146. - DOI - PubMed
    1. Stewart M.P., Langer R., Jensen K.F. Intracellular delivery by membrane disruption: mechanisms, strategies, and concepts. Chem. Rev. 2018;118:7409–7531. doi: 10.1021/acs.chemrev.7b00678. - DOI - PMC - PubMed

Further reading

    1. Zhang Y., LeBlanc A.C. Apoptosis Tech. Protoc. Humana Press; New Jersey: 2002. Microinjections to study the specific role of proapoptotic proteins in neurons. pp. 083–106. - DOI