. 2021 Sep;1(9):850-863.
doi: 10.1038/s43587-021-00110-x. Epub 2021 Sep 14.

Dysregulation of mitochondrial and proteolysosomal genes in Parkinson's disease myeloid cells

Affiliations

Dysregulation of mitochondrial and proteolysosomal genes in Parkinson's disease myeloid cells

Elisa Navarro et al. Nat Aging. 2021 Sep.

Abstract

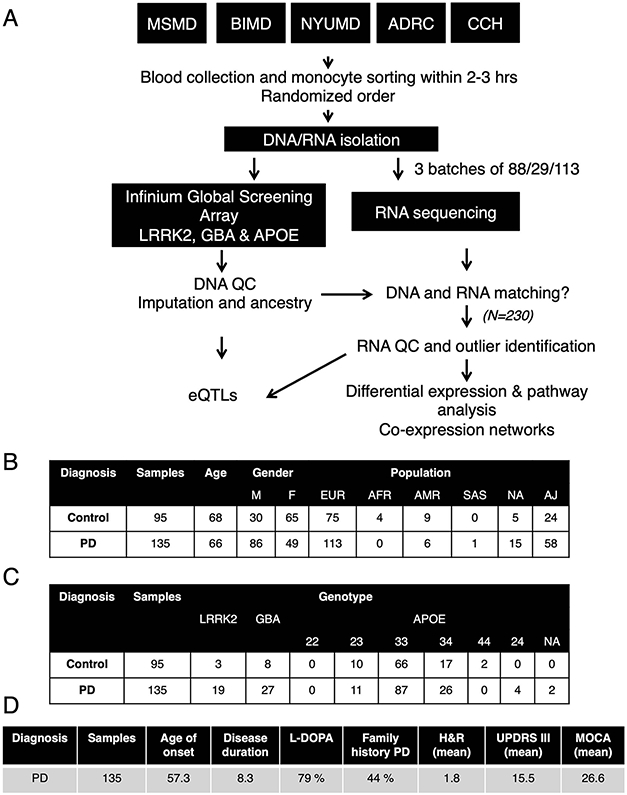
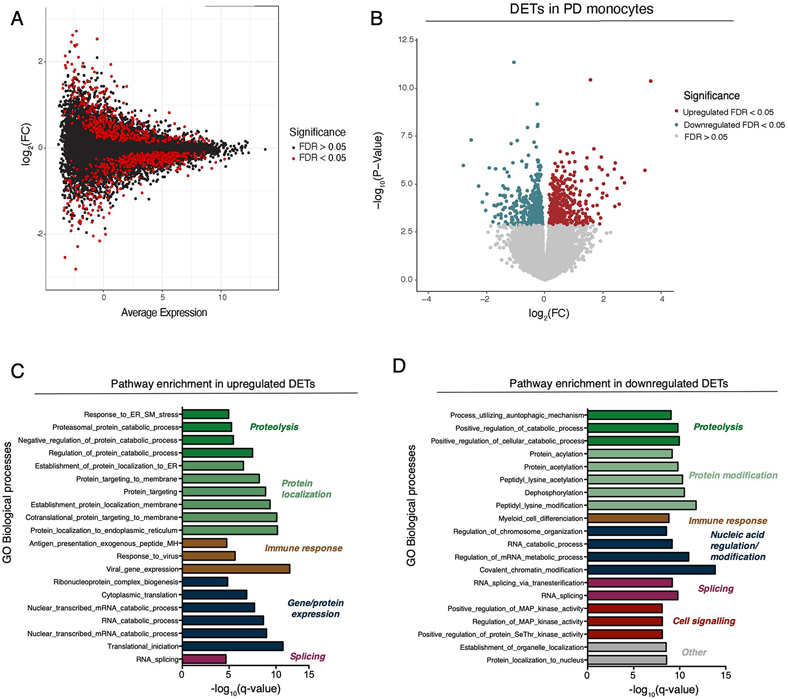
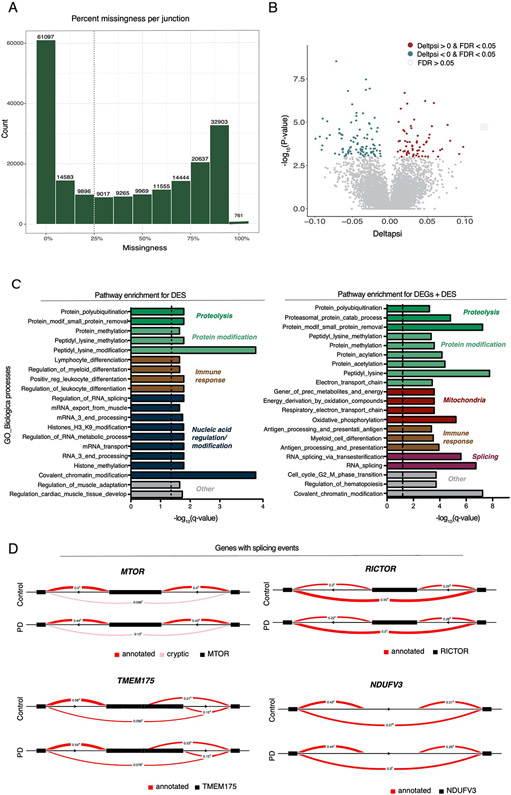
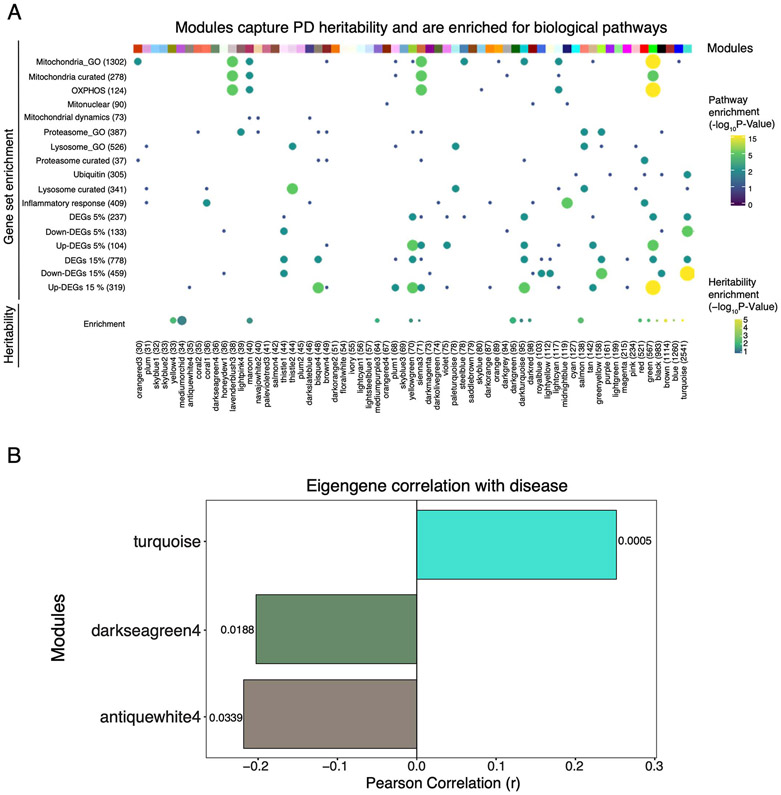
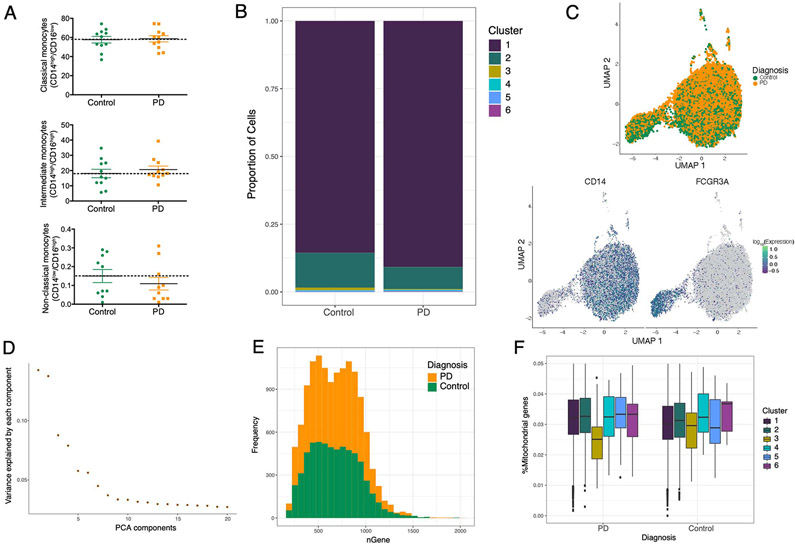
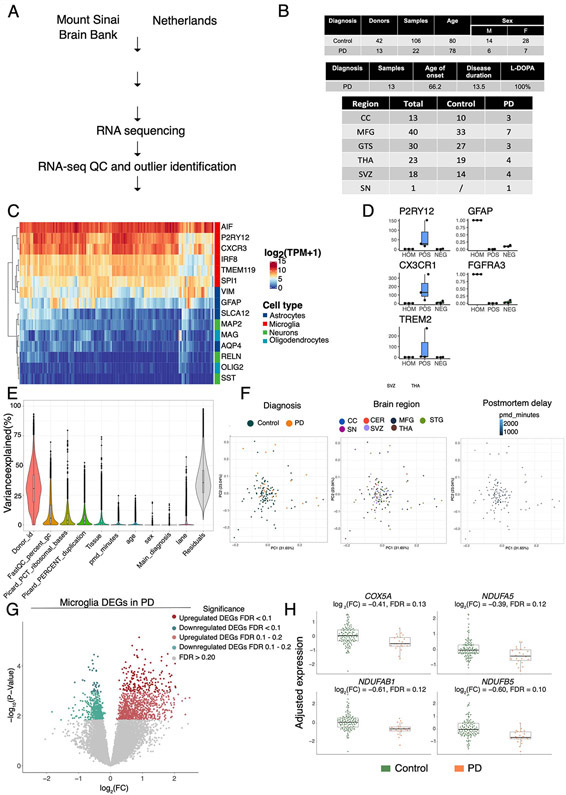
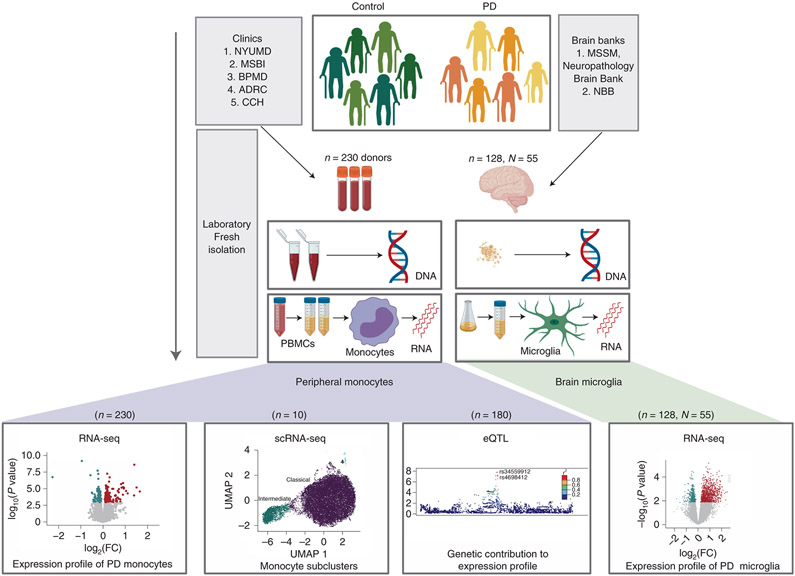
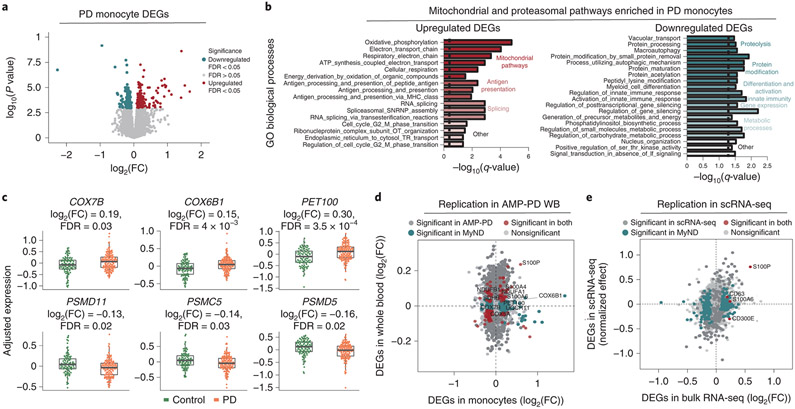
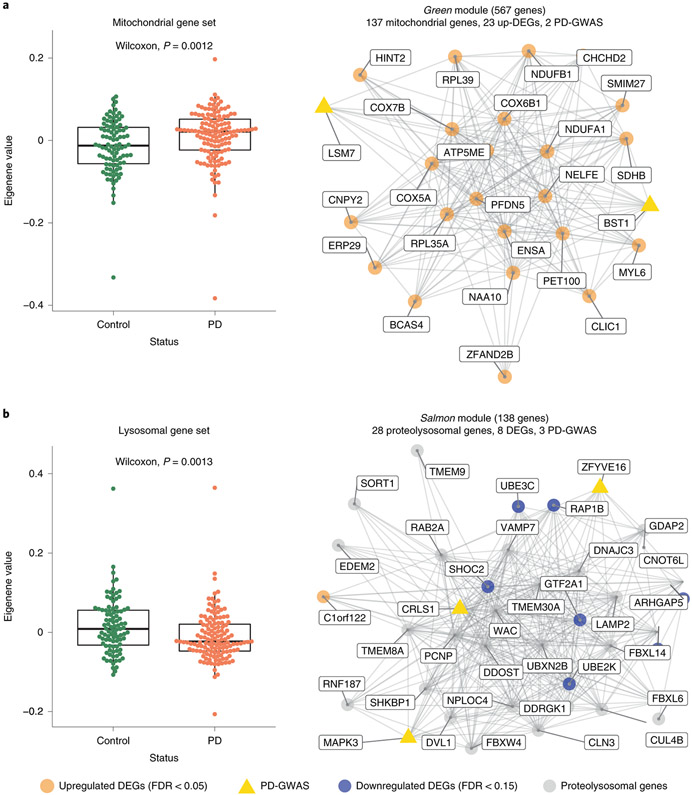
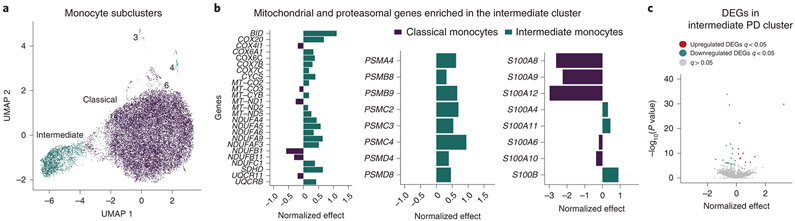
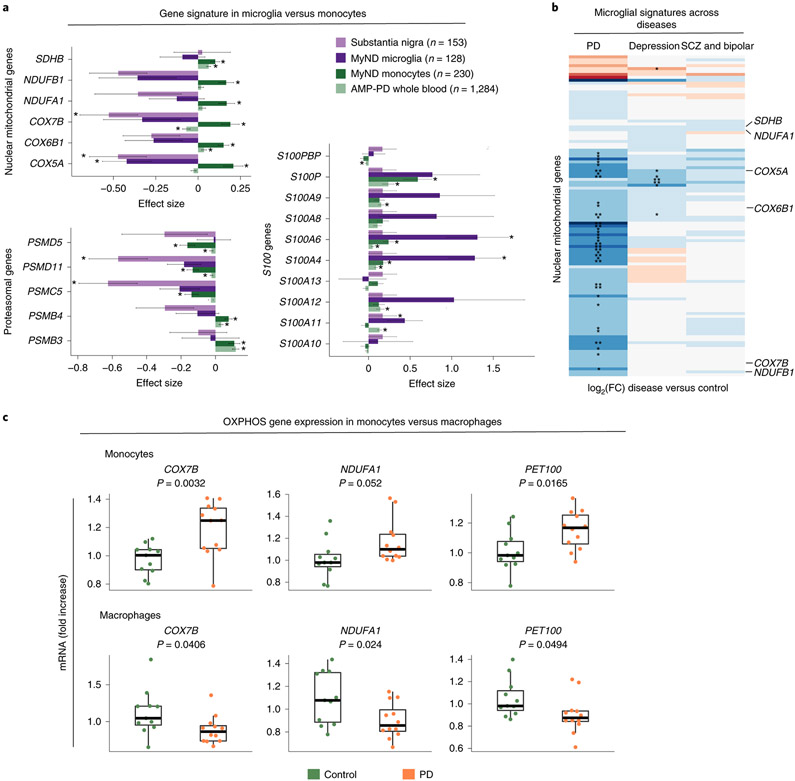
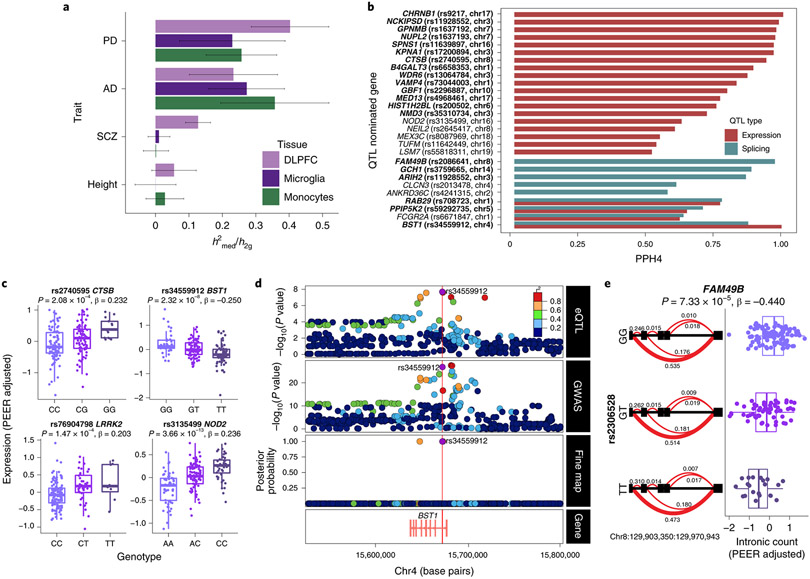
An increasing number of identified Parkinson's disease (PD) risk loci contain genes highly expressed in innate immune cells, yet their role in pathology is not understood. We hypothesize that PD susceptibility genes modulate disease risk by influencing gene expression within immune cells. To address this, we have generated transcriptomic profiles of monocytes from 230 individuals with sporadic PD and healthy subjects. We observed a dysregulation of mitochondrial and proteasomal pathways. We also generated transcriptomic profiles of primary microglia from brains of 55 subjects and observed discordant transcriptomic signatures of mitochondrial genes in PD monocytes and microglia. We further identified 17 PD susceptibility genes whose expression, relative to each risk allele, is altered in monocytes. These findings reveal widespread transcriptomic alterations in PD monocytes, with some being distinct from microglia, and facilitate efforts to understand the roles of myeloid cells in PD as well as the development of biomarkers.


Figures

Extended Data Fig. 1
Extended Data Fig. 1. Experimental flow outline and demographic/clinical information for subjects for monocytes isolation
(A) Blood was collected from five independent clinics across New York City (ADRC, CCH, MSMD, BIMD, and NYUMD; details described in Methods) and transferred to the Icahn School of Medicine at Mount Sinai for monocyte sorting and RNA/DNA isolation. Samples were genotyped for common SNPs using Global Screening Array (GSA) and LRRK2, GBA and APOE were independently genotyped. RNA-seq was performed at Genewiz Inc. in three independent and randomized batches. DNA and RNA data was subjected to stringent QC, DNA data was imputed and ancestry was calculated. DNA and RNA were compared to the identification of miss-matches prior outlier identification. After QC, a total of 230 samples were used for subsequent analysis. (B) Demographic, (C) genotype and (D) clinical variables describing the 230 samples included in the study.
Extended Data Fig. 2
Extended Data Fig. 2. Differential expression analysis at the transcript level in PD and controls derived monocytes.
(A) MA plot showing the fold-change (log2 scale) at the transcript level in the y-axis and the mean of log2counts (x-axis), highlighting the DETs at FDR < 0.05 in red. (B) Volcano plot showing the fold-change (log2 scale) of transcripts between PD-monocytes (n = 135) and controls (n = 95) (x-axis) and their significance in the y-axis −log10 P-value scale). DETs at FDR < 0.05 are highlighted in red (upregulated) and blue (downregulated). Moderated t-statistic (two sided) is used for statistical test (see R package limma). (C) Pathway enrichment analysis for the upregulated (n=230 independent samples) and (D) downregulated DETs using Biological processes from GSEA. Significance is represented in the x-axis (−log10 P-value scale of the q-value). Only the 20 most significant pathways (q-value < 0.05) with a minimum overlap of 5 genes are shown. Pathways are grouped and colored by biological related processes. n=230 independent samples
Extended Data Fig. 3
Extended Data Fig. 3. Differential expression analysis at the splicing level in PD and controls derived monocytes
(A) Histogram reflecting the counts (y-axis) and the % of missingness (x-axis). (B) Volcano plot showing the delta PSI of genes with splicing events in PD-monocytes (n = 135) and controls (n = 95) (x-axis) and their significance in the y-axis (−log10 P-value scale). DSs at FDR < 0.05 are highlighted in red (delta PSI > 0) and blue (delta PSI < 0). Positive delta-PSI indicates that the long isoform is favored whereas negative delta-PSI indicates preference for the short isoform. Chi-squared is used for statistical test (C) Pathway enrichment analysis for the DSs at FDR < 0.0.5 (left panel) DSs + DEGs at FDR < 0.05 (right panel) using Biological processes from GSEA. Significance is represented in the x-axis (−log10 P-value scale of the q-value). Only the 20 most significant pathways (q-value < 0.05) with a minimum overlap of 5 genes are shown. Pathways are grouped and colored by biological related processes. n=230 independent samples. (D) Examples of genes showing significant splicing events.
Extended Data Fig. 4
Extended Data Fig. 4. Module enrichment for biological pathways
(A) Enrichment of modules (x-axis) containing co-expressed genes for specific biological pathways and curated gene sets (y-axis). Modules are represented by color names and are ordered by size. Enrichment for selected gene sets and GO biological processes (top panel). The size and color of the circles indicate the significance level (−log10 P-value). Enrichments for PD heritability, using stratified LD score regression (bottom panel). The size and color of circles indicate the enrichment value (from LD score) and significance level (−log10 P-value) of enrichment, respectively. Only modules that were significant at a nominal P-value < 0.05 are shown here. (B) Barchart showing Pearson correlation coefficient (r) (x-axis) of three modules (y-axis) significantly associated with PD (FDR < 0.05) determined by the module eigengene analysis. Numbers on the plot represent adjusted P-values, Two-sided Wilcoxon rank-signed test. n=230 independent samples.
Extended Data Fig. 5
Extended Data Fig. 5. Monocyte subcluster characterization by single-cell analysis
(A) Proportions of the 3 main monocyte sub-clusters using FACS (n = 11 controls and 11 PD). No statistical differences were obtained between groups. (B) Cell proportions of the 6 sub-clusters obtained by unsupervised clustering with monocle3 in scRNA-seq (n = 3 controls and 7 PD). No statistical differences were obtained between cases and controls in cell proportions. Cluster 1 corresponds to classical monocytes and cluster 2 to intermediate monocytes. (C) Top: UMAP colored by diagnosis (green = controls, yellow = PD). Bottom: UMAP colored by CD14 and FCGR3A (CD16) marker genes expression. (D) Histogram showing the variance (y-axis) explained by the 20 first PCA components (x-axis). (E) Histogram showing the frequency of the genes colored by diagnosis (green = control, yellow = PD). (F) Expression of mitochondrial genes by each cluster and divided by diagnosis. Boxplots: the line represents the median. The boxes extend from the 25th - 75th percentile and the lines extend 1.5 times the interquartile range. n=10 independent donors.
Extended Data Fig. 6
Extended Data Fig. 6. Fresh microglia transcriptome analysis
Microglia transcriptomic profiling was performed from 22 samples from 13 PD donors and 106 samples from 42 control donors. (A) Experimental workflow for the generation of human microglial transcriptomic profiles (B) Tables describing the samples included in the study (top: demographic information, middle: clinical information, bottom: brain regions). CC: Corpus Callosum; MFG: medial frontal gyrus; STG: Superior temporal gyrus; THA: thalamus; SVZ: subventricular zone; SN: substantia nigra (C) Heatmap for the expression of marker genes of different brain cell types (red: microglia, dark blue: astrocytes, green: neurons, light blue: oligodendrocytes). (D) Microglial isolation purity assessed by qPCR comparing the brain homogenate, and the positive and negative fractions after CD11b magnetic beads comparing microglial markers (P2RY12, CXCR1, TREM2) and astrocytic markers (GFAP, FGFR3). (E) Violin plot showing the % of variance (y-axis) explained by known covariates (x-axis) by variancePartition. Each dot represents a gene. (F) PCA after regressing out covariates colored by diagnosis (left panel), brain region (middle panel), postmortem interval (right panel). n=128 samples from 55 independent donors. (G) Volcano plot showing the fold-change of genes (log2 scale) between PD-microglia (22 samples from 13 donors) and controls (106 samples from 42 donors) (x-axis) and their significance (y-axis, −log10 scale). Moderated t-statistic (two sided) is used for statistical test (see R package DREAM).(H) Expression of selected mitochondria-specific genes in microglia. Adjusted gene expression levels after normalization are shown. Boxplots: the line represents the median. The boxes extend from the 25th - 75th percentile and the lines extend 1.5 times the interquartile range. n=128 samples from 55 independent donors.
Figure 1.
Figure 1.. Overview of the study design.
Parkinson’s disease and age-matched control subjects were recruited from five clinical sites: Movement Disorder Center at Mount Sinai Beth Israel (MSBI), Bendheim Parkinson and Movement Disorders Center at Mount Sinai (BPMD), Fresco Institute for Parkinson’s and Movement Disorders at New York University (NYUMD), and the Alzheimer’s Research Center (ADRC) and Center for Cognitive Health (CCH) at Mount Sinai Hospital. Fresh blood samples from PD and age-matched healthy subjects were collected following a rigorous, standardized set of procedures and used to isolate peripheral blood mononuclear cells (PBMCs). From the PBMCs, CD14+ monocytes were isolated using magnetic beads. Primary microglia were isolated from independent autopsied brains from two brain banks: Netherlands Brain Bank (NBB) and the Neuropathology Brain Bank and Research CoRE at Mount Sinai Hospital. Primary human microglia were isolated using CD11b+ beads. mRNAs from these cells were profiled using RNA-seq and single-cell RNA-Seq. Genome-wide genotyping was performed using DNA isolated from these samples. The data generated enabled to (from left to right) (i) description of the transcriptomic profiling of PD-monocytes at the gene, transcript and splicing levels (n=230), (ii) understanding of the contribution of the different monocyte subpopulation to the disease (n=10), (iii) integration of genomic and expression data to identify monocyte eQTLs (n=180) and (iv) comparison of the transcriptome signatures of PD peripheral monocytes to CNS microglia (n, samples=128, N, donors=55).
Figure 2.
Figure 2.. Transcriptomic analysis of PD-derived monocytes and age-matched controls.
(A) Volcano plot showing the fold-change (FC) of genes (log2 scale) between PD-monocytes (n=135) and controls (n=95) (x-axis) and their P-values significance (y-axis, −log10 scale). DEGs at FDR < 0.05 are highlighted in red (upregulated genes) and blue (downregulated genes). Moderated t-statistic (two-sided) is used for statistical test. (B) Pathway analysis for the upregulated (left panel) and downregulated (right panel) DEGs. Significance is represented in the x-axis (−log10 scale of the q-value). Only the 20 most significant pathways (FDR q-value < 0.05) with a minimum of 5 genes overlap are shown. Pathways are grouped and colored by biologically-related processes. n=230 independent samples (C) Examples of selected mitochondrial (top panel) and proteasomal (bottom panel) DEGs. Adjusted expression of the voom normalized counts after regressing covariates is shown. Boxplots: the line represents the median. The boxes extend from the 25th - 75th percentile and the lines extend 1.5 times the interquartile range. n=230 (D) Fold-change (log2 scale) correlation of DEGs between MyND monocytes (x-axis) and AMP-PD whole blood (y-axis). Genes are colored by significance, considering significant DEGs at FDR < 0.05. (E) Fold-change (log2 scale) correlation of DEGs between bulk monocytes (x-axis) and single-cell across-clusters analysis (y-axis). Four outlier genes were removed for easier visualization. Genes are colored by significance, considering significant DEGs at q-value < 0.05.
Figure 3.
Figure 3.. Co-expression networks in monocytes capture PD-specific processes.
(A) Eigengene analysis of all genes in the “mitochondrial” GO category (n = 1302) between PD and controls (Left panel; Two sided Wilcoxon rank-signed test, P-value = 0.0012). Example of a module (green) enriched for PD heritability, mitochondrial genes, and upregulated DEGs (Right panel). Edges represent co-expression connectivity. Nodes in orange are upregulated DEGs at FDR < 0.05; yellow triangles are genes in PD GWAS loci. (B) Eigengene analysis of all genes in the “lysosome” GO category (n = 526) between PD and controls (Two sided Wilcoxon rank sum test, P-value = 0.0013) (Left panel). Example of a module (salmon) enriched for PD heritability, proteo-lysosomal genes, and downregulated DEGs. Nodes in orange are upregulated DEGs at FDR < 0.05; grey are selected proteo-lysosomal genes; and yellow triangles are genes in PD GWAS loci (Right panel). Boxplots: the line represents the median. The boxes extend from the 25th - 75th percentile and the lines extend 1.5 times the interquartile range.
Figure 4.
Figure 4.. Single-cell profiling of CD14+ monocytes from PD and control subjects.
(A) Generation of scRNA-seq from seven PD and three controls yielded 19,144 cells. Uniform Manifold Approximation and Projection (UMAP) visualization representing the six clusters including CD14++/CD16 classical monocytes (purple) CD14++/CD16+ intermediate cluster (green). (B) Comparison of the relative levels of expression of mitochondrial and proteasomal genes in the classical vs. intermediate monocytes using normalized effect (without considering diagnosis) ,. n=10 independent samples (C) Volcano plot showing the normalized effect within CD14++/CD16+ intermediate cluster of PD-monocytes and controls (x-axis) and their significance (y-axis, −log10 P-value). DEGs at q-value < 0.05 are highlighted in red (upregulated genes) and in blue (downregulated genes). Wald statistic is used for statistical test.
Figure 5.
Figure 5.. Comparing the transcriptome profiles of PD monocytes and primary microglia
(A) Effect size (log2[FC]) barplots of PD vs control differential expression in different datasets: substantia nigra (SN; light purple) , human microglia from MyND (dark purple), monocytes from MyND (dark green) and whole blood from AMP-PD (light green). Left panel: nuclear mitochondrial genes and proteasomal genes which are DEGs at FDR < 0.05 in monocytes from MyND. Right panel: All S100 genes tested across datasets. Bars indicate +/− SEM. Corrected P-value: *FDR < 0.05 in all datasets; *FDR < 0.15 for microglia MyND. Moderated t-statistic (two-sided) is used for statistical test. (B) Heatmap showing the fold-change (log2 scale) of disease vs controls of OXPHOS genes (y-axis) across different diseases (PD, Depression or Psychiatric disorders [Bipolar and Schizophrenia]). Blue represents log2(FC) < 0 (downregulated genes) and red represents log2(FC) > 0 (upregulated genes) when comparing disease vs. controls. Selected mitochondrial genes are shown. Nominal P-value: * P-value < 0.05; ** P-value < 0.01 for disease vs control differential expression. (C) qPCR validating the top differentially expressed OXPHOS genes (COXB, NDUFA1 and PET100) in monocytes and MDMs of controls (n = 11) and PD patients (n = 12). Graphs represent the fold change expression compared to controls. P-value was calculated via t-test. Boxplots: the line represents the median. The boxes extend from the 25th - 75th percentile and the lines extend 1.5 times the interquartile range.
Figure 6.
Figure 6.. Parkinson’s disease susceptibility alleles alter gene expression in monocytes.
(A) Estimated proportion of heritability mediated by cis-genetic component of expression (h 2med/h 2g) in monocytes, DLPFC , and microglia for AD , PD , Schizophrenia and Height GWAS. Bars indicate +/− SEM. (B) Colocalization of PD GWAS loci and monocyte cis expression or splicing QTLs. Shown in the bar plots are Posterior Probability (PPH4) from coloc that supports the hypothesis (PPH4) that both eQTL (or sQTL) and PD GWAS share the same single variant. PD loci with suggestive colocalization (PPH4 > 0.5) are shown along with the eGene and the lead eQTL SNP (in LD with the lead GWAS SNP; r2 > 0.8). Genes in bold indicate reliable evidence in favor of a colocalized signal (defined as PPH3 + PPH4 > 0.8, PPH4/PPH3 > 2). n=180 independent samples. (C) Boxplot of selected eQTLs with gene expression (PEER adjusted) per individual stratified by genotype. The eQTL P-value and effect size (linear regression, see QTLtools) are listed on top. The PD GWAS effect allele is in bold. Boxplots: the line represents the median. The boxes extend from the 25th - 75th percentile and the lines extend 1.5 times the interquartile range. n=180 independent samples. (D) Fine-mapping of the BST1 locus. Colocalization of monocyte eQTL (top panel) and PD GWAS association (middle panel). Fine-mapping of BST1 using PolyFun prioritizes two variants within the 95% credible set (bottom panel), one of which is a lead eQTL SNP (rs34559912). (E) Example of an sQTL within FAM49B showing intronic ratios stratified by genotypes (left panel). The PD effect allele and most significant intronic excision (chr8:129903350:129970943) within FAM49B are in bold. The red (bold) line represents the most significant junction. sQTL boxplot of chr8:129903350:129970943 intronic excision ratio (PEER adjusted) per individual stratified by genotype (right panel). Boxplots: the line represents the median. The boxes extend from the 25th - 75th percentile and the lines extend 1.5 times the interquartile range. n=180 independent samples.

References

    1. Poewe W et al. Parkinson disease. Nat Rev Dis Primers 3, 17013 (2017). - PubMed
    1. Ohnmacht J, May P, Sinkkonen L & Krüger R Missing heritability in Parkinson’s disease: the emerging role of non-coding genetic variation. Journal of Neural Transmission vol. 127 729–748 (2020). - PMC - PubMed
    1. Nalls MA et al. Identification of novel risk loci, causal insights, and heritable risk for Parkinson’s disease: a meta-analysis of genome-wide association studies. Lancet Neurol. 18, 1091–1102 (2019). - PMC - PubMed
    1. Li YI, Wong G, Humphrey J & Raj T Prioritizing Parkinson’s disease genes using population-scale transcriptomic data. Nat. Commun 10, 994 (2019). - PMC - PubMed
    1. Gagliano SA et al. Genomics implicates adaptive and innate immunity in Alzheimer’s and Parkinson's diseases. Annals of Clinical and Translational Neurology vol. 3 924–933 (2016). - PMC - PubMed

Publication types