

Admissions to a Low-Resource Neonatal Unit in Malawi Using a Mobile App and Dashboard: A 1-Year Digital Perinatal Outcome Audit
- PMID: 35005696
- PMCID: PMC8732863
- DOI: 10.3389/fdgth.2021.761128
Admissions to a Low-Resource Neonatal Unit in Malawi Using a Mobile App and Dashboard: A 1-Year Digital Perinatal Outcome Audit
Abstract
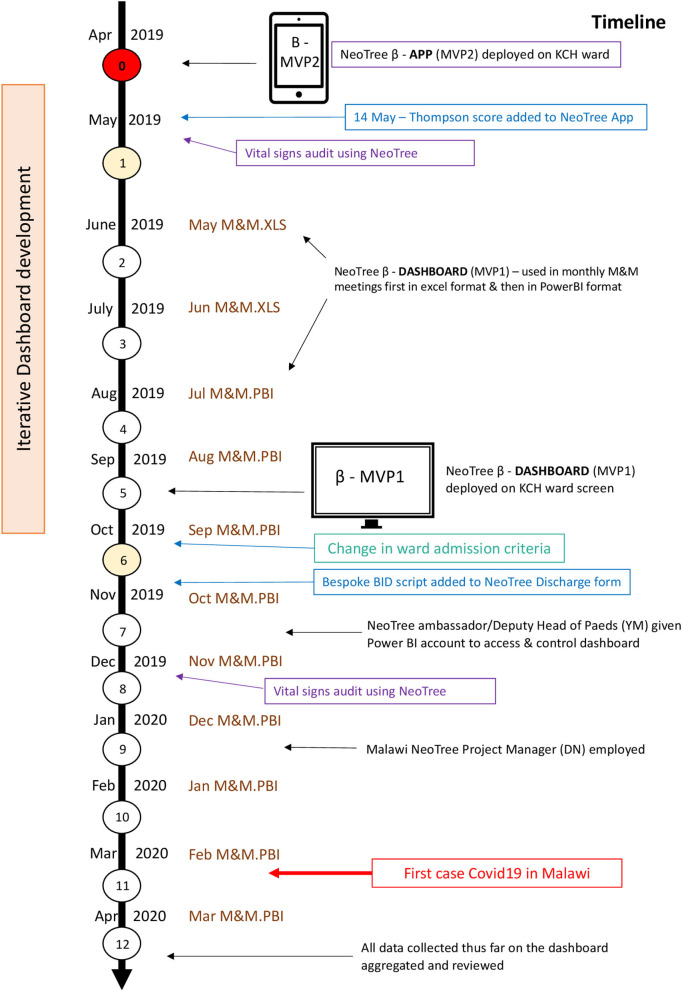
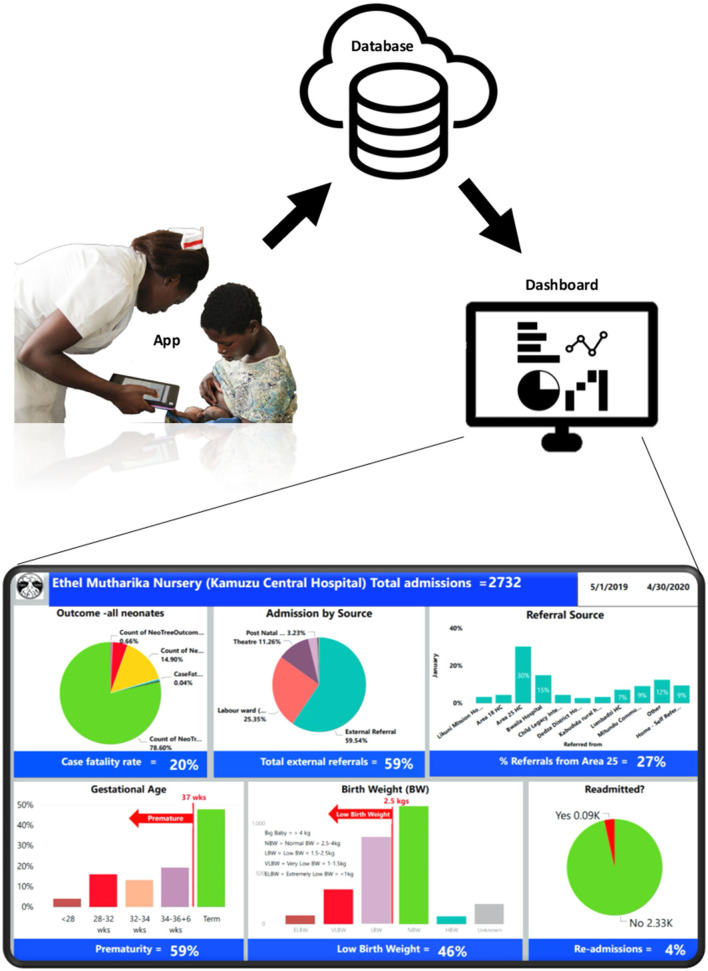
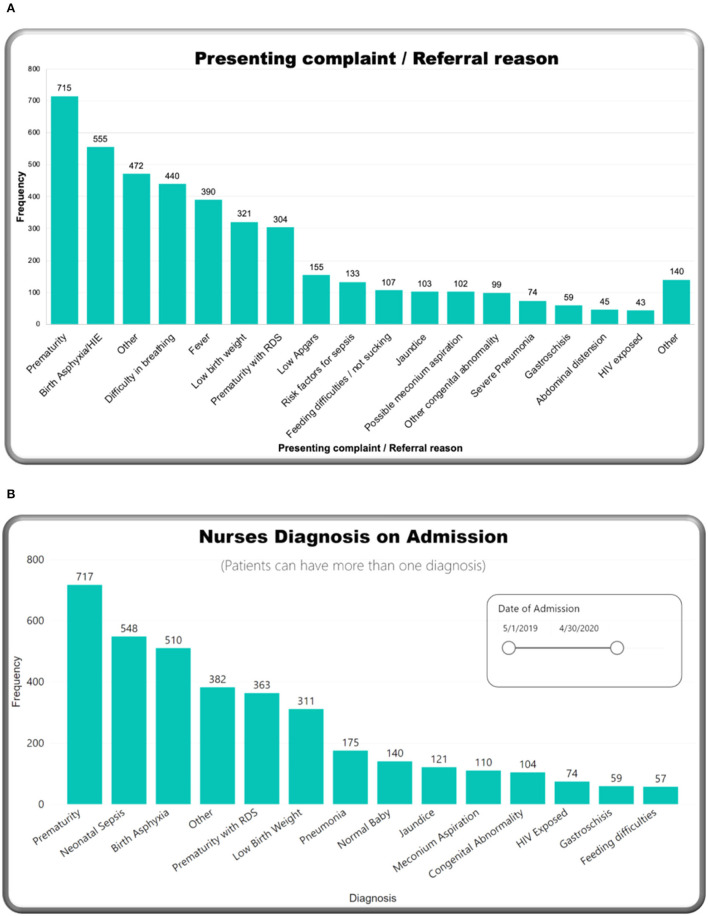
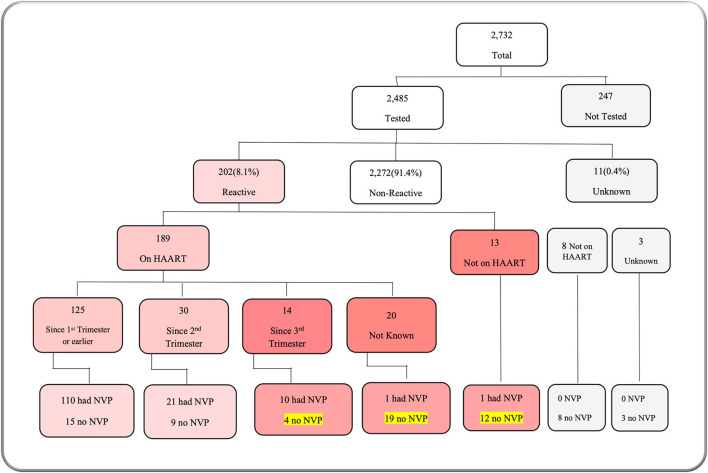
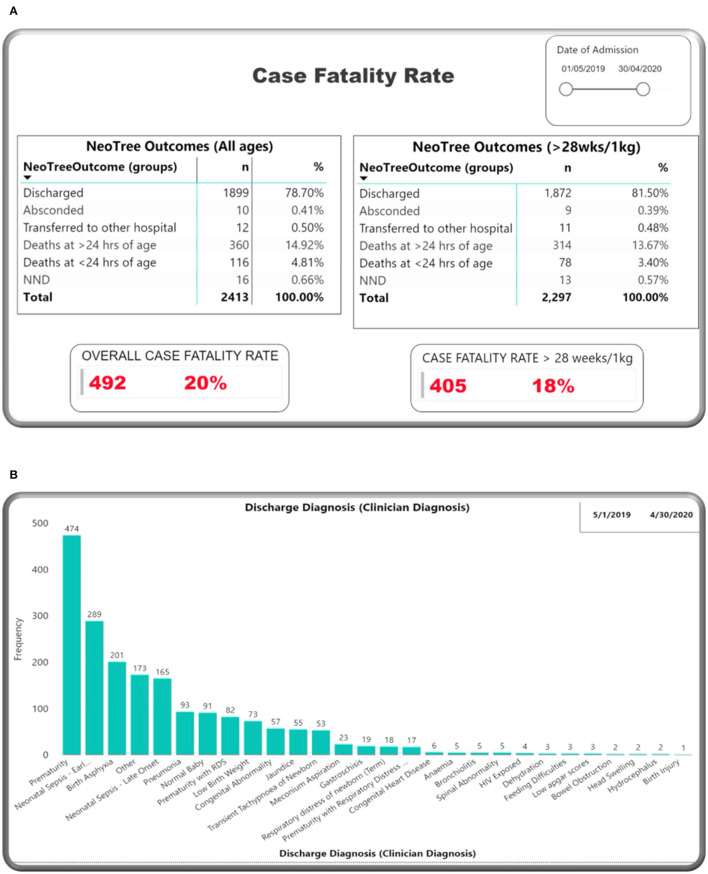
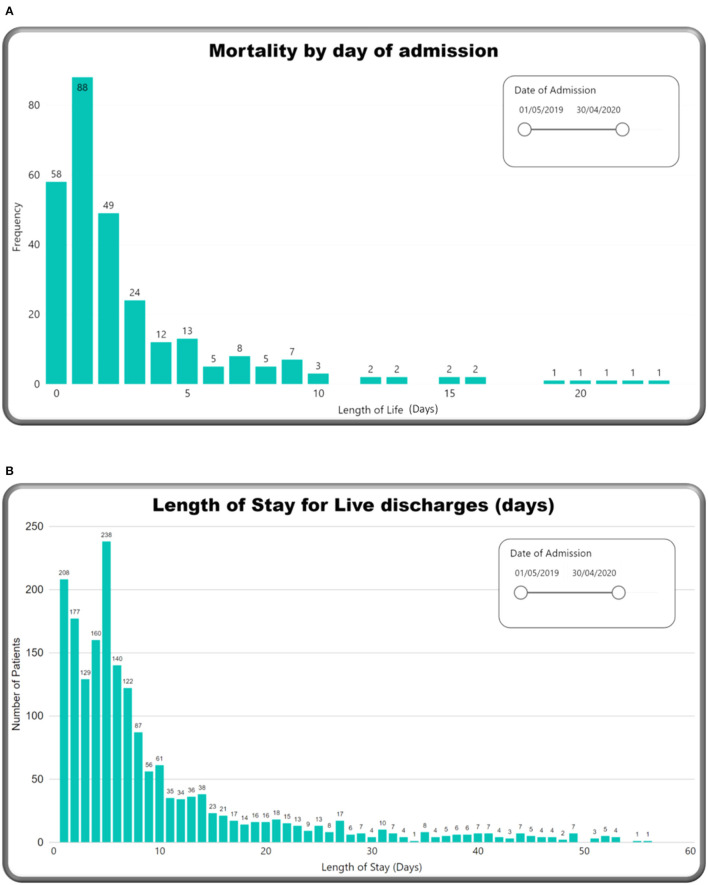
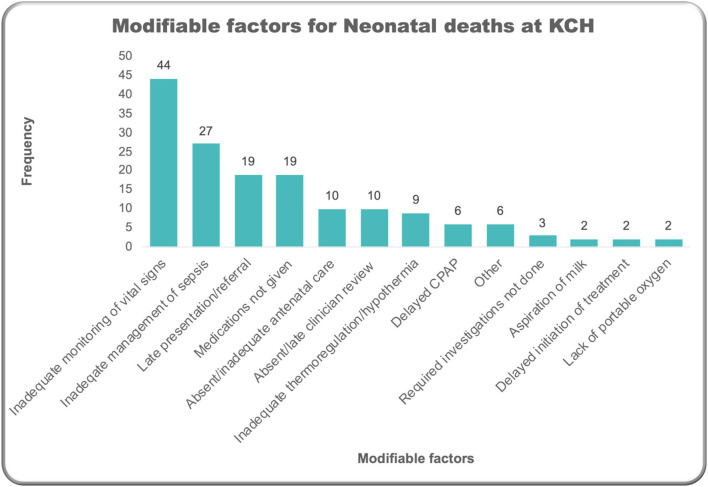
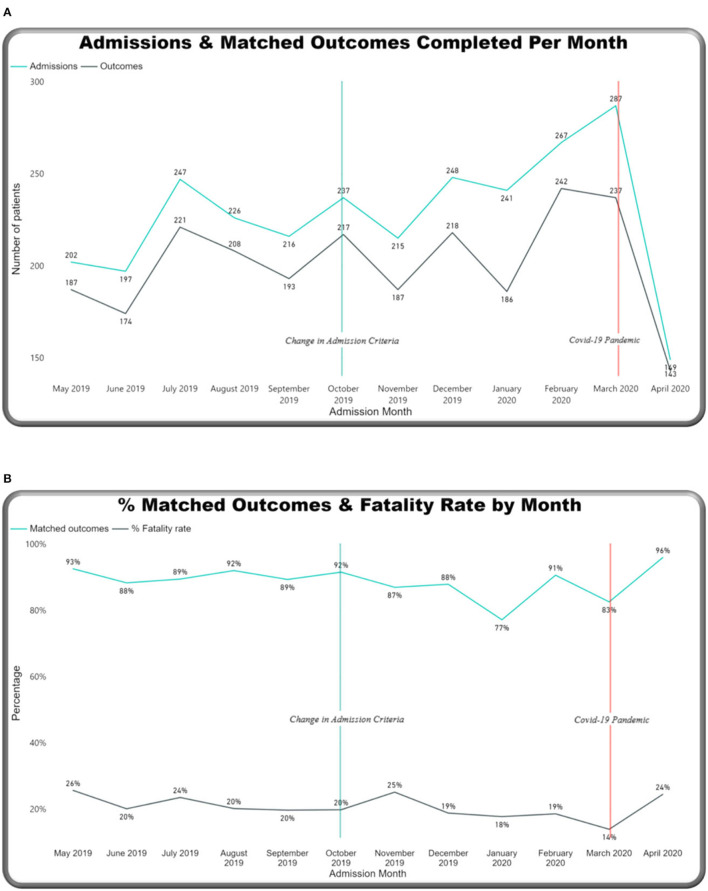
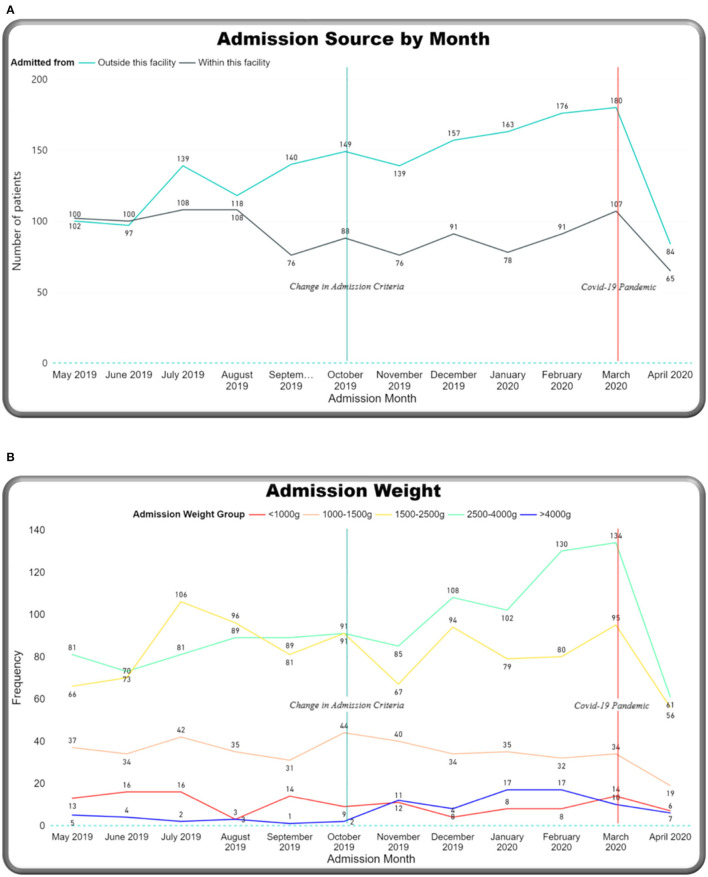
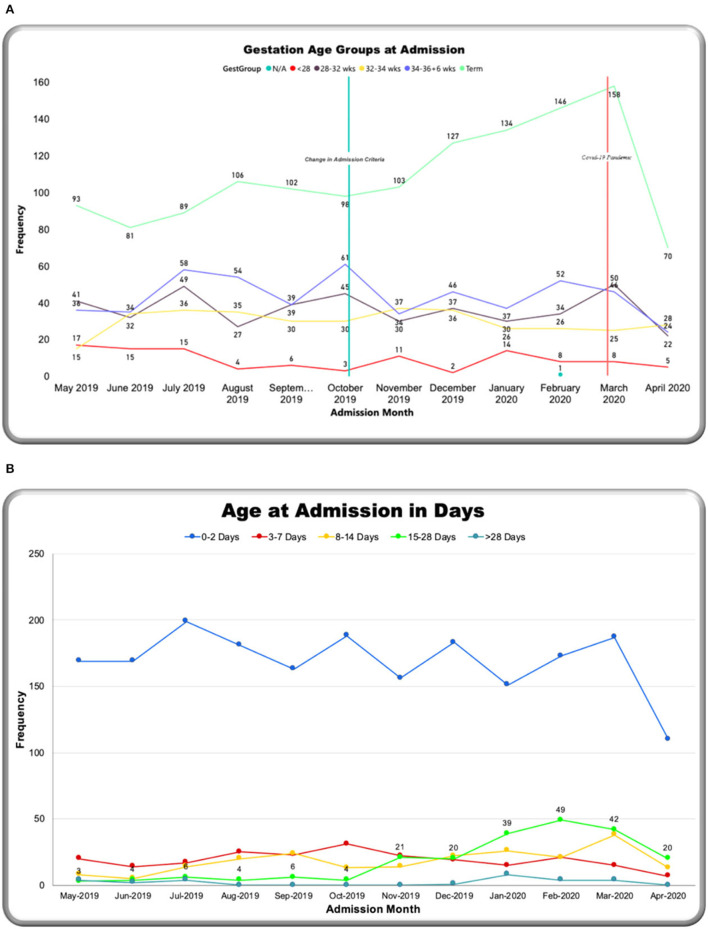
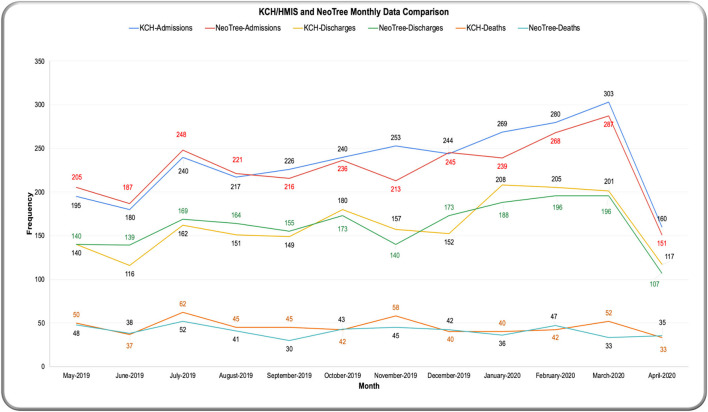
Introduction: Understanding the extent and cause of high neonatal deaths rates in Sub-Saharan Africa is a challenge, especially in the presence of poor-quality and inaccurate data. The NeoTree digital data capture and quality improvement system has been live at Kamuzu Central Hospital, Neonatal Unit, Malawi, since April 2019. Objective: To describe patterns of admissions and outcomes in babies admitted to a Malawian neonatal unit over a 1-year period via a prototype data dashboard. Methods: Data were collected prospectively at the point of care, using the NeoTree app, which includes digital admission and outcome forms containing embedded clinical decision and management support and education in newborn care according to evidence-based guidelines. Data were exported and visualised using Microsoft Power BI. Descriptive and inferential analysis statistics were executed using R. Results: Data collected via NeoTree were 100% for all mandatory fields and, on average, 96% complete across all fields. Coverage of admissions, discharges, and deaths was 97, 99, and 91%, respectively, when compared with the ward logbook. A total of 2,732 neonates were admitted and 2,413 (88.3%) had an electronic outcome recorded: 1,899 (78.7%) were discharged alive, 12 (0.5%) were referred to another hospital, 10 (0.4%) absconded, and 492 (20%) babies died. The overall case fatality rate (CFR) was 204/1,000 admissions. Babies who were premature, low birth weight, out born, or hypothermic on admission, and had significantly higher CFR. Lead causes of death were prematurity with respiratory distress (n = 252, 51%), neonatal sepsis (n = 116, 23%), and neonatal encephalopathy (n = 80, 16%). The most common perceived modifiable factors in death were inadequate monitoring of vital signs and suboptimal management of sepsis. Two hundred and two (8.1%) neonates were HIV exposed, of whom a third [59 (29.2%)] did not receive prophylactic nevirapine, hence vulnerable to vertical infection. Conclusion: A digital data capture and quality improvement system was successfully deployed in a low resource neonatal unit with high (1 in 5) mortality rates providing and visualising reliable, timely, and complete data describing patterns, risk factors, and modifiable causes of newborn mortality. Key targets for quality improvement were identified. Future research will explore the impact of the NeoTree on quality of care and newborn survival.
Keywords: clinical audit; data dashboard; digital health; health informatics application; infant; low income population; mobile health; newborn.
Copyright © 2021 Mgusha, Nkhoma, Chiume, Gundo, Gundo, Shair, Hull-Bailey, Lakhanpaul, Lorencatto, Heys and Crehan.
Conflict of interest statement
The authors declare that the research was conducted in the absence of any commercial or financial relationships that could be construed as a potential conflict of interest.
Figures
References
-
- UNICEF . Levels and Trends in Child Mortality Report 2018. UNICEF; (2018). Available online at: https://www.unicef.org/reports/levels-and-trends-child-mortality-report-... (accessed October 27, 2021).
-
- UNDP . Human Development Reports. A Concise Encyclopedia of the United Nations. (2010). p. 248–54. Available online at: http://hdr.undp.org/en/countries/profiles/MWI (accessed October 27, 2021).
-
- World Bank . Malawi: Development News, Research, Data. World Bank; (2021). Available online at: https://www.worldbank.org/en/country/malawi (accessed October 27, 2021).
-
- Tuyisenge L, Kyamanya P, Van Steirteghem S, Becker M, English M, Lissauer T. Knowledge and skills retention following emergency triage, assessment and treatment plus admission course for final year medical students in Rwanda: a longitudinal cohort study. Arch Dis Child. (2014) 99:993–7. 10.1136/archdischild-2014-306078 - DOI - PMC - PubMed
Grants and funding
LinkOut - more resources
Full Text Sources
Miscellaneous