

Rapid blood acid-base regulation by European sea bass (Dicentrarchus labrax) in response to sudden exposure to high environmental CO2
- PMID: 35005768
- PMCID: PMC8917447
- DOI: 10.1242/jeb.242735
Rapid blood acid-base regulation by European sea bass (Dicentrarchus labrax) in response to sudden exposure to high environmental CO2
Abstract
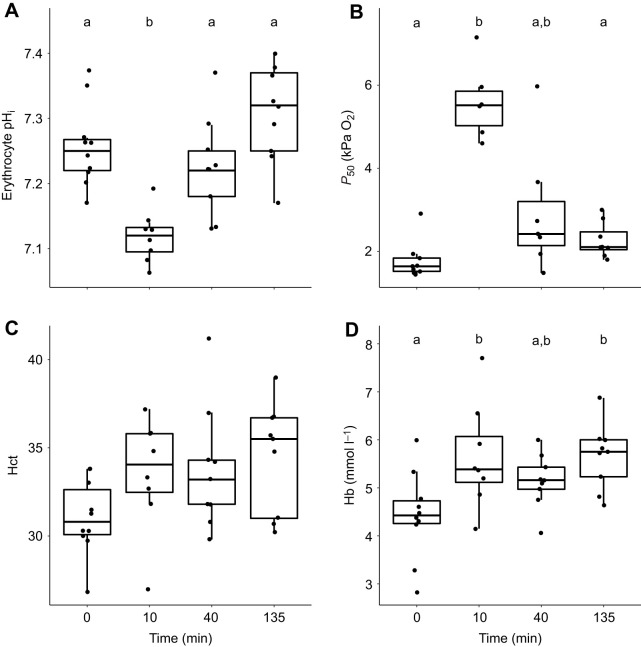
Fish in coastal ecosystems can be exposed to acute variations in CO2 of between 0.2 and 1 kPa CO2 (2000-10,000 µatm). Coping with this environmental challenge will depend on the ability to rapidly compensate for the internal acid-base disturbance caused by sudden exposure to high environmental CO2 (blood and tissue acidosis); however, studies about the speed of acid-base regulatory responses in marine fish are scarce. We observed that upon sudden exposure to ∼1 kPa CO2, European sea bass (Dicentrarchus labrax) completely regulate erythrocyte intracellular pH within ∼40 min, thus restoring haemoglobin-O2 affinity to pre-exposure levels. Moreover, blood pH returned to normal levels within ∼2 h, which is one of the fastest acid-base recoveries documented in any fish. This was achieved via a large upregulation of net acid excretion and accumulation of HCO3- in blood, which increased from ∼4 to ∼22 mmol l-1. While the abundance and intracellular localisation of gill Na+/K+-ATPase (NKA) and Na+/H+ exchanger 3 (NHE3) remained unchanged, the apical surface area of acid-excreting gill ionocytes doubled. This constitutes a novel mechanism for rapidly increasing acid excretion during sudden blood acidosis. Rapid acid-base regulation was completely prevented when the same high CO2 exposure occurred in seawater with experimentally reduced HCO3- and pH, probably because reduced environmental pH inhibited gill H+ excretion via NHE3. The rapid and robust acid-base regulatory responses identified will enable European sea bass to maintain physiological performance during large and sudden CO2 fluctuations that naturally occur in coastal environments.
Keywords: Gill plasticity; Hypercapnia; Ionocytes; O2 transport; Respiratory acidosis.
© 2022. Published by The Company of Biologists Ltd.
Conflict of interest statement
Competing interests The authors declare no competing or financial interests.
Figures


Similar articles
-
Physiological responses of European sea bass (Dicentrarchus labrax) exposed to increased carbon dioxide and reduced seawater salinities.Mol Biol Rep. 2024 Apr 8;51(1):496. doi: 10.1007/s11033-024-09460-2. Mol Biol Rep. 2024. PMID: 38587695
-
Physiological trade-offs, acid-base balance and ion-osmoregulatory plasticity in European sea bass (Dicentrarchus labrax) juveniles under complex scenarios of salinity variation, ocean acidification and high ammonia challenge.Aquat Toxicol. 2019 Jul;212:54-69. doi: 10.1016/j.aquatox.2019.04.024. Epub 2019 May 2. Aquat Toxicol. 2019. PMID: 31075620
-
Interactive effect of high environmental ammonia and nutritional status on ecophysiological performance of European sea bass (Dicentrarchus labrax) acclimated to reduced seawater salinities.Aquat Toxicol. 2015 Mar;160:39-56. doi: 10.1016/j.aquatox.2015.01.005. Epub 2015 Jan 8. Aquat Toxicol. 2015. PMID: 25625520
-
Differential freshwater adaptation in juvenile sea-bass Dicentrarchus labrax: involvement of gills and urinary system.J Exp Biol. 2005 Oct;208(Pt 20):3859-71. doi: 10.1242/jeb.01853. J Exp Biol. 2005. PMID: 16215214
-
Osmoregulatory response to low salinities in the European sea bass embryos: a multi-site approach.J Comp Physiol B. 2013 Jan;183(1):83-97. doi: 10.1007/s00360-012-0687-2. Epub 2012 Jul 1. J Comp Physiol B. 2013. PMID: 22752053
Cited by
-
Could future ocean acidification be affecting the energy budgets of marine fish?Conserv Physiol. 2024 Oct 8;12(1):coae069. doi: 10.1093/conphys/coae069. eCollection 2024. Conserv Physiol. 2024. PMID: 39381802 Free PMC article.
-
Mechanisms of Na+ uptake from freshwater habitats in animals.Front Physiol. 2022 Oct 18;13:1006113. doi: 10.3389/fphys.2022.1006113. eCollection 2022. Front Physiol. 2022. PMID: 36388090 Free PMC article. Review.
-
Respiratory acidosis and O2 supply capacity do not affect the acute temperature tolerance of rainbow trout (Oncorhynchus mykiss).Conserv Physiol. 2024 May 16;12(1):coae026. doi: 10.1093/conphys/coae026. eCollection 2024. Conserv Physiol. 2024. PMID: 38779432 Free PMC article.
-
Response of CRH system in brain and gill of marine medaka to seawater acidification.Fish Physiol Biochem. 2024 Jun;50(3):1225-1236. doi: 10.1007/s10695-024-01332-7. Epub 2024 Mar 21. Fish Physiol Biochem. 2024. PMID: 38512395
References
-
- Baker, D. W., Matey, V., Huynh, K. T., Wilson, J. M., Morgan, J. D. and Brauner, C. J. (2009a). Complete intracellular pH protection during extracellular pH depression is associated with hypercarbia tolerance in white sturgeon, Acipenser transmontanus. Am. J. Physiol. Integr. Comp. Physiol. 296, R1868-R1880. 10.1152/ajpregu.90767.2008 - DOI - PubMed
-
- Baker, D. W., May, C. and Brauner, C. J. (2009b). A validation of intracellular pH measurements in fish exposed to hypercarbia: the effect of duration of tissue storage and efficacy of the metabolic inhibitor tissue homogenate method. J. Fish Biol. 75, 268-275. 10.1111/j.1095-8649.2009.02261.x - DOI - PubMed
-
- Baumann, H., Wallace, R. B., Tagliaferri, T. and Gobler, C. J. (2015). Large natural pH, CO2 and O2 fluctuations in a temperate tidal salt marsh on diel, seasonal, and interannual time scales. Estuaries Coasts 38, 220-231. 10.1007/s12237-014-9800-y - DOI
Publication types
MeSH terms
Substances
Grants and funding
LinkOut - more resources
Full Text Sources
Research Materials
Miscellaneous
