. 2022 Jan;10(1):e15165.
doi: 10.14814/phy2.15165.

Pharmacological inhibition of the lipid phosphatase PTEN ameliorates heart damage and adipose tissue inflammation in stressed rats with metabolic syndrome

Affiliations

Pharmacological inhibition of the lipid phosphatase PTEN ameliorates heart damage and adipose tissue inflammation in stressed rats with metabolic syndrome

Sao Ashikawa et al. Physiol Rep. 2022 Jan.

Abstract

Phosphatidylinositol 3-kinase (PI3K) signaling promotes the differentiation and proliferation of regulatory B (Breg) cells, and the lipid phosphatase phosphatase and tensin homolog deleted on chromosome 10 (PTEN) antagonizes the PI3K-Akt signaling pathway. We previously demonstrated that cardiac Akt activity is increased and that restraint stress exacerbates hypertension and both heart and adipose tissue (AT) inflammation in DS/obese rats, an animal model of metabolic syndrome (MetS). We here examined the effects of restraint stress and pharmacological inhibition of PTEN on heart and AT pathology in such rats. Nine-week-old animals were treated with the PTEN inhibitor bisperoxovanadium-pic [bpV(pic)] or vehicle in the absence or presence of restraint stress for 4 weeks. BpV(pic) treatment had no effect on body weight or fat mass but attenuated hypertension in DS/obese rats subjected to restraint stress. BpV(pic) ameliorated left ventricular (LV) inflammation, fibrosis, and diastolic dysfunction as well as AT inflammation in the stressed rats. Restraint stress reduced myocardial capillary density, and this effect was prevented by bpV(pic). In addition, bpV(pic) increased the proportions of Breg and B-1 cells as well as reduced those of CD8+ T and B-2 cells in AT of stressed rats. Our results indicate that inhibition of PTEN by bpV(pic) alleviated heart and AT inflammation in stressed rats with MetS. These positive effects of bpV(pic) are likely due, at least in part, to a reduction in blood pressure, an increase in myocardial capillary formation, and an altered distribution of immune cells in fat tissue that result from the activation of PI3K-Akt signaling.

Keywords: PTEN; adipose tissue inflammation; cardiac injury; metabolic syndrome; regulatory B cell; stress.


Figures

FIGURE 1
FIGURE 1
Time courses of body weight (a), food intake (b), water intake (c), SBP (d), and heart rate (e) in rats of the four experimental groups. Data are means ± SEM (n = 9, 9, 10, and 10 for MetS, MetS+bpV(pic), MetS+RS, and MetS+RS+bpV(pic) groups, respectively). *p < 0.05 versus MetS, p < 0.05 versus MetS+bpV(pic), p < 0.05 versus MetS+RS (two‐way repeated measures ANOVA)
FIGURE 2
FIGURE 2
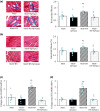
Cardiomyocyte size, fetal‐type cardiac gene expression, macrophage infiltration, and inflammation‐related gene expression in the left ventricle of rats at 13 weeks of age. (a) hematoxylin–eosin staining of transverse sections of the LV myocardium (left; bars, 50 µm) as well as cross‐sectional area of cardiomyocytes measured in such sections (right). (b, c) Relative atrial natriuretic peptide (ANP) (b) and brain natriuretic peptide (BNP) (c) mRNA abundance in left ventricular (LV) tissue. (d) Immunohistochemical staining of CD68 in the left ventricle (left; bars, 50 µm) as well as quantification of CD68+ cell density on the basis of such staining (right). (e–h) Relative monocyte chemoattractant protein‐1 (MCP‐1) (e), osteopontin (f), tumor necrosis factor‐α (TNF‐α) (g), and cyclooxygenase‐2 (COX‐2) (h) mRNA abundance in LV tissue. All quantitative data are means ± SEM [n = 9, 9, 10, and 9 (a, d) or n = 6, 6, 6, and 6 (b, c, and e–h) for MetS, MetS+bpV(pic), MetS+RS, and MetS+RS+bpV(pic) groups, respectively]. *p < 0.05 versus MetS, p < 0.05 versus MetS+bpV(pic), p < 0.05 versus MetS+RS (one‐way factorial ANOVA and Fisher's test)
FIGURE 3
FIGURE 3
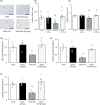
Fibrosis and fibrosis‐related gene expression in the left ventricle of rats at 13 weeks of age. (a, b) Azan Mallory staining of collagen deposition in perivascular (a) and interstitial (b) areas of the left ventricular (LV) myocardium (left; bars, 100 µm) as well as quantification of the relative extents of fibrosis determined from such staining (right). (c, d) Relative collagen type I (c) and type III (d) mRNA abundance in LV tissue. All quantitative data are means ± SEM [n = 9, 9, 10, and 10 (a, b) or n = 6, 6, 6, and 6 (c, d) for MetS, MetS+bpV(pic), MetS+RS, and MetS+RS+bpV(pic) groups, respectively]. *p < 0.05 versus MetS, †p < 0.05 versus MetS+bpV(pic), ‡p < 0.05 versus MetS+RS (one‐way factorial ANOVA and Fisher's test)
FIGURE 4
FIGURE 4
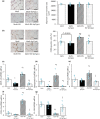
Angiogenesis and expression of pro‐angiogenic genes in the left ventricle of rats at 13 weeks of age. (a–c) Immunohistochemical staining of CD31 in the left ventricle (a) as well as capillary density (b) and the capillary/myocyte ratio (c) determined from such staining. Bars, 50 µm. (d–f) Relative hypoxia‐inducible factor‐1α (HIF‐1α) (d), vascular endothelial growth factor A (VEGF‐A) (e), and endothelial nitric oxide synthase (eNOS) (f) mRNA abundance in LV tissue. All quantitative data are means ± SEM [n = 9, 9, 10, and 10 (b, c) or n = 6, 6, 6, and 6 (d–f) for MetS, MetS+bpV(pic), MetS+RS, and MetS+RS+bpV(pic) groups, respectively]. *p < 0.05 versus MetS, †p < 0.05 versus MetS+bpV(pic), ‡p < 0.05 versus MetS+RS (one‐way factorial ANOVA and Fisher's test)
FIGURE 5
FIGURE 5
Adipocyte size, macrophage infiltration, and inflammatory gene expression in epididymal adipose tissue (AT) of rats at 13 weeks of age. (a) hematoxylin–eosin staining of AT sections (left; bars, 50 µm) as well as adipocyte cross‐sectional area measured on the basis of such staining (right). (b) Immunohistochemical staining of CD68 in AT (left; bars, 50 µm) as well as the number of nuclei for CD68‐positive cells as a proportion of all nuclei determined from such staining (right). (c–g) Relative monocyte chemoattractant protein‐1 (MCP‐1) (c), osteopontin (d), tumor necrosis factor‐α (TNF‐α) (e), cyclooxygenase‐2 (COX‐2) (f), and IL‐10 (g) mRNA abundance in AT. All quantitative data are means ± SEM [n = 9, 9, 10, and 10 (a, b) or n = 6, 6, 6, and 6 (c–g) for MetS, MetS+bpV(pic), MetS+RS, and MetS+RS+bpV(pic) groups, respectively]. *p < 0.05 versus MetS, †p < 0.05 versus MetS+bpV(pic), ‡p < 0.05 versus MetS+RS (one‐way factorial ANOVA and Fisher's test)
FIGURE 6
FIGURE 6
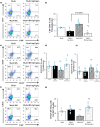
Frequency of CD8+ T cells, B‐1 and B‐2 cells, and Breg cells among lymphocytes in epididymal AT of rats at 13 weeks of age. (a, c, and f) Representative flow cytometric dot plots for CD3+CD8+ T cells among lymphocytes (a), B220CD19+ and B220+CD19+ B cells among lymphocytes (c), and CD1d+CD5+ cells among CD19+ B cells (f). (b, d, e, and g) Percentage of CD3+CD8+ T cells among lymphocytes (b), B220CD19+ B‐1 cells among lymphocytes (D), B220+CD19+ B‐2 cells among lymphocytes (e), and CD1d+CD5+ Breg cells among CD19+ B cells (g) determined as in (a), (c), and (f). All quantitative data are means ±SEM (n = 9, 9, 9, and 9 for MetS, MetS+bpV(pic), MetS+RS, and MetS+RS+bpV(pic) groups, respectively). *p < 0.05 versus MetS, †p < 0.05 versus MetS+bpV(pic), ‡p < 0.05 versus MetS+RS (one‐way factorial ANOVA and Fisher's test)

Similar articles

Cited by

References

    1. Baumgarth, N. (2011). The double life of a B‐1 cell: Self‐reactivity selects for protective effector functions. Nature Reviews Immunology, 11, 34–46. - PubMed
    1. Francis, W. R. , Ireland, R. E. , Spear, A. M. , Jenner, D. , Watts, S. A. , Kirkman, E. , & Pallister, I. (2019). Flow cytometric analysis of hematopoietic populations in rat bone marrow. Impact of trauma and hemorrhagic shock. Cytometry Part A, 95(11), 1167–1177. 10.1002/cyto.a.23903 - DOI - PMC - PubMed
    1. Harmon, D. B. , Srikakulapu, P. , Kaplan, J. L. , Oldham, S. N. , McSkimming, C. , Garmey, J. C. , Perry, H. M. , Kirby, J. L. , Prohaska, T. A. , Gonen, A. , Hallowell, P. , Schirmer, B. , Tsimikas, S. , Taylor, A. M. , Witztum, J. L. , & McNamara, C. A. (2016). Protective role for B‐1b B cells and IgM in obesity‐associated inflammation, glucose intolerance, and insulin resistance. Arteriosclerosis, Thrombosis, and Vascular Biology, 36, 682–691. 10.1161/ATVBAHA.116.307166 - DOI - PMC - PubMed
    1. Hattori, T. , Murase, T. , Ohtake, M. , Inoue, T. , Tsukamoto, H. , Takatsu, M. , Kato, Y. , Hashimoto, K. , Murohara, T. , & Nagata, K. (2011). Characterization of a new animal model of metabolic syndrome: The DahlS.Z‐Lepr(fa)/Lepr(fa) rat. Nutrition & Diabetes, 1, e1. - PMC - PubMed
    1. Hattori, T. , Murase, T. , Takatsu, M. , Nagasawa, K. , Matsuura, N. , Watanabe, S. , Murohara, T. , & Nagata, K. (2014). Dietary salt restriction improves cardiac and adipose tissue pathology independently of obesity in a rat model of metabolic syndrome. Journal of the American Heart Association, 3, e001312. 10.1161/JAHA.114.001312 - DOI - PMC - PubMed

Publication types

Associated data