. 2022 Jan;11(1):e12178.
doi: 10.1002/jev2.12178.

Biodistribution of unmodified cardiosphere-derived cell extracellular vesicles using single RNA tracing

Affiliations

Biodistribution of unmodified cardiosphere-derived cell extracellular vesicles using single RNA tracing

Alessandra Ciullo et al. J Extracell Vesicles. 2022 Jan.

Abstract

Extracellular vesicles (EVs) are potent signalling mediators. Although interest in EV translation is ever-increasing, development efforts are hampered by the inability to reliably assess the uptake of EVs and their RNA cargo. Here, we establish a novel qPCR-based method for the detection of unmodified EVS using an RNA Tracer (DUST). In this proof-of-concept study we use a human-specific Y RNA-derived small RNA (YsRNA) we dub "NT4" that is enriched in cardiosphere-derived cell small EVs (CDC-sEVs). The assay is robust, sensitive, and reproducible. Intravenously administered CDC-sEVs accumulated primarily in the heart on a per mg basis. Cardiac injury enhanced EV uptake in the heart, liver, and brain. Inhibition of EV docking by heparin suppressed uptake variably, while inhibition of endocytosis attenuated uptake in all organs. In vitro, EVs were uptaken more efficiently by macrophages, endothelial cells, and cardiac fibroblasts compared to cardiomyocytes. These findings demonstrate the utility of DUST to assess uptake of EVs in vivo and in vitro.

Keywords: Y-derived small RNA cardiosphere-derived cells; YsRNA; biodistribution; extracellular vesicles; qPCR; small non-coding RNA.


Figures

FIGURE 1
FIGURE 1
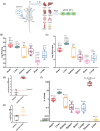
Native hY4f Tracer (NT4) is absent in mouse tissue and highly enriched in human CDC‐sEVs. (a) Next‐generation sequencing of human CDC‐sEVs identified a diversity of RNA species (PIWI RNA (piRNA), microRNA (miR), long intervening non‐coding RNAs (lincRNA), non‐coding RNAs (ncRNA), ribosomal RNA (rRNA), transfer RNA (tRNA), messenger RNA (mRNA). (b) Sequencing of human CDC‐sEVs identified a fragment of YRNA 4 (dubbed NT4) as the single most abundant RNA constituent compared to NHDF‐EVs (normal human dermal fibroblast EVs; NHDF‐EVs). (c) NT4 (highlighted in green) is a smaller portion of a 57‐nucleotide fragment of the YRNA 4 gene (EV‐YF1; highlighted in blue) previously identified by our group. (d) NT4 abundance by qPCR in mouse dermal fibroblasts (Ms‐dFib) and human dermal fibroblasts (Hum‐dFib) expressed in Log2 fold change (= 3 biological replicates per group; data presented as mean ± SEM). (e) qPCR for NT4 abundance among different EV preparations isolated from less pure (10 kDa(10K)) and purer (1000 kDa(1000K) ultrafiltration columns) (= 3 biological replicates per group; data presented as mean ± SEM). (f) NT4 abundance by qPCR in CDC‐sEVs isolated using 10 kDa immortalized ultrafiltration columns (CDC_EVs), CDC‐EVs isolated using size‐exclusion chromatography (SEC) and immortalized CDC‐derived EVs (IMEX); (= 3–5 replicates per group, comparisons (g), and were analyzed using one‐way ANOVA with Tukey's post‐test * = p < 0.05). (g) NT4 RNA is contained inside CDC‐sEVs as shown by protection from RNase degradation and proteinase K treatment and SEC isolated sEVs (= 4–8 replicates per group, mean ± SEM, significance was determined using one‐way ANOVA with Tukey's post‐test **** = p < 0.0001). (h) Nanoparticle tracking analysis revealing particle size distribution and concentration of CDC‐sEVs. (i) Western blot for typical EV markers (TSG101, CD81, HSP90, CD63). CDC‐sEVs are also negative for Calnexin. (j) CDC‐sEVs isolated visualized by transmission electron microscopy (TEM)
FIGURE 2
FIGURE 2
NT4 amplification is efficient, specific, and sensitive in mouse tissue. (a) Efficiency of NT4 amplification using a standard curve prepared using serial dilutions of known numbers of CDC‐sEVs spiked into 20 mg samples of homogenized mouse liver tissue (ΔCq is calculated by subtracting the U6 Cq value to the NT4 Cq value of the same sample). (b) Specificity of the NT4 amplification demonstrated by SYBR green dissociation curves (see Methods). Curves are offset by better visibility. A single dissociation peak near 73°C indicates specificity, whereas multiple peaks or different melting temperatures indicate non‐specific amplification. (c) The same data from (a) were graphed as fold change ([FC] to untreated tissue) versus EVs found in 20 mg of liver tissue. The limit of reliable detection sensitivity is 104 EVs/20 mg tissue. The colour of each data point is consistent across (a–c)
FIGURE 3
FIGURE 3
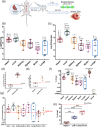
CDC‐sEVs biodistribution in healthy animals after femoral vein injection. (a) Schematic of the experimental design. Healthy mice received an intravenous (IV) injection of 2 × 109 CDC‐sEVs or vehicle control (serum‐free media) into the femoral vein. Heart, liver, kidneys, spleen, brain, lungs, plasma, and urine were collected. (b) Biodistribution data in tissue 1 h after administration of CDC‐EV expressed in Log (EVs)/mg of tissue, whole organ (c), plasma (d), and urine. (f) Percentage of total injected EVs detected in different organs. All data is presented as mean ± SEM (n = 5 animals per group), comparisons in (a–f) were analyzed using one‐way ANOVA with Tukey's post‐test * = p < 0.05, ** = p < 0.01, and *** = p < 0.001 **** = p < 0.0001). Abbreviations above box plots reflect statistic differences between sample and other organ tissue (B, brain; Lu, lung; H, heart; K, kidney; S, spleen; L, liver; P, Plasma; U, urine)
FIGURE 4
FIGURE 4
CDC‐sEVs distribute differently between healthy and injured animals. (a) Schematic of the experimental design. Mice underwent a protocol of ischemia/reperfusion (45 min of ischemia followed by reperfusion) followed by an intravenous (IV) injection of 2 × 109 CDC‐sEVs or vehicle control (serum‐free media) into the femoral vein 20 min after the reperfusion. Heart, liver, kidneys, spleen, brain, lungs, plasma, and urine were collected. (b) CDC‐EV distribution per mg of tissue (b), whole organ (c), plasma (d), and urine (e) 1‐h post‐administration (n = 7 animals per group except (d and e): n = 3–6 animals per group). (f) Percentage of total injected EVs detected in different organs (g) Difference in percentage distribution in animals with ischemia/reperfusion injury (I/R) compared to healthy animals. (h) Percentage of injected EVs detected in different areas or cardiac tissue 1 h after IV administration (n = 4 animals per group). All data presented as mean ± SEM. Comparisons in (a–c), (g), and (h) were analyzed using one‐way ANOVA with Tukey's post‐test * = p < 0.05, ** = p < 0.01 *** = p < 0.001 and **** = p < 0.0001). Comparisons in (d, e, and g) were analyzed using Student's independent t‐test * = p < 0.05, ** = p < 0.01 and **** = p < 0.0001). Abbreviations above box plots reflect statistic differences between sample and other organ tissue (B, brain; Lu, lung; H, heart; K, kidney; S, spleen; L, liver; P, Plasma; U, urine)
FIGURE 5
FIGURE 5
Inhibition of EVs uptake led to abrogation of therapeutic effect in I/R mouse model. I/R injured animals treated with CDC EVs with co‐treatment of heparin (a) or dynasore (b) compared to CDC‐EV treatment only. Data are expressed as the percentage of injected EVs detected in each organ compared to those in I/R animals treated with a single injection of CDC‐sEVs only (n = 4 animals per group. In dynasore‐treated animals one value for EV uptake in the blood was excluded). All data presented as mean ± SEM. Comparisons in (a and b) were analyzed using Student's independent t‐test ** = p < 0.01 and **** = p < 0.0001). (c) Quantification of infarct area in each group and representative images of TTC stained heart sections (d). Infarct mass (white area) was calculated in the tissue sections according to the following formula: (infarct area/tot area) × weight (mg) (n = 3, 4, or 5 animals/group, mean ± SEM, significance was determined using one‐way analysis of variance with Tukey's post‐test with * = p < 0.05)
FIGURE 6
FIGURE 6
CDC‐sEVs are taken up more efficiently by macrophages, cardiac fibroblasts, and endothelial cells compared to cardiomyocytes. (a) Schematic of the experimental design. Neonatal rat ventricular myocytes (NRVM), Microvascular Endothelial cells (mEC), Cardiac Fibroblasts (cFib), and bone marrow‐derived macrophages (BMDM‐Mø) were used in the experiment. (b) Number of EVs detected in the four cell types at various time points post‐EV treatment (20 min, 1, 2, 4 h) (= 4 biological replicates per group; data presented as mean ± SEM). (c) Data from in vitro uptake for the different cell types plotted together (= 4 biological replicates per group; data presented as mean ± SEM). (d and e) Number of EVs (expressed as a percentage) detected in cardiac fibroblasts pre‐treated with or without the uptake inhibitors dynasore (d) (50 μM, 100 μM) and heparin (e) (10 and 50 μg/ml) for 30 min. Cells were then incubated with CDC‐sEVs (1:100) for 2 h with CDC‐sEVs (n = 3–4 biological replicates per group; data presented as mean ± SEM, significance was determined using one‐way analysis of variance with Tukey's post‐test with * = p < 0.05, ** = p < 0.01, *** = p < 0.001, and **** = p < 0.0001)

Similar articles

Cited by

  • Tracking tools of extracellular vesicles for biomedical research.
    Liu Q, Huang J, Xia J, Liang Y, Li G. Liu Q, et al. Front Bioeng Biotechnol. 2022 Nov 18;10:943712. doi: 10.3389/fbioe.2022.943712. eCollection 2022. Front Bioeng Biotechnol. 2022. PMID: 36466335 Free PMC article. Review.
  • Extracellular Non-Coding RNAs in Cardiovascular Diseases.
    Jiapaer Z, Li C, Yang X, Sun L, Chatterjee E, Zhang L, Lei J, Li G. Jiapaer Z, et al. Pharmaceutics. 2023 Jan 3;15(1):155. doi: 10.3390/pharmaceutics15010155. Pharmaceutics. 2023. PMID: 36678784 Free PMC article. Review.
  • Minimal information for studies of extracellular vesicles (MISEV2023): From basic to advanced approaches.
    Welsh JA, Goberdhan DCI, O'Driscoll L, Buzas EI, Blenkiron C, Bussolati B, Cai H, Di Vizio D, Driedonks TAP, Erdbrügger U, Falcon-Perez JM, Fu QL, Hill AF, Lenassi M, Lim SK, Mahoney MG, Mohanty S, Möller A, Nieuwland R, Ochiya T, Sahoo S, Torrecilhas AC, Zheng L, Zijlstra A, Abuelreich S, Bagabas R, Bergese P, Bridges EM, Brucale M, Burger D, Carney RP, Cocucci E, Crescitelli R, Hanser E, Harris AL, Haughey NJ, Hendrix A, Ivanov AR, Jovanovic-Talisman T, Kruh-Garcia NA, Ku'ulei-Lyn Faustino V, Kyburz D, Lässer C, Lennon KM, Lötvall J, Maddox AL, Martens-Uzunova ES, Mizenko RR, Newman LA, Ridolfi A, Rohde E, Rojalin T, Rowland A, Saftics A, Sandau US, Saugstad JA, Shekari F, Swift S, Ter-Ovanesyan D, Tosar JP, Useckaite Z, Valle F, Varga Z, van der Pol E, van Herwijnen MJC, Wauben MHM, Wehman AM, Williams S, Zendrini A, Zimmerman AJ; MISEV Consortium; Théry C, Witwer KW. Welsh JA, et al. J Extracell Vesicles. 2024 Feb;13(2):e12404. doi: 10.1002/jev2.12404. J Extracell Vesicles. 2024. PMID: 38326288 Free PMC article.
  • TDO2-augmented fibroblasts secrete EVs enriched in immunomodulatory Y-derived small RNA.
    Ciullo A, Peck K, Jones X, Yamaguchi S, Morris AA, Kumar AN, Li L, Lee J, Dos Santos RM, Cingolani E, Ibrahim AG. Ciullo A, et al. J Extracell Biol. 2023 Feb 2;2(2):e73. doi: 10.1002/jex2.73. eCollection 2023 Feb. J Extracell Biol. 2023. PMID: 38938522 Free PMC article.
  • Oral Bioavailability of a Noncoding RNA Drug, TY1, That Acts on Macrophages.
    Yamaguchi S, Miyamoto K, Jones XM, Ciullo A, Tsi K, Anderson J, Komuro H, Soussi S, Morris A, Kitka D, Liu DZ, Nguyen A, Marbán E, Ibrahim AGE. Yamaguchi S, et al. J Extracell Biol. 2025 Aug 14;4(8):e70081. doi: 10.1002/jex2.70081. eCollection 2025 Aug. J Extracell Biol. 2025. PMID: 40823342 Free PMC article.

References

    1. Altschul, S. (1997). Gapped BLAST and PSI‐BLAST: A new generation of protein database search programs. Nucleic Acids Research 25, 3389–3402 - PMC - PubMed
    1. Bala, S. , Csak, T. , Momen‐Heravi, F. , Lippai, D. , Kodys, K. , Catalano, D. , Satishchandran, A. , Ambros, V. , & Szabo, G. (2015). Biodistribution and function of extracellular miRNA‐155 in mice. Scientific Reports 5, 10721, 10.1038/srep10721 - DOI - PMC - PubMed
    1. Bittel, D. C. , & Jaiswal, J. K. (2019). Contribution of extracellular vesicles in rebuilding injured muscles. Frontiers in Physiology 10, 828, 10.3389/fphys.2019.00828 - DOI - PMC - PubMed
    1. Boneu, B. , Caranobe, C. , & Sie, P. (1990).Pharmacokinetics of heparin and low molecular weight heparin. Baillieres Clinical Haematology 3, 531–544, 10.1016/s0950-3536(05)80017-4 - DOI - PubMed
    1. Bruno, V. , Svensson‐Arvelund, J. , Rubér, M. , Berg, G. , Piccione, E. , Jenmalm, M. C. , & Ernerudh, J. (2018).Effects of low molecular weight heparin on the polarization and cytokine profile of macrophages and T helper cells in vitro. Scientific Reports 8, 4166, 10.1038/s41598-018-22418-2 - DOI - PMC - PubMed

Publication types

Substances

LinkOut - more resources