Comparative Study
. 2022 Jan 10:11:e70763.
doi: 10.7554/eLife.70763.

Comparative transcriptomic analysis reveals translationally relevant processes in mouse models of malaria

Affiliations
Comparative Study

Comparative transcriptomic analysis reveals translationally relevant processes in mouse models of malaria

Athina Georgiadou et al. Elife. .

Abstract

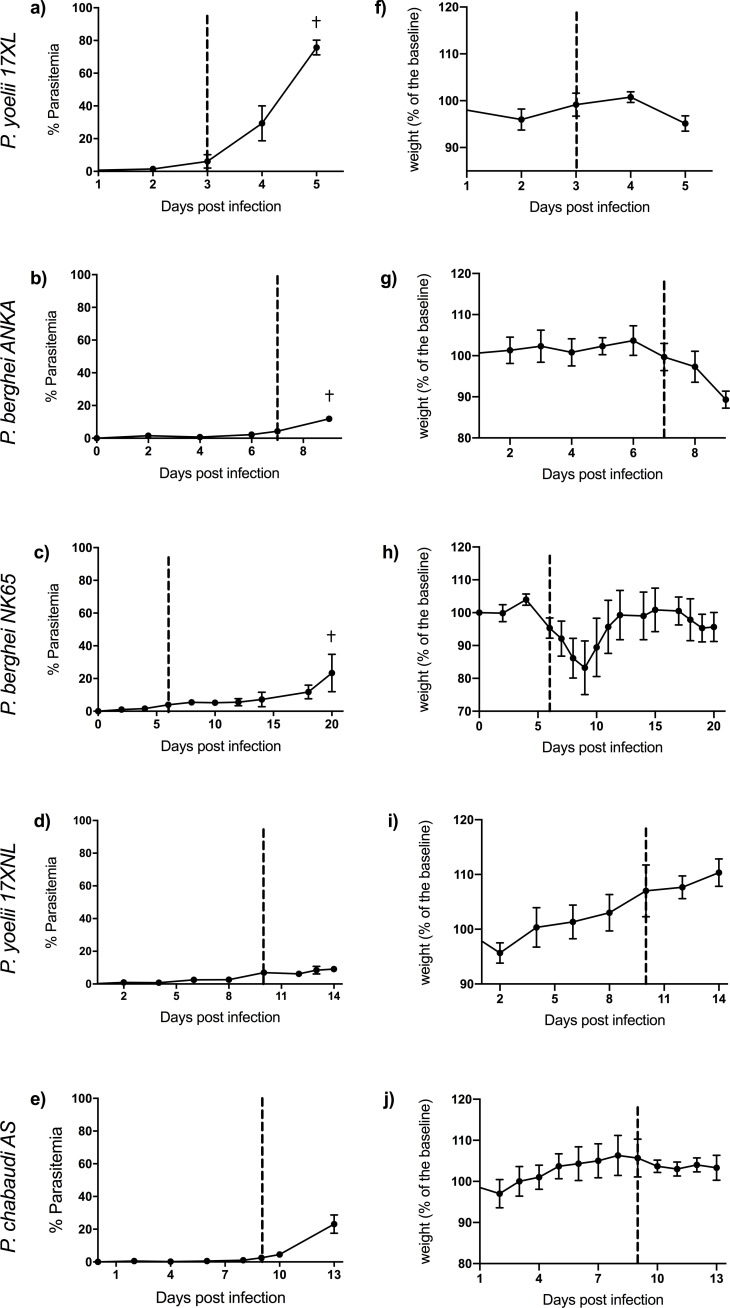
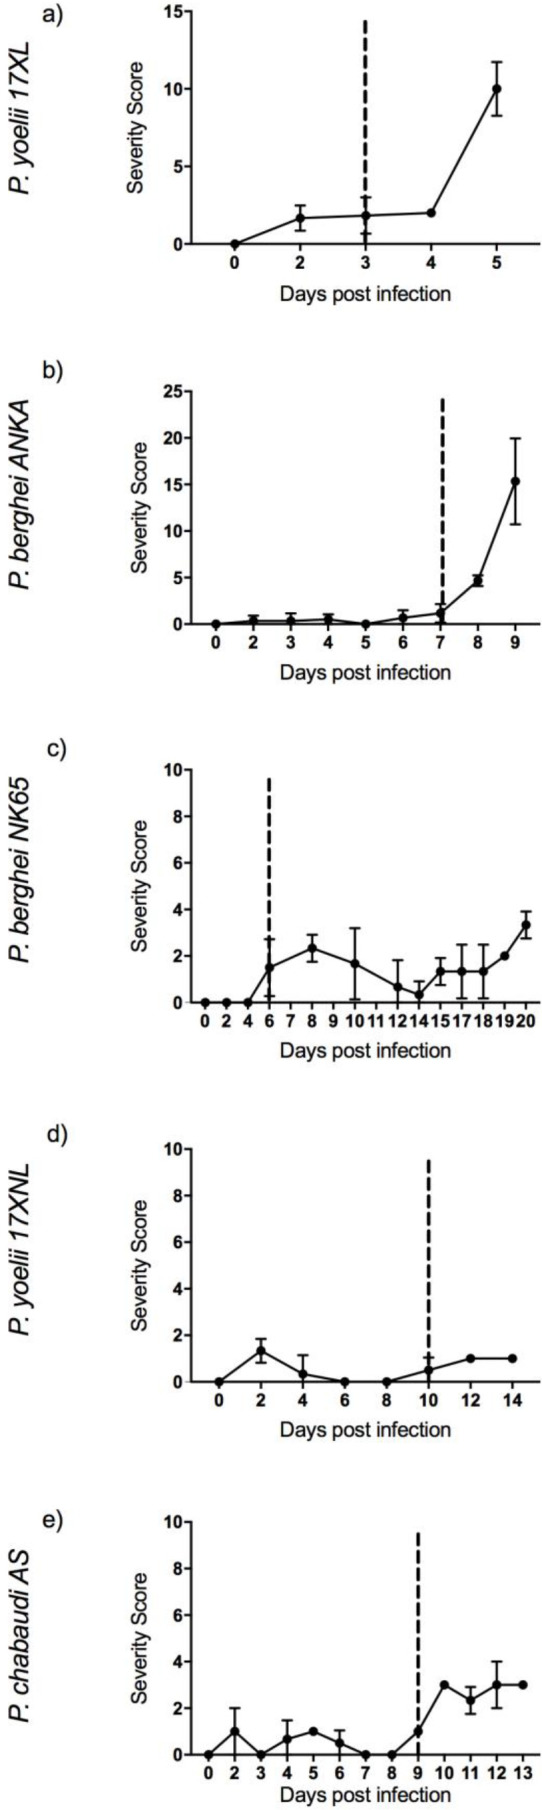
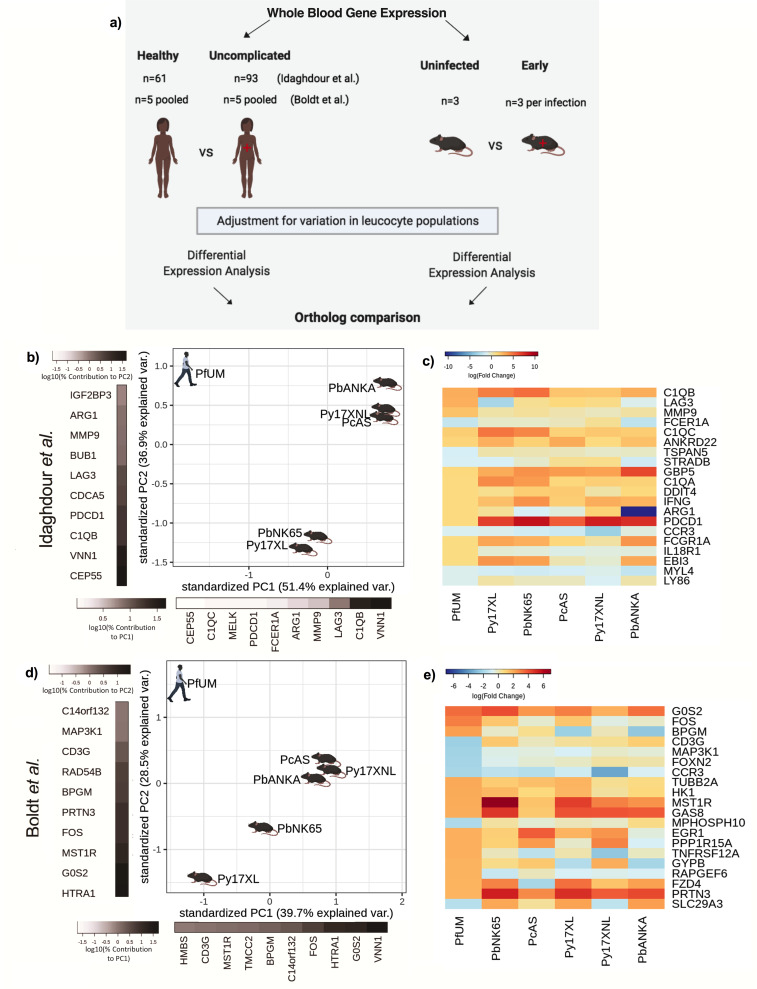
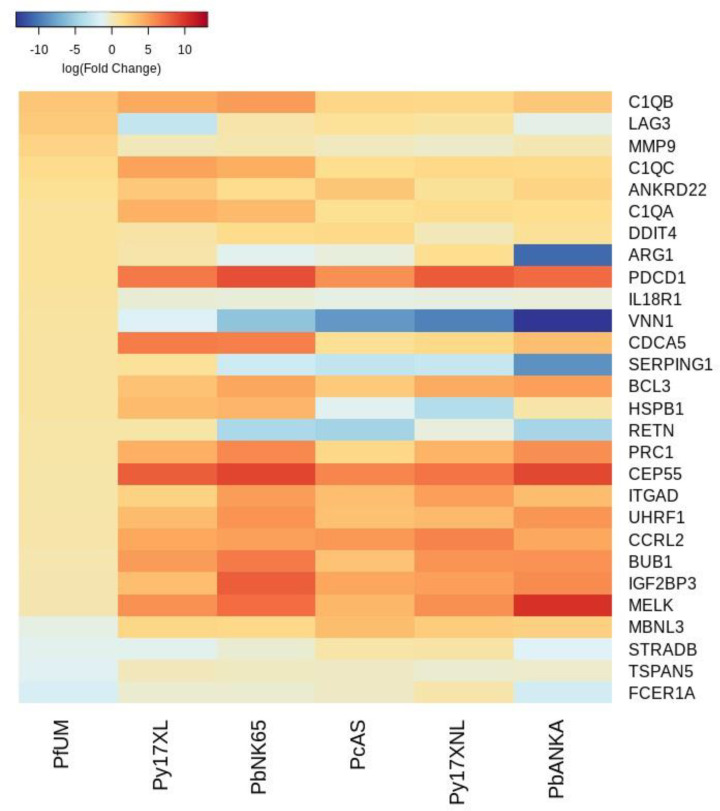
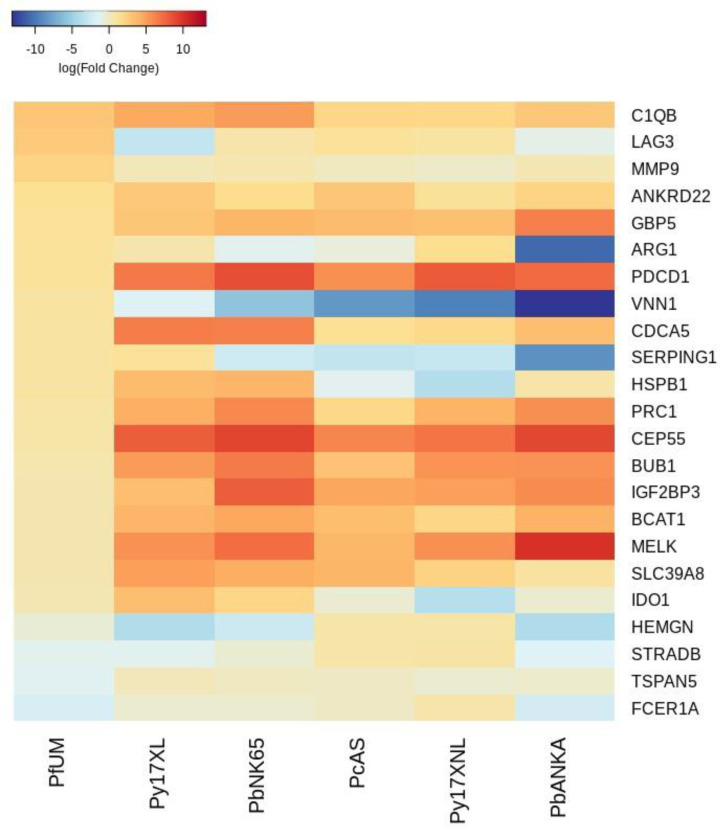
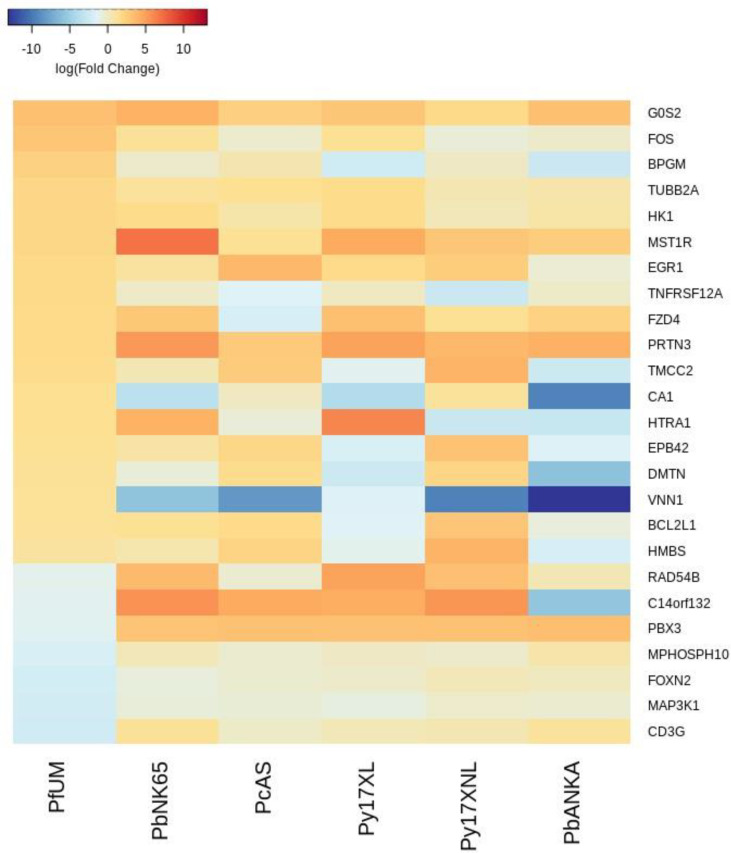
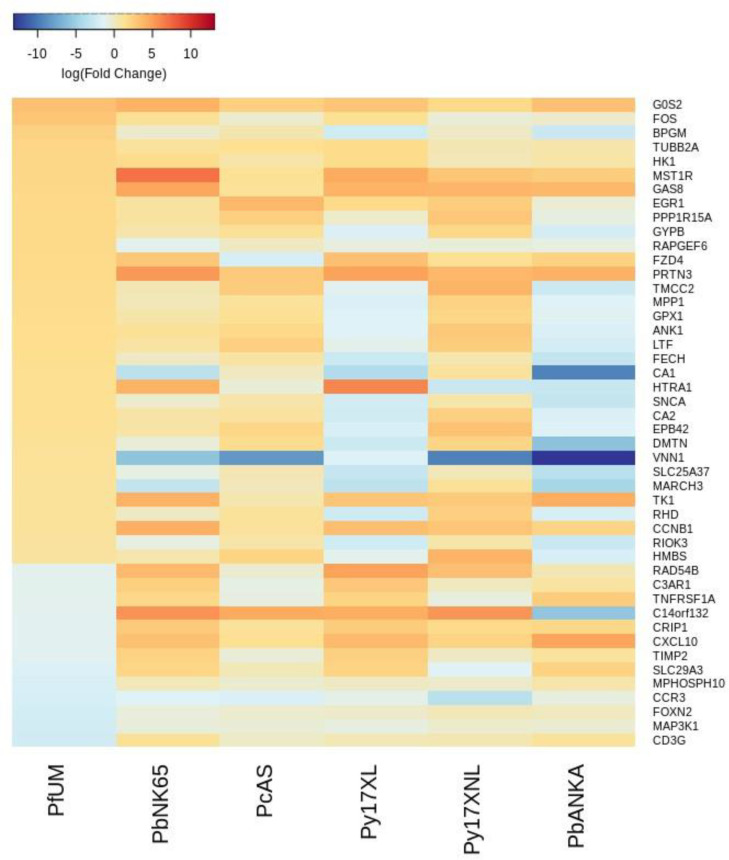
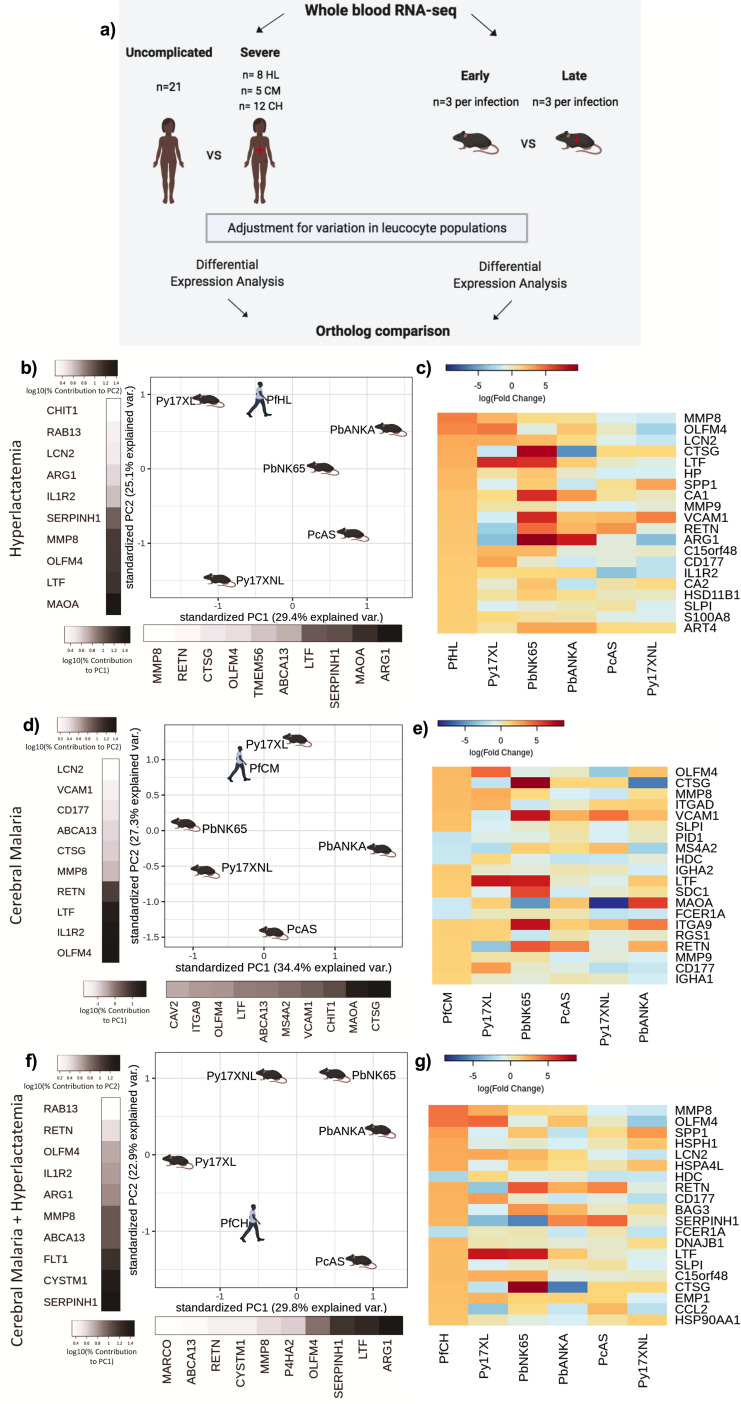
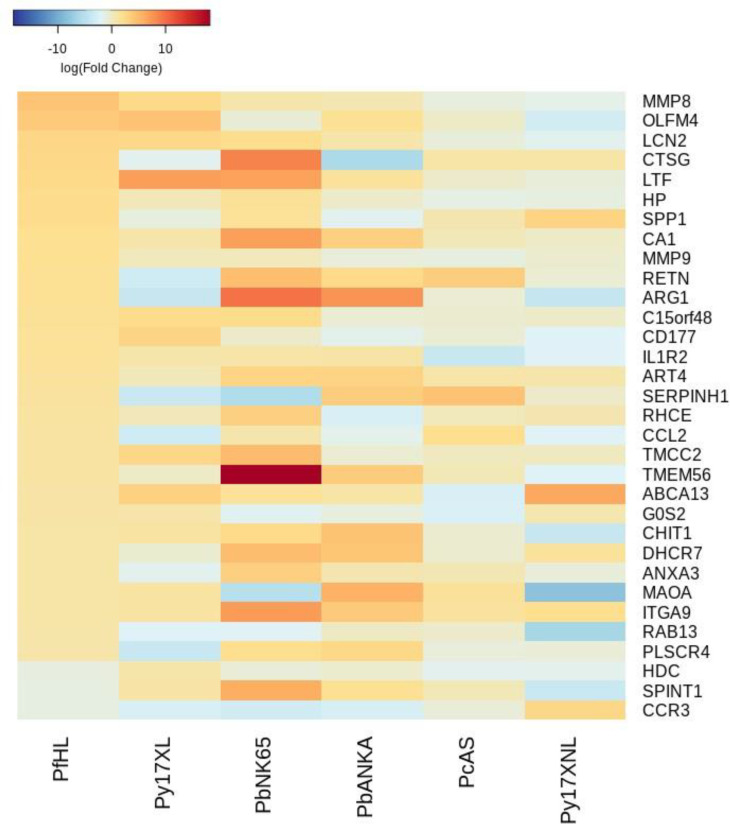
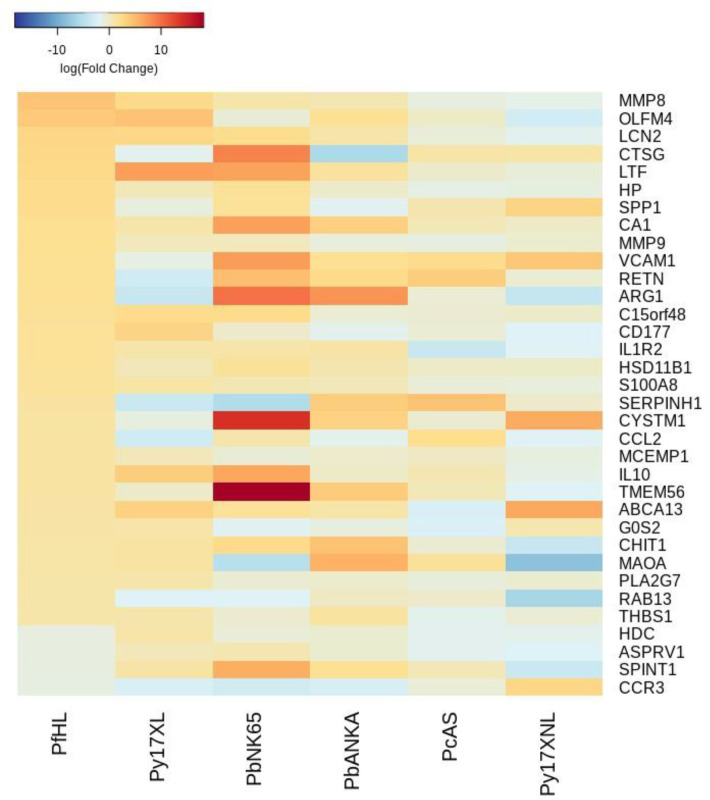
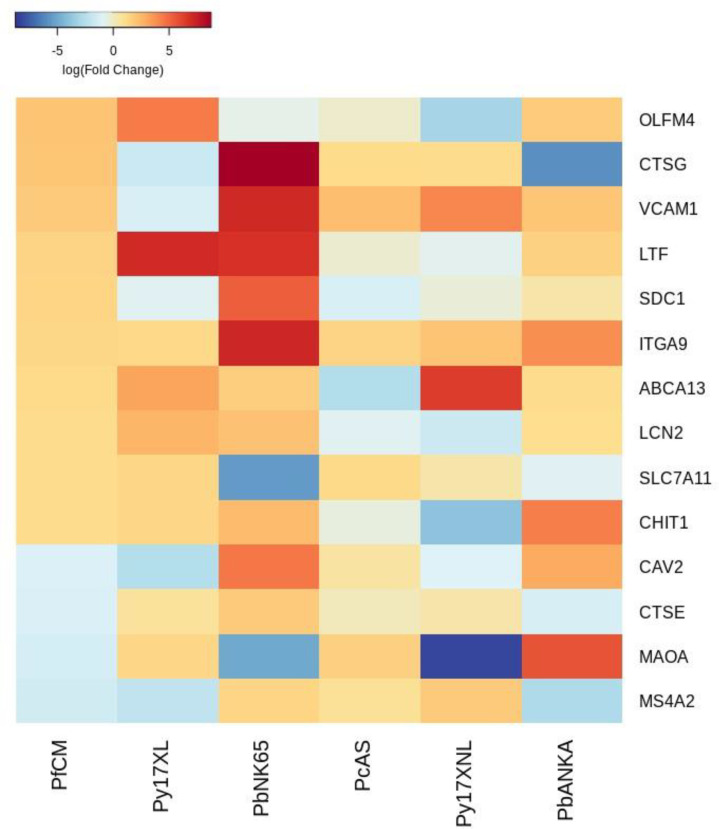
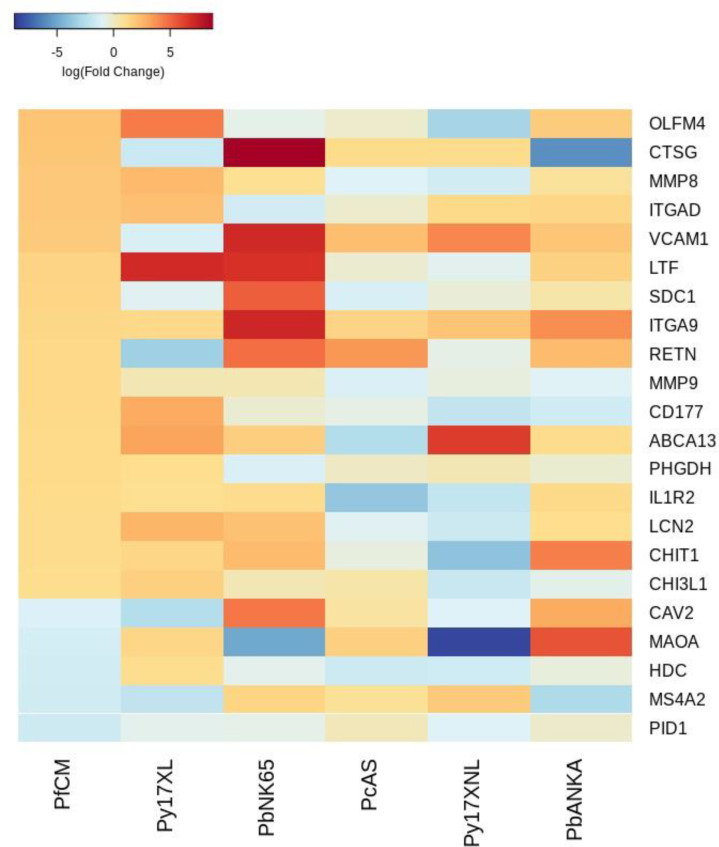
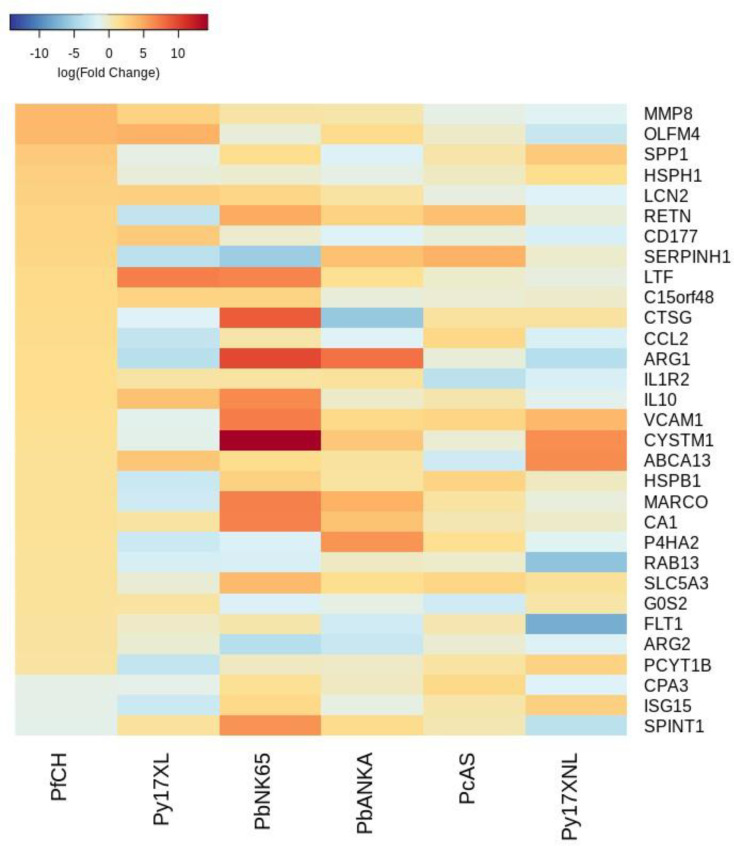
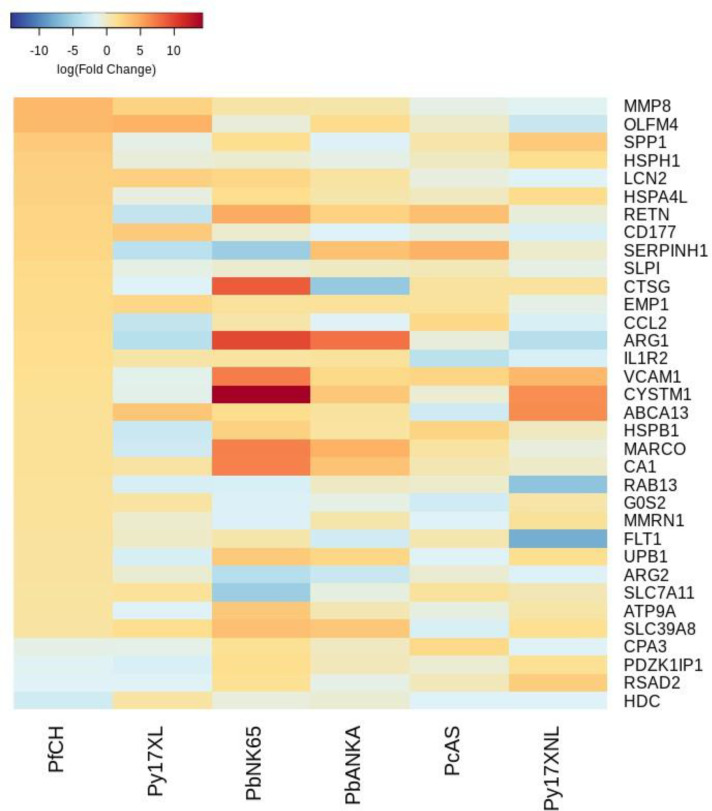
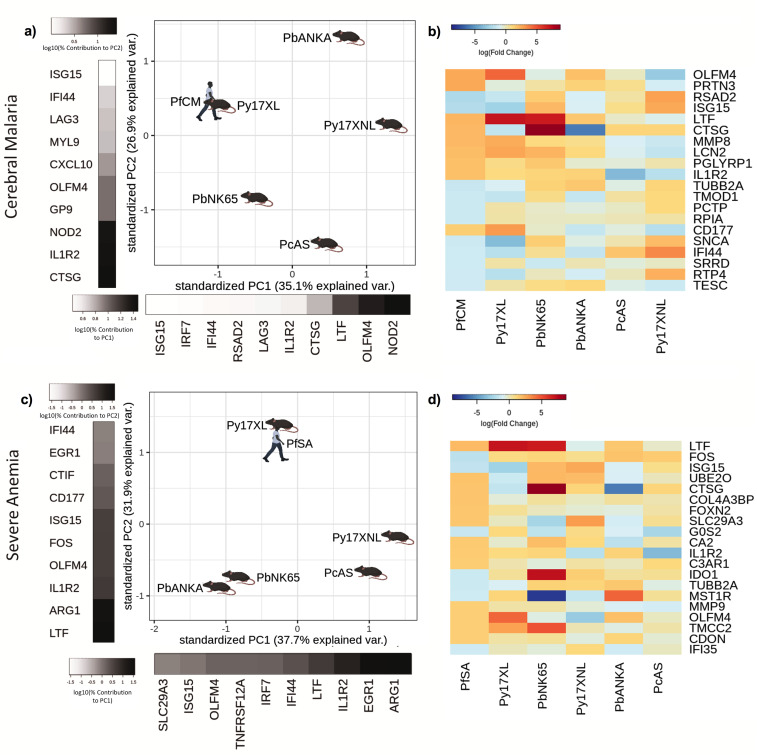
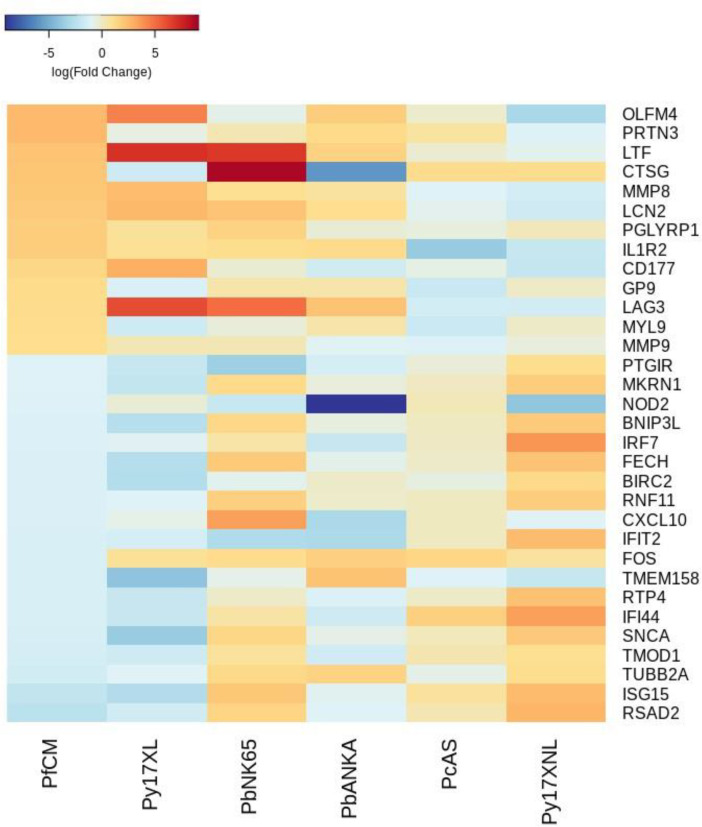
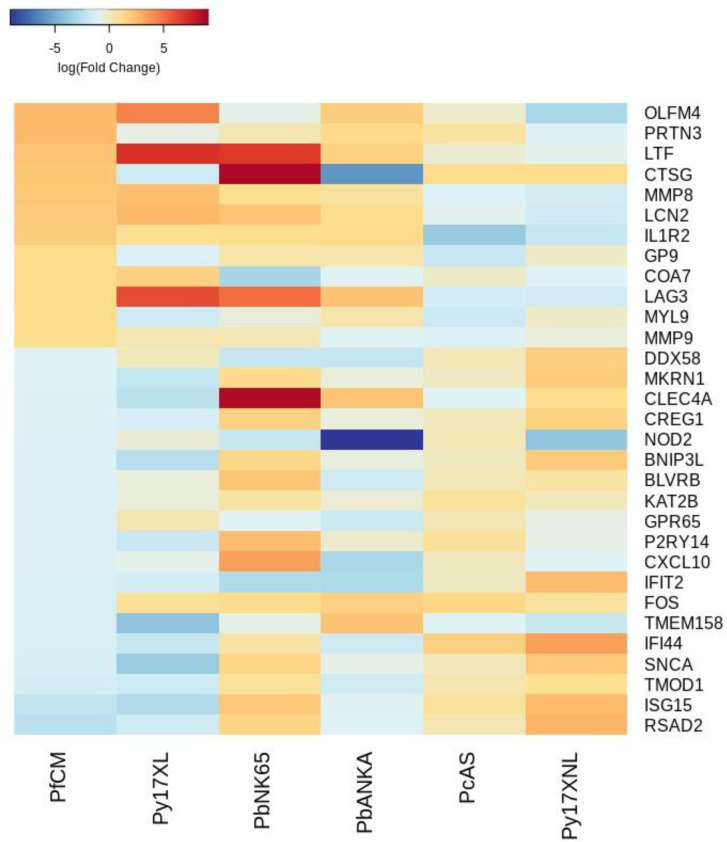
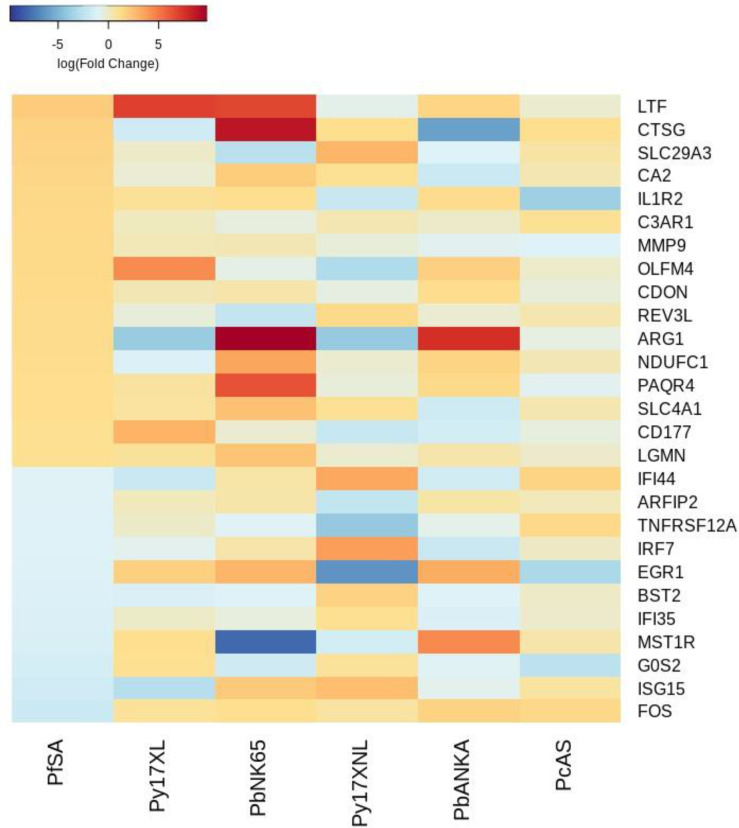
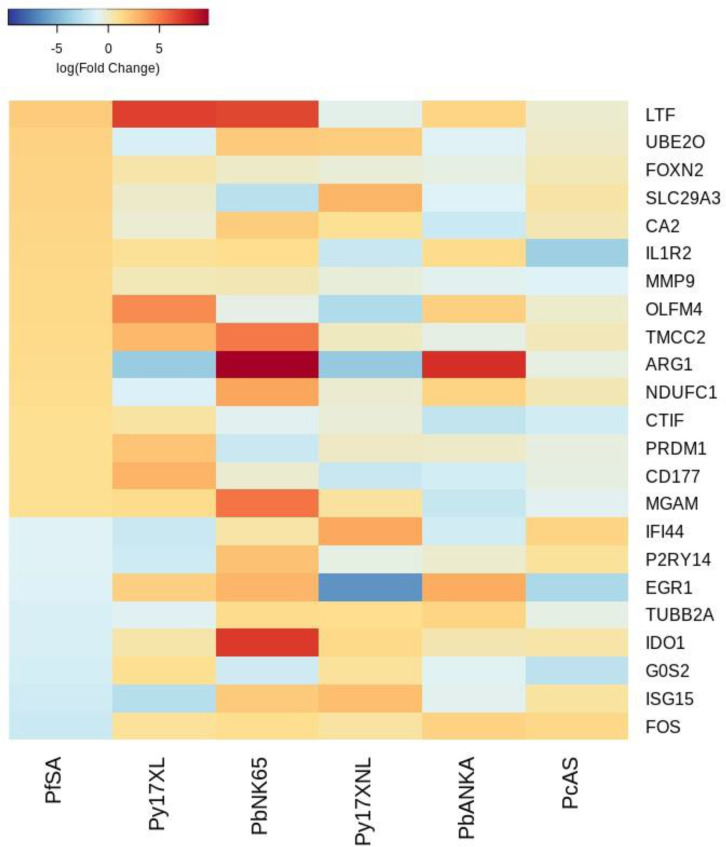
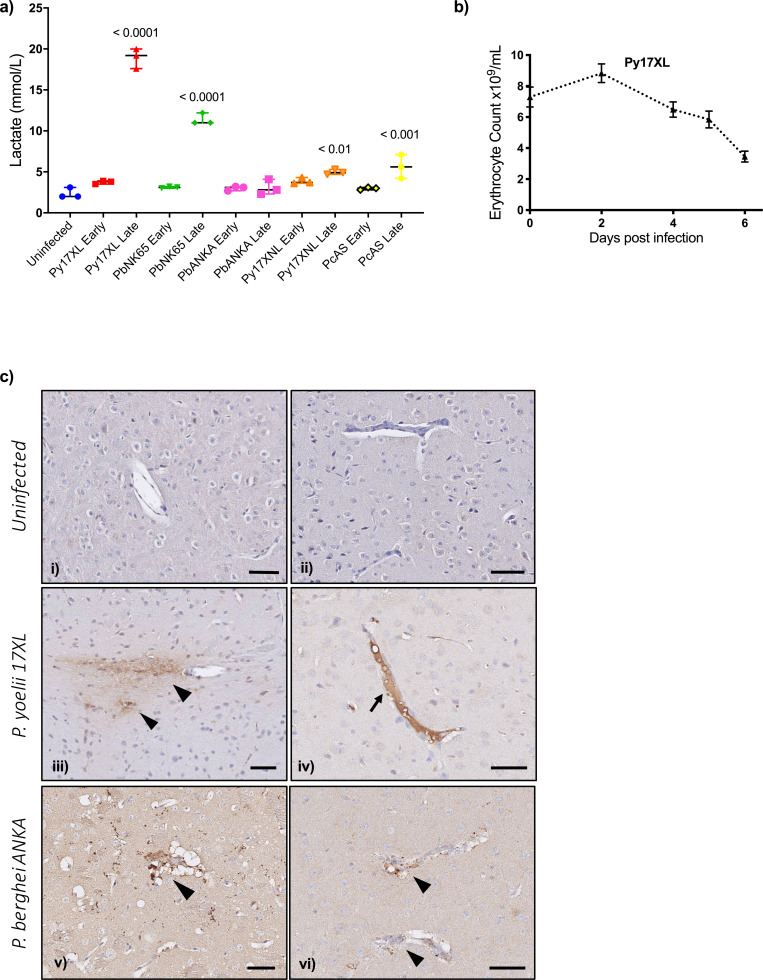
Recent initiatives to improve translation of findings from animal models to human disease have focussed on reproducibility but quantifying the relevance of animal models remains a challenge. Here, we use comparative transcriptomics of blood to evaluate the systemic host response and its concordance between humans with different clinical manifestations of malaria and five commonly used mouse models. Plasmodium yoelii 17XL infection of mice most closely reproduces the profile of gene expression changes seen in the major human severe malaria syndromes, accompanied by high parasite biomass, severe anemia, hyperlactatemia, and cerebral microvascular pathology. However, there is also considerable discordance of changes in gene expression between the different host species and across all models, indicating that the relevance of biological mechanisms of interest in each model should be assessed before conducting experiments. These data will aid the selection of appropriate models for translational malaria research, and the approach is generalizable to other disease models.

Keywords: genetics; genomics; malaria; mouse; mouse models; transcriptomics.


Conflict of interest statement

AG, CD, PS, HL, MK, AC No competing interests declared

Figures

Figure 1.
Figure 1.. Course of infection in five mouse malaria models.
Comparison of parasitemia (a–e) and change in weight (as percentage of baseline weight) (f–j) for 8-week-old C57BL/6J female wild-type mice infected with: Plasmodium yoelii 17XL, P. berghei ANKA, P. berghei NK65, P. yoelii 17XNL, and P. chabaudi AS, respectively. Points show mean, and bars show SD, for n=6 mice (up to and including time point of first signs of ill health, dashed vertical line) and n=3 mice (after dashed vertical line) for each infection. † indicates humane endpoint for lethal infections. Severity scoring for each infection shown in Figure 1—figure supplement 1, and individual mouse parasitemia and weights shown in Figure 1—source data 1.
Figure 1—figure supplement 1.
Figure 1—figure supplement 1.. Severity scoring.
Severity scoring in five mouse malaria models: 8-week-old C57BL/6J female wild-type mice infected with: Plasmodium yoelii 17XL, P. berghei ANKA, P. berghei NK65, P. yoelii 17XNL, and P. chabaudi AS, respectively. Points show mean, and bars show SD, for n=6 mice (up to and including time point of first signs of ill health, dashed vertical line) and n=3 mice (after dashed vertical line) for each infection.
Figure 2.
Figure 2.. Comparison of host differential gene expression in human uncomplicated malaria and early stage illness in five mouse malaria models.
(a) Schematic illustration of the comparative transcriptomic analysis. (b, d) Principal component analysis (PCA) plots generated using rank-normalized log-fold change (logFC) values from the human and mouse differential expression analyses. Only genes with 1:1 mouse and human orthologs and with absolute logFC value greater than 1 in the corresponding human comparison were included. Comparison of changes in gene expression in the mouse models (uninfected vs. early in infection, Supplementary file 12) with those in uncomplicated malaria versus healthy (PfUMH) Beninese children (b, Idaghdour et al., 2012) or Gabonese children (Boldt et al., 2019). The percentage of the total variation explained by principal components 1 and 2 are shown in the axis labels. Greyscale heatmaps parallel to each axis show the contributions of the 10 genes contributing most to the corresponding PC. (c, e) Heatmaps show logFC for the 20 genes with the greatest absolute logFC values in the human differential gene expression analysis, and their orthologs in each mouse model, corresponding to the analyses illustrated in (b) and (d), respectively. Mouse models are ordered left to right in order of increasing dissimilarity to the human disease, based on the Euclidian distance calculated from all principal components (Supplementary file 13). The rows (genes) are ordered by absolute log-fold change in the human comparison in descending order. n=3 for early and n=3 for late time point in each mouse model; n=93 UM, n=61 controls (Beninese children, Idaghdour et al.), n=5 pools UM and n=5 pools healthy control samples (each pool contained RNA from four Gabonese children with the same phenotype, Boldt et al.). Full heatmaps for the expression of genes contributing most to the first two principal components in humans and each mouse model shown in Figure 2—figure supplements 1–4. The mouse model abbreviations are as follows: PbNK65 (P. berghei NK65), PbANKA (P. berghei ANKA), PcAS (P. chabaudi AS), Py17XL (P. yoelii 17XL), and Py17XNL (P. yoelii 17XNL).
Figure 2—figure supplement 1.
Figure 2—figure supplement 1.. Additional heatmaps for Figure 2.
The logFC values of all the genes contributing greater than 0.1% to Principal Component 1 (PC1) of the corresponding PCA plot (Figure 2b) were extracted for the human and each mouse comparison and used to generate this heatmap. The sample rows of this plot are ordered according to increasing Euclidean distance from the human. This corresponds to the Idaghdour et al. data set comparative transcriptomics results.
Figure 2—figure supplement 2.
Figure 2—figure supplement 2.. Additional heatmaps for Figure 2.
The logFC values of all the genes contributing greater than 0.1% to Principal Component 2 (PC2) of the corresponding PCA plot (Figure 2b) were extracted for the human and each mouse comparison and used to generate this heatmap. The sample rows of this plot are ordered according to increasing Euclidean distance from the human. This corresponds to the Idaghdour et al. data set comparative transcriptomics results.
Figure 2—figure supplement 3.
Figure 2—figure supplement 3.. Additional heatmaps for Figure 2.
The logFC values of all the genes contributing greater than 0.1% to Principal Component 1 (PC1) of the corresponding PCA plot (Figure 2d) were extracted for the human and each mouse comparison and used to generate this heatmap. The sample rows of this plot are ordered according to increasing Euclidean distance from the human. This corresponds to the Boldt et al. data set comparative transcriptomics results.
Figure 2—figure supplement 4.
Figure 2—figure supplement 4.. Additional heatmaps for Figure 2.
The logFC values of all the genes contributing greater than 0.1% to Principal Component 2 (PC2) of the corresponding PCA plot (Figure 2d) were extracted for the human and each mouse comparison and used to generate this heatmap. The sample rows of this plot are ordered according to increasing Euclidean distance from the human. This corresponds to the Boldt et al. data set comparative transcriptomics results.
Figure 3.
Figure 3.. Comparison of host differential gene expression in three severe malaria phenotypes in Gambian Children and five mouse malaria models.
(a) Schematic illustration of the comparative transcriptomic analysis. (b, d, f) Principal component analysis (PCA) plots generated using rank-normalized log-fold change values from the human and mouse differential expression analyses. Only genes with 1:1 mouse and human orthologs and with absolute logFC value greater than 1 in the corresponding human comparison were included. Comparison of changes in gene expression in the mouse models with those in human hyperlactatemia (PfHL) (b), cerebral malaria (PfCM) (d), or human hyperlactatemia plus cerebral malaria phenotype (PfCH) (f). The percentage of the total variation explained by principal components 1 and 2 are shown in the axis labels. Grayscale heatmaps parallel to each axis show the contributions of the 10 genes contributing most to the corresponding PC (c, e, g). Heatmaps show logFC for the 20 genes with the greatest absolute logFC values in the human differential gene expression analysis, and their orthologs in each mouse model, corresponding to the analyses illustrated in (b), (d), and (f), respectively. Mouse models are ordered left to right in order of increasing dissimilarity to the human disease, based on the Euclidian distance calculated from all principal components (Supplementary file 13). The rows (genes) are ordered by absolute logFC in the human comparison in descending order. n=3 for early and n=3 for late time point in each mouse model; n=21 Uncomplicated, n=8 HL, n=5 CM, n=12 CH. Full heatmaps for the expression of genes contributing most to the first two principal components in humans and each mouse model shown in Figure 3—figure supplements 1–6. The mouse model abbreviations are as follows: PbNK65 (Plasmodium berghei NK65), PbANKA (P. berghei ANKA), PcAS (P. chabaudi AS), Py17XL (P. yoelii 17XL), and Py17XNL (P. yoelii 17XNL).
Figure 3—figure supplement 1.
Figure 3—figure supplement 1.. Additional heatmaps for Figure 3.
The logFC values of all the genes contributing greater than 0.1% to Principal Component 1 (PC1) of the corresponding PCA plot (Figure 3b) were extracted for the human and each mouse comparison and used to generate this heatmap. The sample rows of this plot are ordered according to increasing Euclidean distance from the human. This corresponds to the human RNA-Seq hyperlactatemia data set comparative transcriptomics results.
Figure 3—figure supplement 2.
Figure 3—figure supplement 2.. Additional heatmaps for Figure 3.
The logFC values of all the genes contributing greater than 0.1% to Principal Component 2 (PC2) of the corresponding PCA plot (Figure 3b) were extracted for the human and each mouse comparison and used to generate this heatmap. The sample rows of this plot are ordered according to increasing Euclidean distance from the human. This corresponds to the human RNA-Seq hyperlactatemia data set comparative transcriptomics results.
Figure 3—figure supplement 3.
Figure 3—figure supplement 3.. Additional heatmaps for Figure 3.
The logFC values of all the genes contributing greater than 0.1% to Principal Component 1 (PC1) of the corresponding PCA plot (Figure 3d) were extracted for the human and each mouse comparison and used to generate this heatmap. The sample rows of this plot are ordered according to increasing Euclidean distance from the human. This corresponds to the human RNA-Seq cerebral malaria data set comparative transcriptomics results.
Figure 3—figure supplement 4.
Figure 3—figure supplement 4.. Additional heatmaps for Figure 3.
The logFC values of all the genes contributing greater than 0.1% to Principal Component 2 (PC2) of the corresponding PCA plot (Figure 3d) were extracted for the human and each mouse comparison and used to generate this heatmap. The sample rows of this plot are ordered according to increasing Euclidean distance from the human. This corresponds to the human RNA-Seq cerebral malaria data set comparative transcriptomics results.
Figure 3—figure supplement 5.
Figure 3—figure supplement 5.. Additional heatmaps for Figure 3.
The logFC values of all the genes contributing greater than 0.1% to Principal Component 1 (PC1) of the corresponding PCA plot (Figure 3f) were extracted for the human and each mouse comparison and used to generate this heatmap. The sample rows of this plot are ordered according to increasing Euclidean distance from the human. This corresponds to the human RNA-Seq cerebral malaria+hyperlactatemia data set comparative transcriptomics results.
Figure 3—figure supplement 6.
Figure 3—figure supplement 6.. Additional heatmaps for Figure 3.
The logFC values of all the genes contributing greater than 0.1% to Principal Component 2 (PC2) of the corresponding PCA plot (Figure 3f) were extracted for the human and each mouse comparison and used to generate this heatmap. The sample rows of this plot are ordered according to increasing Euclidean distance from the human. This corresponds to the human RNA-Seq cerebral malaria+hyperlactatemia data set comparative transcriptomics results.
Figure 4.
Figure 4.. Comparison of host differential gene expression in two severe malaria phenotypes in Gabonese Children and five mouse malaria models.
(a, c) Principal component analysis (PCA) plots generated using rank-normalized log-fold change values from the human and mouse differential expression analyses. Only genes with 1:1 mouse and human orthologs and with absolute logFC value greater than 1 in the corresponding human comparison were included. Comparison of changes in gene expression in the mouse models with those in human cerebral malaria (PfCM) (a) and severe anemia (PfSA) (c). The percentage of the total variation explained by principal components 1 and 2 are shown in the axis labels. Grayscale heatmaps parallel to each axis show the contributions of the 10 genes contributing most to the corresponding PC (b, d). Heatmaps show logFC for the 20 genes with the greatest absolute log-fold change values in the human differential gene expression analysis, and their orthologs in each mouse model, corresponding to the analyses illustrated in (a) and (c). Mouse models are ordered left to right in order of increasing dissimilarity to the human disease, based on the Euclidian distance calculated from all principal components (Supplementary file 13). The rows (genes) are ordered by absolute log-fold change in the human comparison in descending order. n=3 for early and n=3 for late time point in each mouse model; n=5 pooled samples uncomplicated (UM), n=5 pooled samples CM, n=5 pooled samples SA (each pool contained RNA from four individuals with the same phenotype). Full heatmaps for the expression of genes contributing most to the first two principal components in humans and each mouse model shown in Figure 4—figure supplements 1–4. The mouse model abbreviations are as follows: PbNK65 (Plasmodium berghei NK65), PbANKA (P. berghei ANKA), PcAS (P. chabaudi AS), Py17XL (P. yoelii 17XL), and Py17XNL (P. yoelii 17XNL).
Figure 4—figure supplement 1.
Figure 4—figure supplement 1.. Additional heatmaps for Figure 4.
The logFC values of all the genes contributing greater than 0.1% to Principal Component 1 (PC1) of the corresponding PCA plot (Figure 4a) were extracted for the human and each mouse comparison and used to generate this heatmap. The sample rows of this plot are ordered according to increasing Euclidean distance from the human. This corresponds to the Boldt et al. cerebral malaria comparative transcriptomics results.
Figure 4—figure supplement 2.
Figure 4—figure supplement 2.. Additional heatmaps for Figure 4.
The logFC values of all the genes contributing greater than 0.1% to Principal Component 2 (PC2) of the corresponding PCA plot (Figure 4a) were extracted for the human and each mouse comparison and used to generate this heatmap. The sample rows of this plot are ordered according to increasing Euclidean distance from the human. This corresponds to the Boldt et al. cerebral malaria comparative transcriptomics results.
Figure 4—figure supplement 3.
Figure 4—figure supplement 3.. Additional heatmaps for Figure 4.
The logFC values of all the genes contributing greater than 0.1% to Principal Component 1 (PC1) of the corresponding PCA plot (Figure 4c) were extracted for the human and each mouse comparison and used to generate this heatmap. The sample rows of this plot are ordered according to increasing Euclidean distance from the human. This corresponds to the Boldt et al. severe anemia comparative transcriptomics results.
Figure 4—figure supplement 4.
Figure 4—figure supplement 4.. Additional heatmaps for Figure 4.
The logFC values of all the genes contributing greater than 0.1% to Principal Component 2 (PC2) of the corresponding PCA plot (Figure 4c) were extracted for the human and each mouse comparison and used to generate this heatmap. The sample rows of this plot are ordered according to increasing Euclidean distance from the human. This corresponds to the Boldt et al. severe anemia comparative transcriptomics results.
Figure 5.
Figure 5.. Pathophysiological features of rodent malaria infections.
(a) Lactate concentration in blood (mmol/L) in mice, uninfected, or at the early or late stage of each malaria parasite infection (n=3 for each infection time point). Error bars show median with range, One-way ANOVA p-value<0.0001, p-values for post hoc Dunnett’s multiple comparisons against uninfected mice are shown within the plot. (b) Erythrocyte counts from Plasmodium yoelii 17XL infected mice, n=9, representative of three experiments, repeated measures ANOVA p-value<0.01. (c) Representative histological specimens of brain with fibrinogen staining to identify vascular leak in mice uninfected (i, ii), infected with P. yoelii 17XL (iii, iv), and infected P. berghei ANKA (v, vi) collected at the late stage (humane endpoint) of infection. Arrowheads identify extravascular fibrinogen indicating leak from the vasculature. Arrow points to strong intravascular fibrinogen staining (iv) suggestive of microthrombus. Representative images from analysis of uninfected mouse brains n=3; P. yoelii 17XL-infected mouse brains n=5; P. berghei ANKA-infected mouse brains n=4; Scale bar: 50 µm. Eight-week-old wild-type female C57BL/6J mice were used in all experiments. Individual mouse lactate measurements and erythrocyte counts shown in Figure 5—source data 1.

Similar articles

Cited by

References

    1. Achtman AH, Khan M, MacLennan ICM, Langhorne J. Plasmodium chabaudi chabaudi infection in mice induces strong B cell responses and striking but temporary changes in splenic cell distribution. Journal of Immunology. 2003;171:317–324. doi: 10.4049/jimmunol.171.1.317. - DOI - PubMed
    1. Aitken EH, Alemu A, Rogerson SJ. Neutrophils and Malaria. Frontiers in Immunology. 2018;9:3005. doi: 10.3389/fimmu.2018.03005. - DOI - PMC - PubMed
    1. Akkaya M, Bansal A, Sheehan PW, Pena M, Cimperman CK, Qi CF, Yazew T, Otto TD, Billker O, Miller LH, Pierce SK. Testing the impact of a single nucleotide polymorphism in a Plasmodium berghei ApiAP2 transcription factor on experimental cerebral malaria in mice. Scientific Reports. 2020;10:13630. doi: 10.1038/s41598-020-70617-7. - DOI - PMC - PubMed
    1. Allantaz F, Cheng DT, Bergauer T, Ravindran P, Rossier MF, Ebeling M, Badi L, Reis B, Bitter H, D’Asaro M, Chiappe A, Sridhar S, Pacheco GD, Burczynski ME, Hochstrasser D, Vonderscher J, Matthes T. Expression profiling of human immune cell subsets identifies miRNA-mRNA regulatory relationships correlated with cell type specific expression. PLOS ONE. 2012;7:e29979. doi: 10.1371/journal.pone.0029979. - DOI - PMC - PubMed
    1. Amani V, Vigário AM, Belnoue E, Marussig M, Fonseca L, Mazier D, Rénia L. Involvement of IFN-gamma receptor-medicated signaling in pathology and anti-malarial immunity induced by Plasmodium berghei infection. European Journal of Immunology. 2000;30:1646–1655. doi: 10.1002/1521-4141(200006)30:6<1646::AID-IMMU1646>3.0.CO;2-0. - DOI - PubMed

Publication types

Associated data