. 2022 Feb 1;135(3):jcs259430.
doi: 10.1242/jcs.259430. Epub 2022 Feb 3.

Organization and dynamics of the cortical complexes controlling insulin secretion in β-cells

Affiliations

Organization and dynamics of the cortical complexes controlling insulin secretion in β-cells

Ivar Noordstra et al. J Cell Sci. .

Abstract

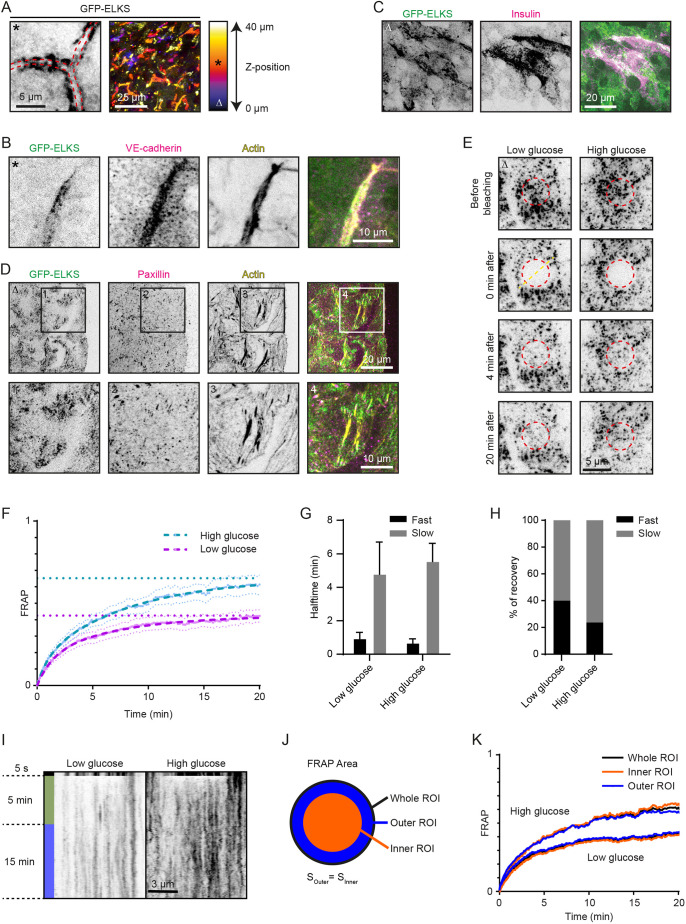
Insulin secretion in pancreatic β-cells is regulated by cortical complexes that are enriched at the sites of adhesion to extracellular matrix facing the vasculature. Many components of these complexes, including bassoon, RIM, ELKS and liprins, are shared with neuronal synapses. Here, we show that insulin secretion sites also contain the non-neuronal proteins LL5β (also known as PHLDB2) and KANK1, which, in migrating cells, organize exocytotic machinery in the vicinity of integrin-based adhesions. Depletion of LL5β or focal adhesion disassembly triggered by myosin II inhibition perturbed the clustering of secretory complexes and attenuated the first wave of insulin release. Although previous analyses in vitro and in neurons have suggested that secretory machinery might assemble through liquid-liquid phase separation, analysis of endogenously labeled ELKS in pancreatic islets indicated that its dynamics is inconsistent with such a scenario. Instead, fluorescence recovery after photobleaching and single-molecule imaging showed that ELKS turnover is driven by binding and unbinding to low-mobility scaffolds. Both the scaffold movements and ELKS exchange were stimulated by glucose treatment. Our findings help to explain how integrin-based adhesions control spatial organization of glucose-stimulated insulin release.

Keywords: Cell cortex; Focal adhesion; Insulin secretion; Knock-in mouse; Liquid–liquid phase separation; Single-molecule imaging.


Conflict of interest statement

Competing interests The authors declare no competing or financial interests.

Figures

Fig. 1.
Fig. 1.
LL5β and KANK1 colocalize with CAZ components and insulin granules in pancreatic β-cell lines and dispersed human pancreatic islets. (A) Staining for insulin (green) and RIM (RIM1 and RIM2; magenta) in INS-1E cells imaged with total internal reflection fluorescence microscopy (TIRFM). (B) Quantification of colocalization between insulin and indicated proteins in INS-1E cells using Pearson's correlation coefficient between the two channels. For analysis, intracellular regions of interest (ROIs) of ∼25 µm2 were used. For RIM, n=15 ROIs; for bassoon, n=21 ROIs; 90° indicates a 90° rotation of one of the two analyzed channels before analysis; error bars, s.e.m. (C) Staining for LL5β (green) and RIM and ELKS (magenta) in INS-1E cells imaged with TIRFM. (D) Quantification of colocalization between LL5β and indicated proteins in INS-1E cells. Analysis and display as in B. For all conditions, n=15–33 ROIs. (E) Stimulated emission depletion (STED) microscopy images of LL5β (green) and ELKS, KANK1 and RIM (magenta) in INS-1E cells. Intensity profiles along dotted lines are plotted in graphs. Representative images of three experiments are shown. (F) Co-immunoprecipitation assay from INS-1E cell extracts using antibodies against endogenous ELKS. Rabbit IgG was used as a control. Extr., cell extract. Representative images of three blots are shown. (G) Staining for insulin or LL5β (green) and RIM and ELKS (magenta) in EndoC-βH1 cells imaged with TIRFM. (H) Quantification of colocalization between insulin or LL5β and indicated proteins in EndoC-βH1 cells using Pearson's correlation coefficient between the two channels. Analysis and display as in B. For all conditions, n=27–30 ROIs. (I) Staining for insulin or LL5β (green) and RIM and ELKS (magenta) in dispersed human pancreatic islets imaged with TIRFM. (J) Quantification of colocalization between insulin or LL5β and indicated proteins in dispersed human pancreatic islets using Pearson's correlation coefficient between the two channels. Analysis and display as in B. For all conditions, n=14–22 ROIs.
Fig. 2.
Fig. 2.
LL5β is required for clustering of insulin docking complexes and insulin release. (A) Staining for LL5β and RIM in INS-1E cells transfected with control siRNA or siRNAs against LL5β imaged with TIRFM. (B) Quantification of number of LL5β puncta in INS-1E cells treated as in A. For all conditions, n=18 ROIs (which represent ∼1 cell each); ***P<0.001 (one-way ANOVA followed by Dunnett's post-test). Single data points are plotted. Horizontal line, mean; error bars, s.e.m. (C) Quantification of number of RIM puncta in INS-1E cells treated as in A. Analysis and display as in B. For all conditions, n=24–27 ROIs. ns, not significant. (D) Quantification of RIM clustering in INS-1E cells treated and stained as in A. Data are plotted as a frequency distribution of distances between nearest puncta. For all conditions, n=24–27 ROIs (which represent ∼1 cell each). Dots represent bin averages; lines represent medium locally weighted scatterplot smoothing (LOWESS) curves; error bars, s.e.m. (E) Weighted averages from the RIM clustering quantification shown in D. ***P<0.001 (one-way ANOVA followed by Dunnett′s post-test). (F) Staining for insulin and RIM in INS-1E cells treated as in A, stimulated with 25 mM glucose as indicated and imaged with TIRFM. (G) Quantification of docked insulin vesicles in INS-1E cells treated and stained as in F. Control, n=18–22 ROIs (which represent ∼4 cells each); LL5β #1, n=28–32; LL5β #2, n=28; ***P<0.001; ns, not significant (Mann–Whitney U-test). Single data points are plotted. Horizontal line, mean; error bars, s.e.m. (H) Staining for insulin (white) and DNA (blue) in INS-1E cells treated as in F and imaged with confocal microscopy. Image focal plane is indicated by red striped line in scheme at top. (I) Quantification of total insulin vesicle distribution along the z-axis in INS-1E cells treated and stained as in F. For all conditions, n=16 ROIs (which represent ∼4 cells each). Red shaded area indicates secreted insulin fraction at basal side of the cells. Error bars, s.e.m.
Fig. 3.
Fig. 3.
Actomyosin contractility controls the distribution of the cortical insulin docking complexes and insulin release. (A) Staining for LL5β (green) and phosphorylated FAK (pFAKY397, magenta) in INS-1E cells stimulated with 25 mM glucose as indicated and imaged with TIRFM. (B) Single-molecule localization microscopy (SMLM) image of actin (blue), paxillin (green) and RIM (magenta) in untreated INS-1E cells. Actin was detected using Peptide-PAINT (Points Accumulation for Imaging in Nanoscale Topography) with LifeAct–mNeonGreen, while paxillin and RIM were detected using DNA-PAINT with antibodies against the endogenous proteins. (C) SMLM image of actin (green) detected as in B and TIRFM image of insulin (magenta) in INS-1E cells stimulated with 25 mM glucose for 5 min. Representative images of three experiments are shown in B and C. (D) Quantification of focal adhesion size in INS-1E cells treated as in A. Untreated, n=1040 focal adhesions; 2 min glucose, n=948 focal adhesions; 5 min glucose, n=939 focal adhesions; ***P<0.001; ns, not significant (one-way ANOVA followed by Tukey's post-test); error bars, s.e.m. (E) Western blot analysis of LL5β and pFAKY397 in INS-1E cells treated as in A. Representative images of two blots are shown. (F) Quantification of LL5β localization relative to focal adhesions in INS-1E cells treated and stained as in A. LL5β fluorescence intensity (LL5β recruitment) was measured in a 1 µm-broad area around focal adhesions and binned into ‘high’ LL5β recruitment (top 75% intensity values) or ‘low’ LL5β recruitment (the remaining intensity values). Only data points exceeding 1.5× LL5β fluorescent background signal were included in plots. Single data points for ‘low’ LL5β recruitment are plotted. For all conditions, n=10 ROIs with 45–73 focal adhesions per ROI. ***P<0.001; ns, not significant (one-way ANOVA followed by Dunnett's post-test); error bars, s.e.m. (G) Staining for actin (green) and paxillin (magenta), and insulin (gray) imaged with widefield microscopy (actin, paxillin) and TIRFM (insulin) in INS-1E cells treated with 50 µM blebbistatin for 1 h and subsequently stimulated with glucose as indicated. (H) Staining for RIM in INS-1E cells treated with 50 µM blebbistatin for 1 h and imaged with TIRFM. (I) Quantification of RIM clustering in INS-1E cells treated and stained as in H. Analysis and display as in Fig. 2D. For all conditions, n=24 ROIs. (J) Weighted averages from the RIM clustering quantification shown in I. Analysis and display as in Fig. 2E. (K) Quantification of docked insulin vesicles in INS-1E cells treated and stained as in G. Analysis and display as in Fig. 2G. For all conditions, n=18 ROIs. (L) Staining for insulin in INS-1E cells treated with 50 µM blebbistatin for 1 h and subsequently stimulated with glucose as indicated and imaged with TIRFM. Representative images of three experiments are shown. (M) Quantification of total insulin vesicle distribution along the z-axis in INS-1E cells treated and stained as in L. Analysis and display as in Fig. 2H. For all conditions, n=16 ROIs.
Fig. 4.
Fig. 4.
Analysis of the distribution and dynamics of the endogenous cortical insulin secretion complexes in mouse pancreatic islets. (A) Localization of GFP–ELKS inside a mouse pancreatic islet imaged with confocal microscopy. Left panel, red striped lines indicate extracellular space (presumable blood vessel). Right panel, maximum projection of a z-stack. Image colors indicate z-position (see gradient). Asterix in top left corner of the shown image corresponds to its position in the z-stack (indicated in gradient). (B) Staining for VE-cadherin (magenta) and actin (yellow) inside a GFP–ELKS (green)-expressing mouse pancreatic islet imaged with confocal microscopy. Z-position of shown images as in A. (C) Staining for insulin (magenta) in the adherent region of a GFP–ELKS (green)-expressing mouse pancreatic islet imaged with TIRFM. Delta in top left corner of the shown images corresponds to their position in the z-stack (indicated in gradient in A). (D) Staining for paxillin (magenta) and actin (yellow) in the adherent region of a GFP–ELKS (green)-expressing mouse pancreatic islet imaged with TIRFM. Z-position of shown images as in (C). Representative images of three experiments are shown in A–D. (E) FRAP analysis of GFP–ELKS in the adherent region of mouse pancreatic islets stimulated with glucose as indicated and imaged with TIRFM. High glucose (25 mM) was administered 4 h after low glucose (2 mM) starvation 1 h prior to photobleaching. Red dashed circles indicate photobleached regions. Z-position of shown images as in C. (F) Average normalized fluorescence intensity recovery and fitted curves (dashed lines) after photobleaching of GFP-ELKS in mouse pancreatic islets treated as in E (low glucose, n=15 FRAP areas; high glucose, n=16 FRAP areas). Error bars represent s.e.m., straight horizontal lines represent recovery plateau derived from the fitting. (G,H) Fluorescence recovery halftimes (G) and relative fraction (H) of fast and slow exponential components from the fit shown in F. Error bars represent fitting uncertainty. (I) Representative kymographs from three experiments of GFP–ELKS FRAP along the straight line crossing the center of the bleached area (illustrated as dashed yellow line in E). (J) Illustration of the original bleaching ROI division into outer and inner areas of equal area for FRAP curves comparison shown in K. (K) FRAP curves corresponding to the full bleaching ROI and its outer and inner areas, as shown in J.
Fig. 5.
Fig. 5.
Single-molecule analysis of GFP-ELKS cluster motility and stoichiometry in mouse pancreatic islets. (A) Representative color coded maximum intensity projection (200 frames, 5 s per frame) of a time-lapse movie of GFP–ELKS clusters (left panel) and their corresponding trajectories (middle panel). Right panel shows maximum intensity projection of a stack of kymographs built along horizontal lines of the area shown in the left panel. (B) Average MSD of GFP–ELKS clusters trajectories. Low glucose, n=9658 tracks; high glucose n=9586. Error bars represent s.e.m. Dashed lines show linear fits MSD(τ)=4Dτ2. Calculated diffusion coefficients are equal to 5.6×10⁻⁵ µm2/s for low and 7.5×10⁻⁵ µm2/s for high glucose conditions. (C) Schematic representation of experimental design for observation of single GFP–ELKS molecules. (D) Average MSD of the fast fraction of single GFP–ELKS molecule trajectories. Low glucose, n=3484 tracks; high glucose, n=6209 tracks. Error bars represent s.e.m. Dashed lines show linear fits [MSD(τ)=4Dτ2]. Calculated diffusion coefficients are equal to 0.37 µm2/s for low and 0.35 µm2/s for high glucose conditions. (E) Average MSD of slow fraction of single GFP–ELKS molecule trajectories. Low glucose, n=4449 tracks; high glucose, n=7689 tracks. Error bars represent s.e.m. Dashed line marks squared displacement of 60 nm, i.e. half the length of GFP–ELKS molecule (119 nm; Sala et al., 2019). (F) Combined heatmap (3D histogram) of MSD values for the slow fraction of single GFP–ELKS molecules and clusters (separated by gray dashed lines). Same datasets as in E and B. Histogram values are normalized by the maximum value of each column, corresponding to each time delay bin. (G) Representative probability density of pre-bleach GFP–ELKS cluster intensities [measured at the first frame, thick blue line, one field of view (FOV), 1095 clusters] fitted to a weighted sum of N-mers of GFP (thick dashed magenta line). The weighted probability densities of individual GFP N-mers intensities are plotted as thin lines. (H) Quantification of GFP–ELKS cluster stoichiometry. Averaged histograms of weights of N-mers of GFP determined from the fitting to the GFP–ELKS clusters intensities. Low glucose, n=6 FOVs; high glucose, n=7 FOVs. Error bars represent s.e.m. Weighted mean values of GFP molecules per cluster for each FOV are shown in the inset (11.0±2.1 for low and 12.7±3.5 for high glucose condition, mean±s.e.m.). (I) Average number of GFP–ELKS molecules present in a cluster; error bars represent mean±s.e.m.
Fig. 6.
Fig. 6.
Schematic representation of secretory sites in pancreatic β-cells. CAZ-specific components are indicated in orange, components that are not present in neurons, in blue, and components shared between neuronal and non-neuronal cells, by both colors.

Similar articles

Cited by

References

    1. Arous, C. and Halban, P. A. (2015). The skeleton in the closet: actin cytoskeletal remodeling in β-cell function. Am. J. Physiol. Endocrinol. Metab. 309, E611-E620. 10.1152/ajpendo.00268.2015 - DOI - PubMed
    1. Arous, C. and Wehrle-Haller, B. (2017). Role and impact of the extracellular matrix on integrin-mediated pancreatic β-cell functions. Biol. Cell 109, 223-237. 10.1111/boc.201600076 - DOI - PubMed
    1. Arous, C., Rondas, D. and Halban, P. A. (2013). Non-muscle myosin IIA is involved in focal adhesion and actin remodelling controlling glucose-stimulated insulin secretion. Diabetologia 56, 792-802. 10.1007/s00125-012-2800-1 - DOI - PubMed
    1. Asperti, C., Astro, V., Totaro, A., Paris, S. and de Curtis, I. (2009). Liprin-alpha1 promotes cell spreading on the extracellular matrix by affecting the distribution of activated integrins. J. Cell Sci. 122, 3225-3232. 10.1242/jcs.054155 - DOI - PubMed
    1. Asperti, C., Pettinato, E. and de Curtis, I. (2010). Liprin-α1 affects the distribution of low-affinity β1 integrins and stabilizes their permanence at the cell surface. Exp. Cell Res. 316, 915-926. 10.1016/j.yexcr.2010.01.017 - DOI - PubMed

Publication types