. 2020 Oct 20;1(1):10.
doi: 10.1186/s43556-020-00010-3.

The bone marrow niche components are adversely affected in sepsis

Affiliations

The bone marrow niche components are adversely affected in sepsis

Fan Yin et al. Mol Biomed. .

Abstract

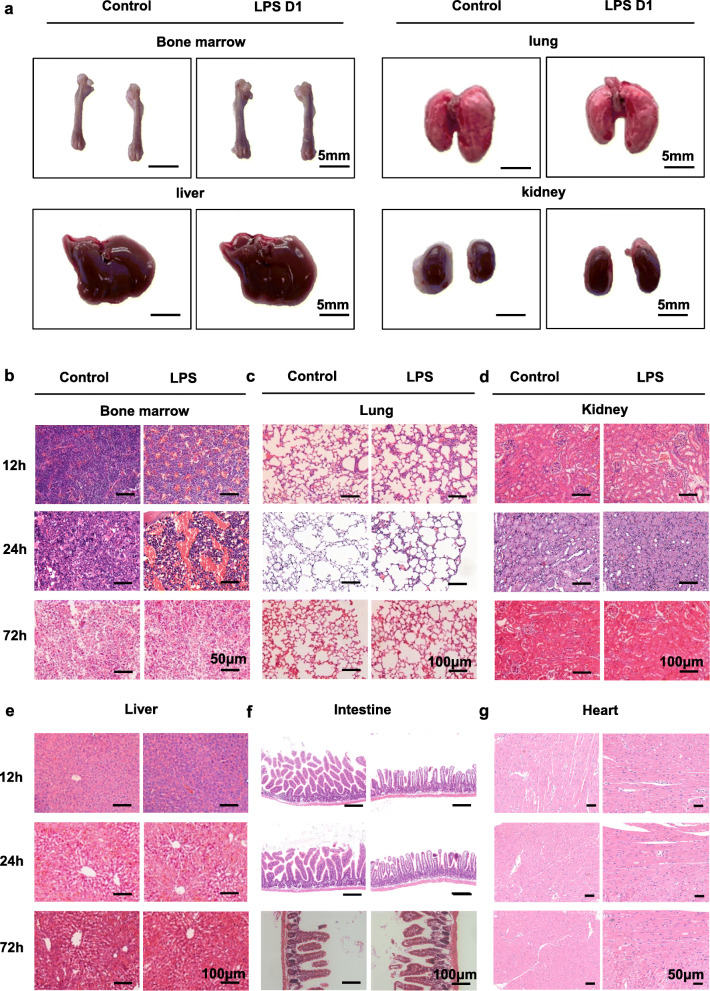
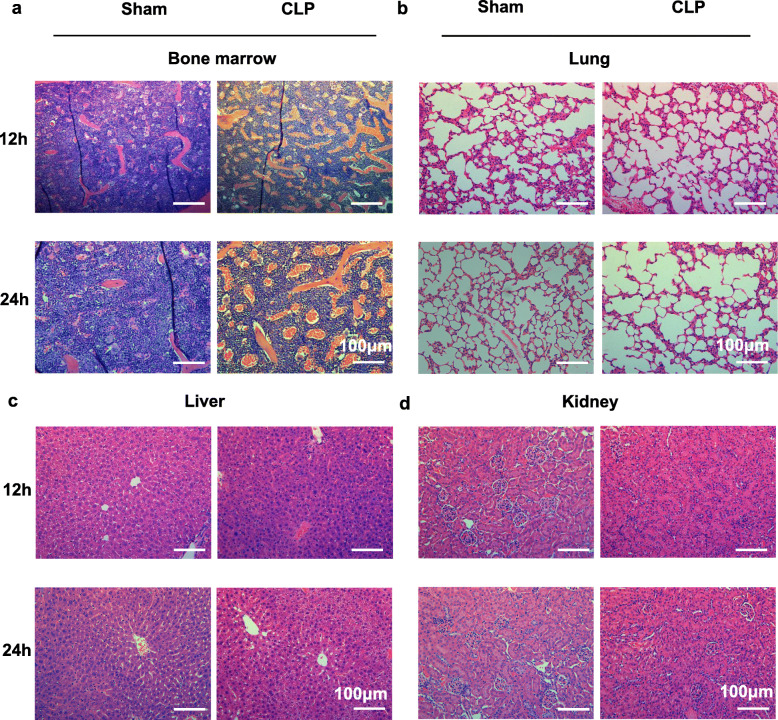
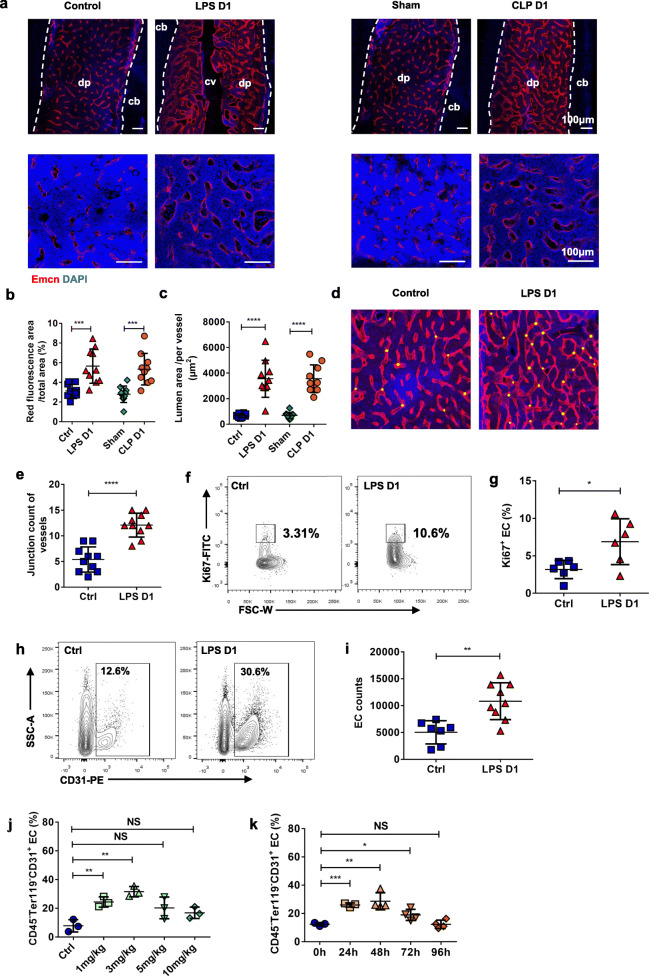
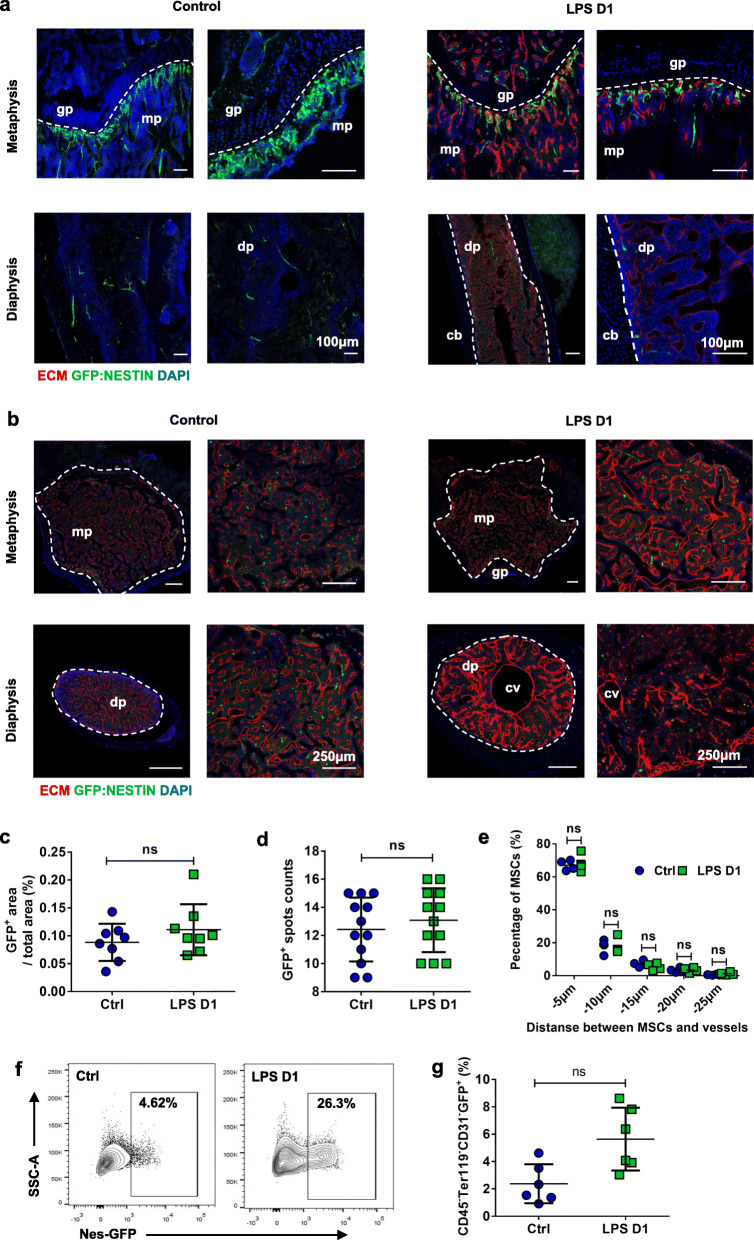
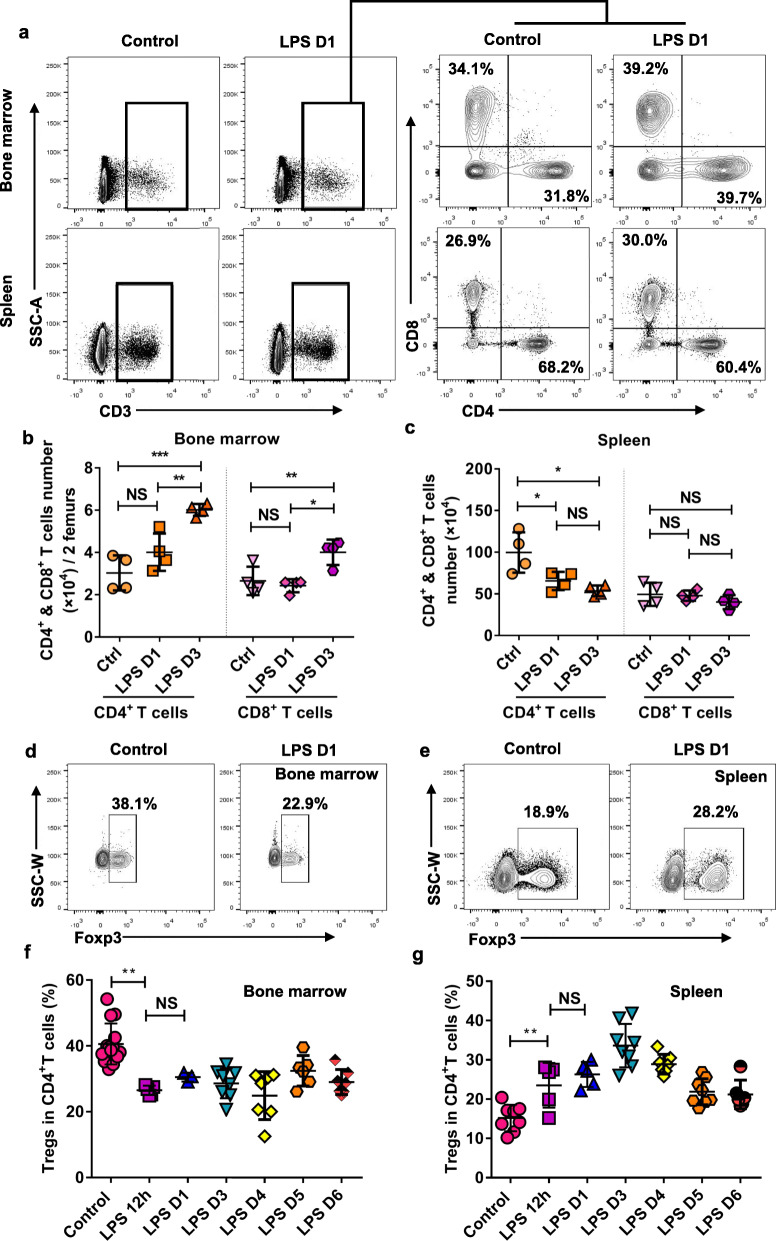
Multiple organ dysfunction is an important cause of death in patients with sepsis. Currently, few studies have focused on the impact of sepsis on bone marrow (BM), especially on the cell components of BM niche. In this study, we performed mouse sepsis models by intraperitoneal injection of LPS and cecal ligation and puncture (CLP). The changes of niche major components in the mouse BM among vascular structures, mesenchymal stem cells and Treg cells were observed and analyzed. The results showed that pathological changes in BM was earlier and more prominent than in other organs, and various cell components of the BM niche changed significantly, of which vascular endothelial cells increased transiently with vascular remodeling and the regulatory T cells decreased over a long period of time. These results indicated that the components of the BM niche underwent series of adaptive changes in sepsis.

Keywords: Bone marrow niche; Lipopolysaccharide (LPS); Mouse model; Sepsis.


Conflict of interest statement

The authors declare that they have no competing interests.

Figures

Fig. 1
Fig. 1
BM undergoes significant histological changes after LPS challenge. a Macroscopic images of BM, lung, liver and kidney from 8-week-old control (day 1 after PBS treatment) and LPS D1 (day 1 after LPS treatment) mice. b, c, d, e, f, g Histological analysis by H&E staining in the BM (BM) (b), lung (c), kidney (d), liver (e), intestine (f) and heart (g) of mice sepsis model prepared by intraperitoneal injection of LPS at 12 h, 24 h and 72 h after treatment. All representative pictures are verified by independent experiments (n = 3), both control and LPS-treated mice have biological replicates (n>5)
Fig. 2
Fig. 2
BM in CLP model exhibits similar changes with LPS stimulation. a, b, c, d Pictures of H&E staining in the BM (a), lung (b), liver (c) and kidney (d) of mice sepsis model prepared by cecal ligation and puncture (CLP) at 12 h and 24 h after operation. All representative pictures are verified by independent experiments (n = 3), both sham-treated and CLP-treated mice have biological replicates (n>5)
Fig. 3
Fig. 3
Sepsis alter the BM Vasculature remodeling. a Representative images of the femur diaphysis stained with anti-endomucin (Emcn) antibody and 4′,6-diamidino-2-phenylindole (DAPI). Control (day 1 after PBS treatment), LPS D1(day 1 after LPS treatment), Sham (day 1 after sham operation), CLP D1 (day 1 after CLP procedure). Diaphysis (dp), compact bone (cb), central vein (cv). b, c Quantification of BM vessels on confocal images of the femur diaphysis showed in (a). Ten mice each group, 3 sections per mouse. d Visualization of femur vessels junctions (yellow dot) in histological images. e Quantitative analysis of junction count of BM vessels showed in (d) between control (n = 10) and LPS-treated (n = 10) mice. Three sections per mouse. f Ki67 staining for detecting proliferation rates of BM ECs. g Percentage of Ki67+ BM ECs in controls (n = 6) and treated mice 1 day after LPS injection (n = 6). h Representative figures shown the percentage of CD45 Ter119 CD31+ ECs in BM. i Percentage of CD45 Ter119 CD31+ BM ECs in controls (n = 7) and treated mice 1 day after LPS injection (n = 9). j Changes of percentage in BM ECs at different concentrations of LPS administration. Three mice in each treatment. Control (Ctrl, PBS treatment). k Changes of percentage in BM ECs at different time after 10 mg/kg LPS administration. Three mice in oh and 24 h, 4 mice in 48 h, 72 h, 96 h. All data represent as means±s.d. *p<0.05, **p<0.01, ***p<0.001, ****p<0.0001, as determined by Student’s t-test. NS, not significant
Fig. 4
Fig. 4
BM MSCs show no significant changes during sepsis. a, b Longitudinally (a) and transverse-shaved (b) confocal images of femur metaphysis and diaphysis stained with anti-Emcn antibody and DAPI in control (PBS treatment) and LPS-treated Nestin-GFP transgenic mice. Diaphysis (dp), metaphysis (mp), central vein (cv), growth plate (gp). c, d Quantification of BM GFP+ MSCs on enlarged view showed in (b). Eight mice each group, 3 sections per mouse. e Quantification of distance between MSCs and BM vessels from femur transverse-shaved sections of control (PBS treatment) and LPS-treated Nestin-GFP mice 1 day after intervention. f Representative FACS figures showed the percentage of BM MSCs in control (PBS injection) and LPS-treated Nestin-GFP transgenic mice 1 day after intervention. g Percentage of CD45Ter119CD31GFP+ MSCs in control (n = 6) and LPS treated (n = 6) mice 1 day after intervention. All data represent as means±s.d. NS, not significant
Fig. 5
Fig. 5
BM immune cells exhibit different characteristics from the periphery and show complexity changes during sepsis. a Representative figures shown the percentage of CD4+CD8 and CD4CD8+ T cells in the BM and spleen of control (PBS-treated, n = 4) and LPS-treated mice (n = 4) at day 1. b, c Absolute cell counts of CD4+CD8 and CD4CD8+ T cells in BM (b) and spleen (c) as shown in (a) at day1 and day 3. d, e Representative figures shown the percentage of CD3+CD4+FOXP3+ regular T cells (Tregs) in the BM (d) and spleen (e) of control (PBS-treated) and LPS-treated mice at day 1. f, g Dynamic changes of the percentage of Treg cells within a week after LPS treatment. All data represent as means±s.d. *p<0.05, **p<0.01, ***p<0.001, ****p<0.0001, as determined by Student’s t-test. NS, not significant

Similar articles

Cited by

References

    1. Hotchkiss RS, Moldawer LL, Opal SM, Reinhart K, Turnbull IR, Vincent JL. Sepsis and septic shock. Nat Rev Dis Primers. 2016;2:16045. doi: 10.1038/nrdp.2016.45. - DOI - PMC - PubMed
    1. Fleischmann C, Scherag A, Adhikari NK, Hartog CS, Tsaganos T, Schlattmann P, et al. Assessment of global incidence and mortality of hospital-treated sepsis. Current estimates and limitations. Am J Respir Crit Care Med. 2016;193(3):259–272. doi: 10.1164/rccm.201504-0781OC. - DOI - PubMed
    1. Lelubre C, Vincent J-L. Mechanisms and treatment of organ failure in sepsis. Nat Rev Nephrol. 2018;14(7):417–427. doi: 10.1038/s41581-018-0005-7. - DOI - PubMed
    1. Bellomo R, Kellum JA, Ronco C, Wald R, Martensson J, Maiden M, et al. Acute kidney injury in sepsis. Intensive Care Med. 2017;43(6):816–828. doi: 10.1007/s00134-017-4755-7. - DOI - PubMed
    1. Haak BW, Wiersinga WJ. The role of the gut microbiota in sepsis. Lancet Gastroenterol Hepatol. 2017;2(2):135–143. doi: 10.1016/s2468-1253(16)30119-4. - DOI - PubMed

LinkOut - more resources