. 2021 Apr 30;2(1):12.
doi: 10.1186/s43556-021-00037-0.

Mibefradil alters intracellular calcium concentration by activation of phospholipase C and IP3 receptor function

Affiliations

Mibefradil alters intracellular calcium concentration by activation of phospholipase C and IP3 receptor function

Guilherme H Souza Bomfim et al. Mol Biomed. .

Abstract

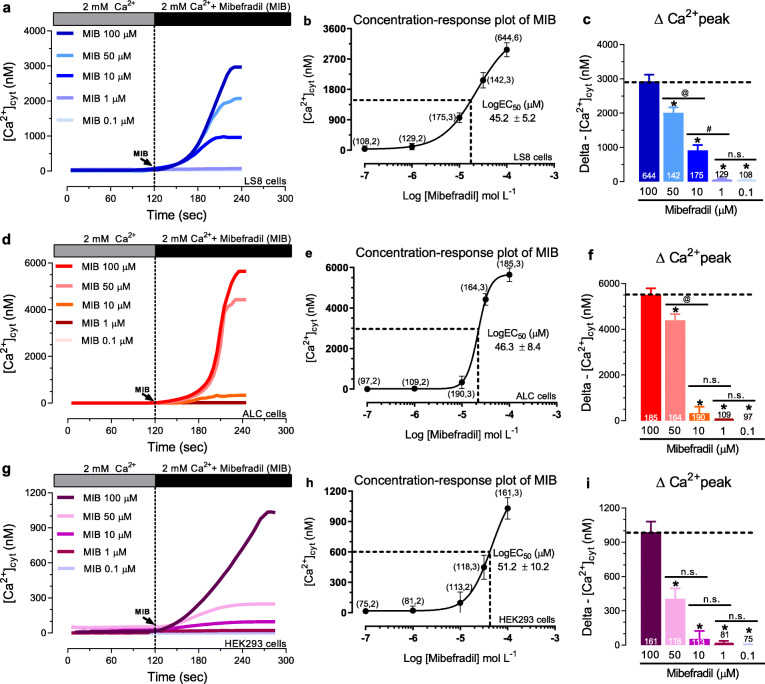
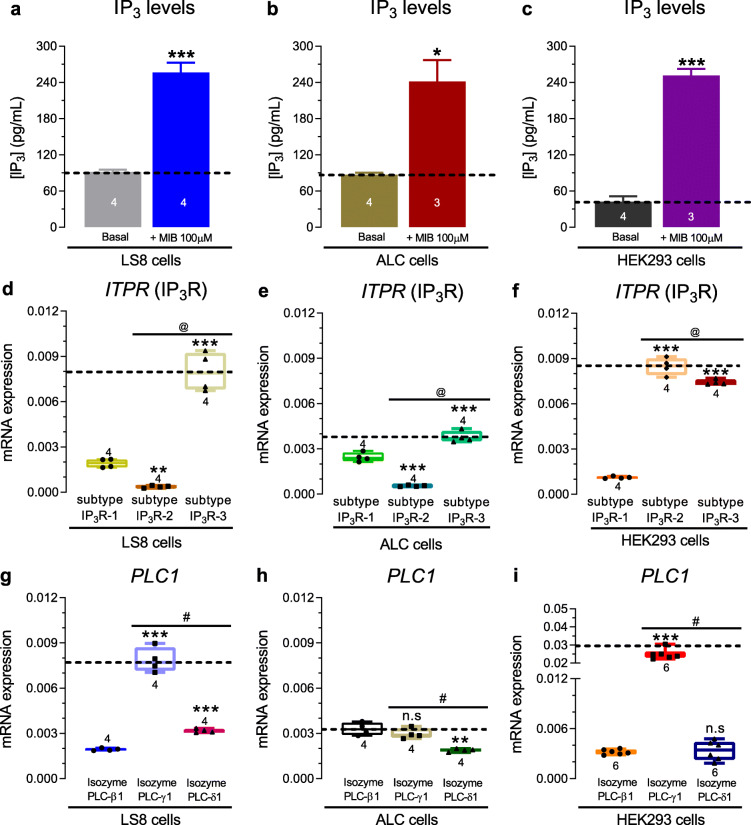
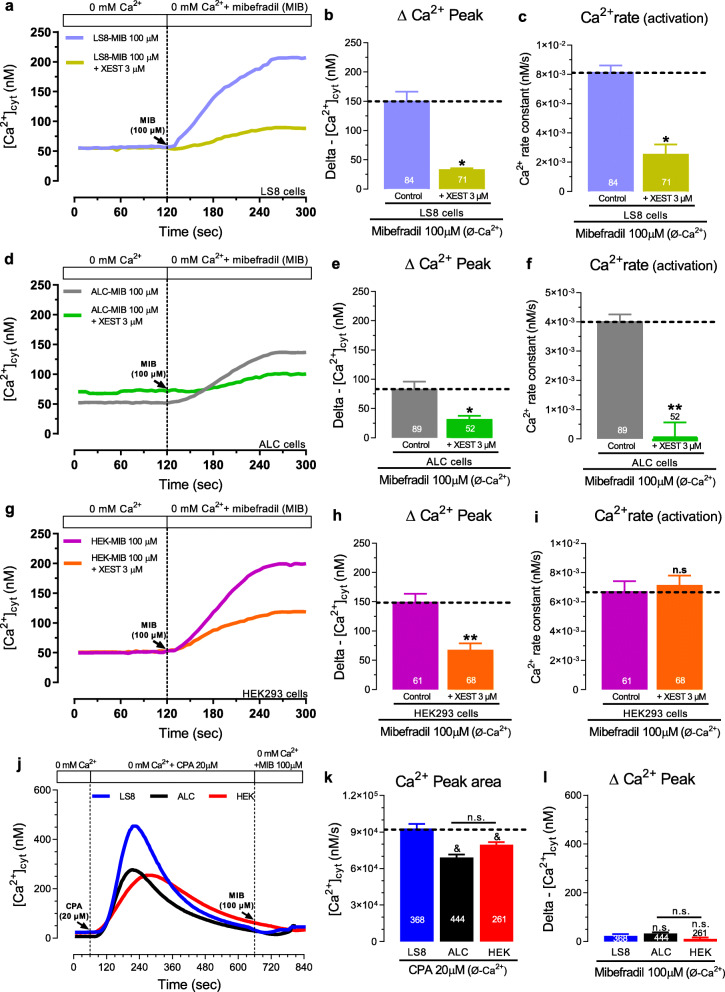
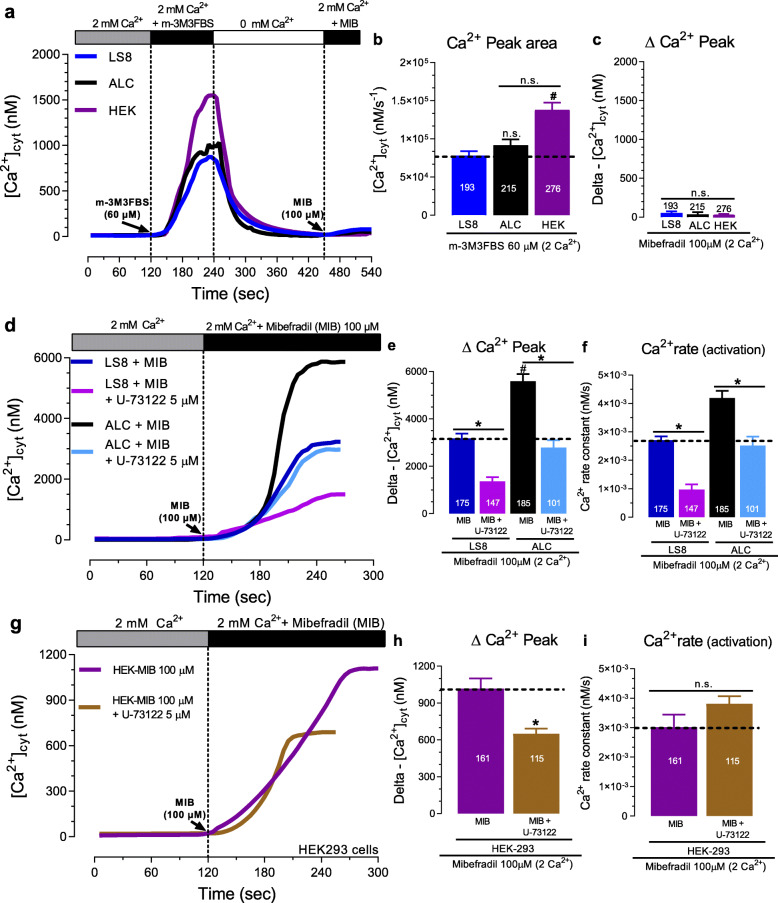
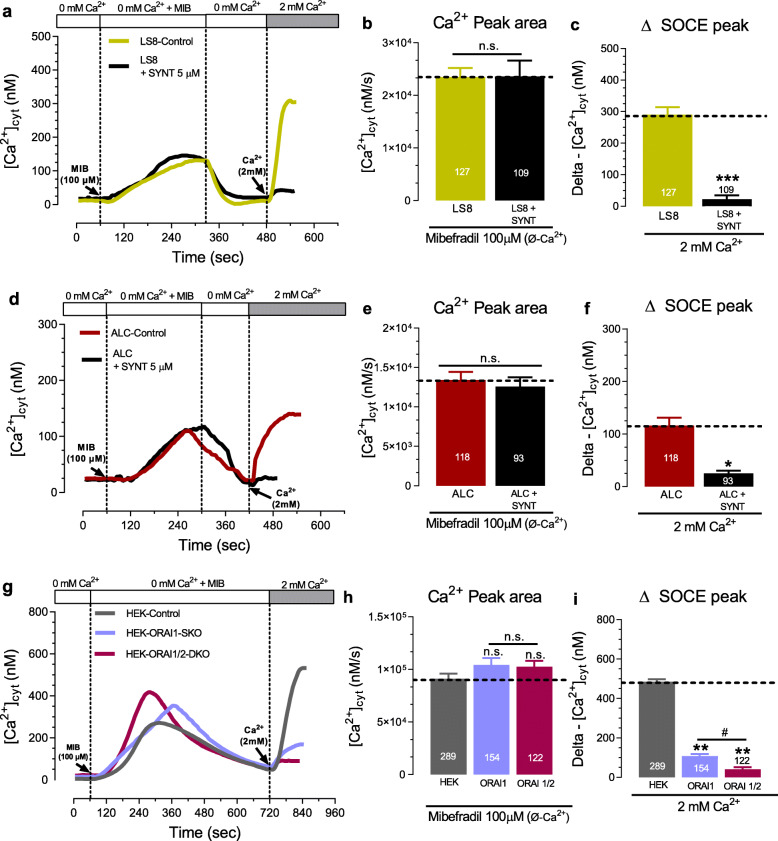
Mibefradil is a tetralol derivative originally developed as an antagonist of T-type voltage-gated calcium (Ca2+) channels to treat hypertension when used at nanomolar dosage. More recently, its therapeutic application in hypertension has declined and has been instead repurposed as a treatment of cancer cell proliferation and solid tumor growth. Beyond its function as a Cav blocker, the micromolar concentration of mibefradil can stimulate a rise in [Ca2+]cyt although the mechanism is poorly known. The chanzyme TRPM7 (transient receptor potential melastanin 7), the release of intracellular Ca2+ pools, and Ca2+ influx by ORAI channels have been associated with the increase in [Ca2+]cyt triggered by mibefradil. This study aims to investigate the cellular targets and pathways associated with mibefradil's effect on [Ca2+]cyt. To address these questions, we monitored changes in [Ca2+]cyt in the specialized mouse epithelial cells (LS8 and ALC) and the widely used HEK-293 cells by stimulating these cells with mibefradil (0.1 μM to 100 μM). We show that mibefradil elicits an increase in [Ca2+]cyt at concentrations above 10 μM (IC50 around 50 μM) and a fast Ca2+ increase capacity at 100 μM. We found that inhibiting IP3 receptors, depleting the ER-Ca2+ stores, or blocking phospholipase C (PLC), significantly decreased the capacity of mibefradil to elevate [Ca2+]cyt. Moreover, the transient application of 100 μM mibefradil triggered Ca2+ influx by store-operated Ca2+ entry (SOCE) mediated by the ORAI channels. Our findings reveal that IP3R and PLC are potential new targets of mibefradil offering novel insights into the effects of this drug.

Keywords: ALC cells; Ca2+ signaling; Cav; HEK293 cells; LS8 cells; Mibefradil; PLC pathway.


Conflict of interest statement

The authors declare no conflict of interest.

Figures

Fig. 1
Fig. 1
Effects of mibefradil on [Ca2+]cyt transients in LS8, ALC, and HEK-293 cells. a [Ca2+]cyt transients in LS8 cells stimulated with mibefradil (0.1 μM to 100 μM) in the presence of 2 mM extracellular Ca2+. b LogEC50 (apparent affinity) plot. c Quantification of ∆Ca2+ peak. d-f Same as in a-c but measured in ALC cells. g-i Same as a-c but measured in HEK-293 cells. In all cells, traces show basal (0–120 s) Ca2+ levels and the maximum capacity of Ca2+ mobilization (240–300 s) at 100 μM. Data represent the mean ± SEM of ≥75 cells from 3 independent experiments. Data were analyzed by one-way ANOVA followed by Tukey’s multiple comparison post-hoc test. *P < 0.05 vs. MIB-100 μM group; @P < 0.05 vs. MIB-50 μM group; #P < 0.05 vs. MIB-10 μM group; n.s., non-significant
Fig. 2
Fig. 2
IP3 content and expression of IP3 receptor subtypes. a Quantification of IP3 content in LS8 cells. b Quantification of IP3 content in ALC cells. c Quantification of IP3 content in HEK-293 cells. In all cells, quantification was performed before and after incubation with mibefradil (100 μM, 3–4 min). d-f Relative mRNA expression of the ITPR gene encoding the IP3R subtypes 1–3 quantitated by qPCR in each cell type. Data represent the mean ± SEM of 3–4 independent experiments. Data were analyzed by one-way ANOVA followed by Tukey’s multiple comparison post-hoc test. *P < 0.05; **P < 0.01 or ***P < 0.001 vs. IP3R-1 group; @P < 0.05 vs. IP3R-2 group; n.s., non-significant
Fig. 3
Fig. 3
Effects of mibefradil are reduced or abolished by IP3 R antagonist and ER-Ca2+ depletion. a Original traces of [Ca2+]cyt transients in Xestospongin C treated LS8 cells in Ca2+-free Ringer’s solution before and after mibefradil (100 μM) stimulation. b Quantification of the ∆ Ca2+ peak. c Quantification of the Ca2+ influx rate. d-f Same as in a-c but in ALC cells. g-i Same as in a-c but in HEK-293 cells. j Original traces of [Ca2+]cyt transients in CPA stimulated LS8, ALC, and HEK-293 cells in Ca2+-free Ringer’s solution followed by the application of mibefradil (100 μM). k Quantification of the ∆ Ca2+ peak under CPA stimulation. i Quantification of the ∆ Ca2+ peak under mibefradil stimulation. Data represent the mean ± SEM of ≥52 cells from 3 independent experiments. Data were analyzed by two-tailed unpaired Student’s t-test. *P < 0.05 or **P < 0.01 vs. respective MIB-100 μM (control) group; n.s., non-significant. In ER-Ca2+ depletion experiments elicited by CPA (20 μM), the data were analyzed by one-way ANOVA followed by Tukey’s multiple comparison post-hoc test. &P < 0.05 vs. LS8 group n.s., non-significant
Fig. 4
Fig. 4
Mibefradil-mediated [Ca2+]cyt increase is dependent on PLC pathway activation. a Original traces of [Ca2+]cyt transients in LS8, ALC, and HEK-293 cells stimulated with the PLC activator m-3M3FBS (60 μM), followed by addition of mibefradil (100 μM) in Ringer’s solution containing 2 mM Ca2+. b Quantification of the ∆Ca2+ peak area of under m-3M3FBS stimulation. c Quantification of the ∆Ca2+ peak under mibefradil stimulation. d Original traces of [Ca2+]cyt transients in LS8 and ALC cells stimulated with mibefradil (100 μM) in the presence or absence of the PLC inhibitor, U73122 (5 μM). d Quantification of the ∆Ca2+ peak. f Quantification of the Ca2+ influx rate. g-i Same as d-f but in HEK-293 cells. Data represent the mean ± SEM of ≥101 cells from 3 independent experiments. Data were analyzed by one-way ANOVA followed by Tukey’s multiple comparison post-hoc test. #P < 0.05 vs. LS8 group; *P < 0.05 vs. their respective MIB-100 μM group; n.s., non-significant
Fig. 5
Fig. 5
Mibefradil stimulated ER-Ca2+ depletion and Ca2+ influx via SOCE. a Original traces of [Ca2+]cyt transients showing ER-Ca2+ depletion elicited by mibefradil (100 μM) in Ca2+-free Ringer’s solution followed by readdition of 2 mM extracellular Ca2+ solution in LS8 cells with or without pre-incubation with synta-66. b Quantification of the ER-Ca2+ release peak area under mibefradil stimulation. c Quantification of ∆SOCE peak upon readdition of 2 mM Ca2+. d Same as in a-c but in ALC cells. g Original traces of [Ca2+]cyt transients showing ER-Ca2+ depletion elicited by mibefradil (100 μM) in Ca2+-free Ringer’s solution followed by readdition of 2 mM extracellular Ca2+ solution in HEK-293 cells with a CRISPR-cas9 deletion of ORAI1 (SKO) or dual deletion of ORAI2 and ORAI2 (DKO). h Quantification of the ER-Ca2+ release peak area under mibefradil stimulation. i Quantification of ∆SOCE peak upon readdition of 2 mM Ca2+. Data represent the mean ± SEM of ≥93 cells from 3 independent experiments. Data were analyzed by two-tailed unpaired Student’s t-test or one-way ANOVA followed by Tukey’s multiple comparison post-hoc test. *P < 0.05 vs. ALC group; **P < 0.01 vs. HEK-control group; ***P < 0.001 vs. LS8 group; #P < 0.05 vs. HEK-ORAI1 group; n.s., non-significant

Similar articles

Cited by

References

    1. Heady TN, Gomora JC, Macdonald TL, Perez-Reyes E. Molecular pharmacology of T-type Ca2+ channels. Jpn J Pharmacol. 2001;85(4):339–350. doi: 10.1254/jjp.85.339. - DOI - PubMed
    1. Strege PR, Bernard CE, Ou Y, Gibbons SJ, Farrugia G. Effect of mibefradil on sodium and calcium currents. Am J Physiol Gastrointest Liver Physiol. 2005;289(2):G249–G253. doi: 10.1152/ajpgi.00022.2005. - DOI - PubMed
    1. Gómez-Lagunas F, Carrillo E, Pardo LA, Stühmer W. Gating modulation of the tumor-related Kv10.1 channel by Mibefradil. J Cell Physiol. 2017;232(8):2019–2032. doi: 10.1002/jcp.25448. - DOI - PubMed
    1. Perez-Reyes E, Van Deusen AL, Vitko I. Molecular pharmacology of human Cav3.2 T-type Ca2+ channels: block by antihypertensives, antiarrhythmics, and their analogs. J Pharmacol Exp Ther. 2009;328(2):621–627. doi: 10.1124/jpet.108.145672. - DOI - PMC - PubMed
    1. Wiltshire HR, Sutton BM, Heeps G, Betty AM, Angus DW, Harris SR, et al. Metabolism of the calcium antagonist, mibefradil (POSICOR, Ro 40-5967). Part III. Comparative pharmacokinetics of mibefradil and its major metabolites in rat, marmoset, cynomolgus monkey and man. Xenobiotica. 1997;27(6):557–571. doi: 10.1080/004982597240343. - DOI - PubMed

LinkOut - more resources