

Survival analysis: A primer for the clinician scientists
- PMID: 35006489
- PMCID: PMC8743691
- DOI: 10.1007/s12664-021-01232-1
Survival analysis: A primer for the clinician scientists
Abstract
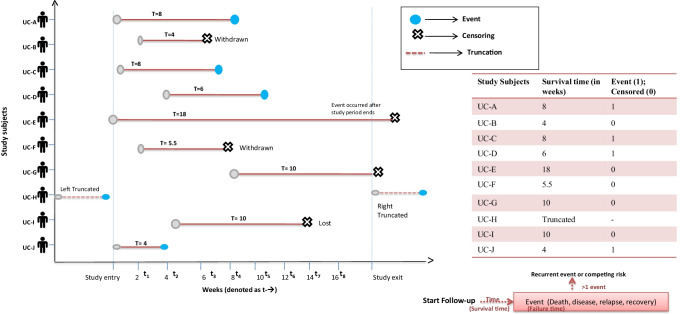
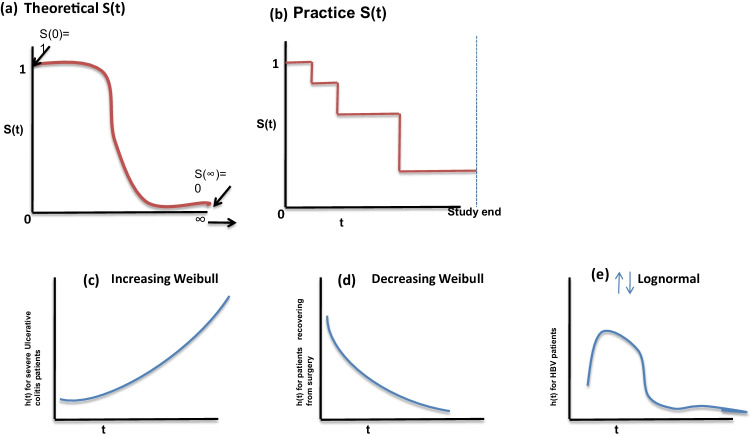
Survival analysis is a collection of statistical procedures employed on time-to-event data. The outcome variable of interest is time until an event occurs. Conventionally, it dealt with death as the event, but it can handle any event occurring in an individual like disease, relapse from remission, and recovery. Survival data describe the length of time from a time of origin to an endpoint of interest. By time, we mean years, months, weeks, or days from the beginning of being enrolled in the study. The major limitation of time-to-event data is the possibility of an event not occurring in all the subjects during a specific study period. In addition, some of the study subjects may leave the study prematurely. Such situations lead to what is called censored observations as complete information is not available for these subjects. Life table and Kaplan-Meier techniques are employed to obtain the descriptive measures of survival times. The main objectives of survival analysis include analysis of patterns of time-to-event data, evaluating reasons why data may be censored, comparing the survival curves, and assessing the relationship of explanatory variables to survival time. Survival analysis also offers different regression models that accommodate any number of covariates (categorical or continuous) and produces adjusted hazard ratios for individual factor.
Keywords: Censoring; Cohort study; Cox proportional hazard model; Hazard ratio; Kaplan–Meier plot; Log-rank test; Longitudinal data analysis; Regression model; Time-to-event analysis.
© 2022. Indian Society of Gastroenterology.
Conflict of interest statement
SR, PM, and UCG declare no competing interests.
Figures


References
-
- Klein JP, Moeschberge ML, Gail M, Samet JM, Tsiats A. Statistics for biology and health. New York: Springer; 2003.
-
- Cohen-Mekelburg S, Rosenblatt R, Wallace B, et al. Inflammatory bowel disease readmissions are associated with utilization and comorbidity. Am J Manag Care. 2019;25:474–481. - PubMed
-
- Klein JP, Moeschberger ML. Survival analysis: techniques for censored and truncated data. New York: Springer; 2003.
MeSH terms
LinkOut - more resources
Full Text Sources
