. 2022 Jan 10;18(1):e1010176.
doi: 10.1371/journal.ppat.1010176. eCollection 2022 Jan.

Hyperinflammatory environment drives dysfunctional myeloid cell effector response to bacterial challenge in COVID-19

Affiliations

Hyperinflammatory environment drives dysfunctional myeloid cell effector response to bacterial challenge in COVID-19

Srikanth Mairpady Shambat et al. PLoS Pathog. .

Abstract

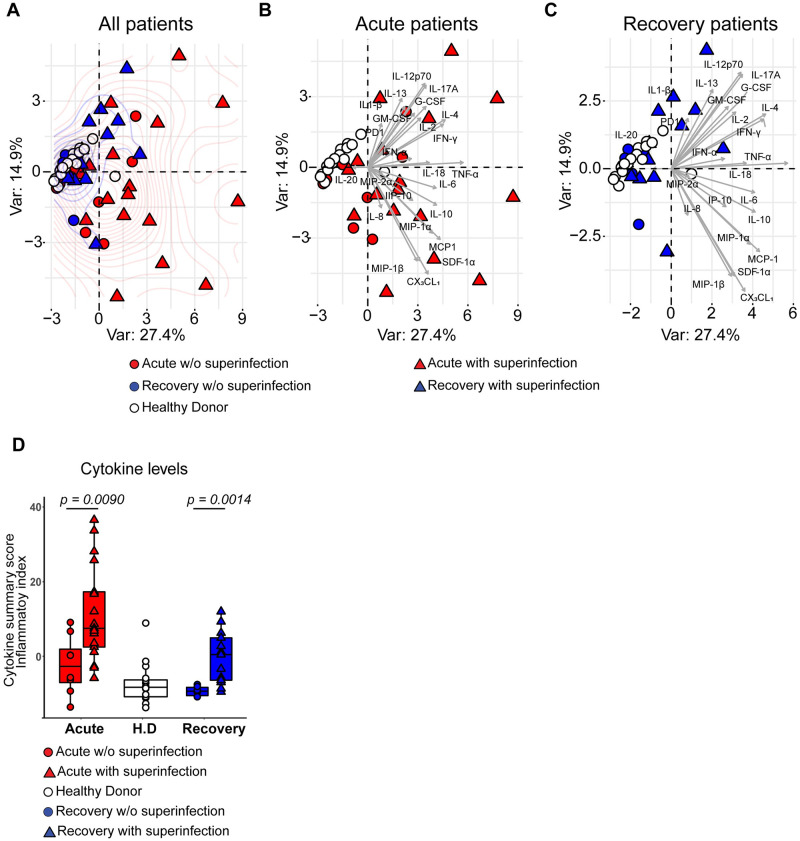
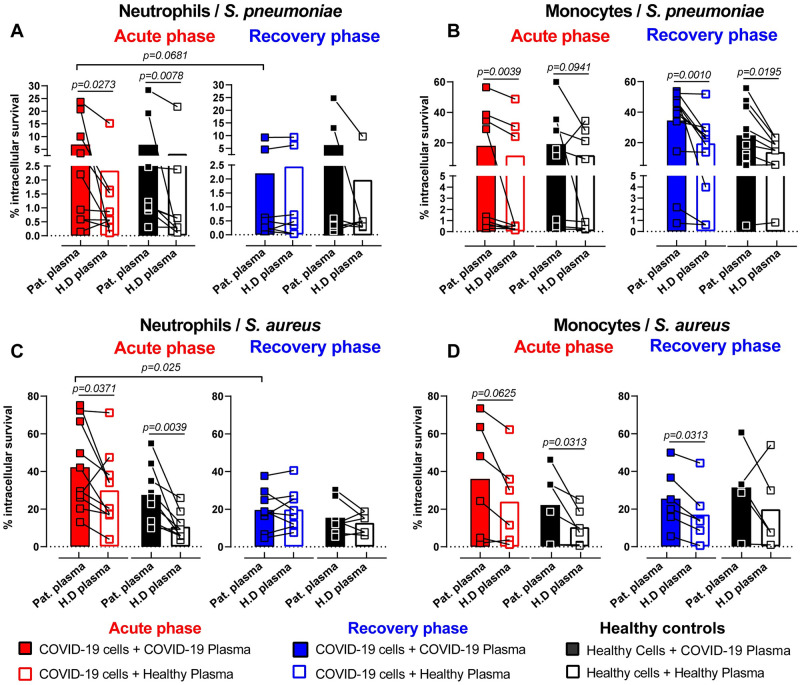
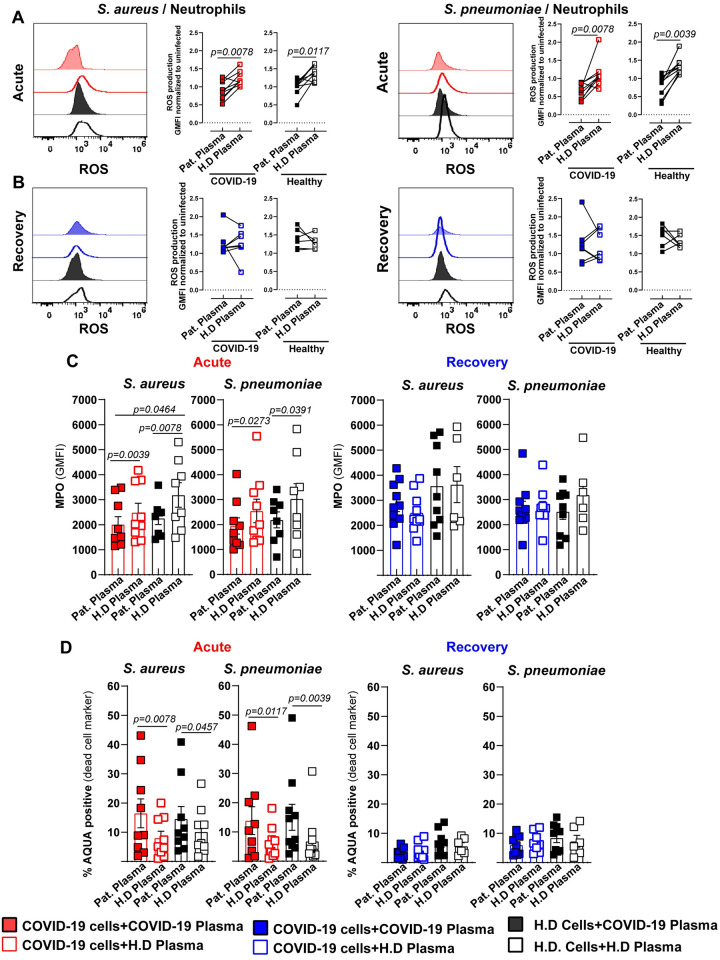
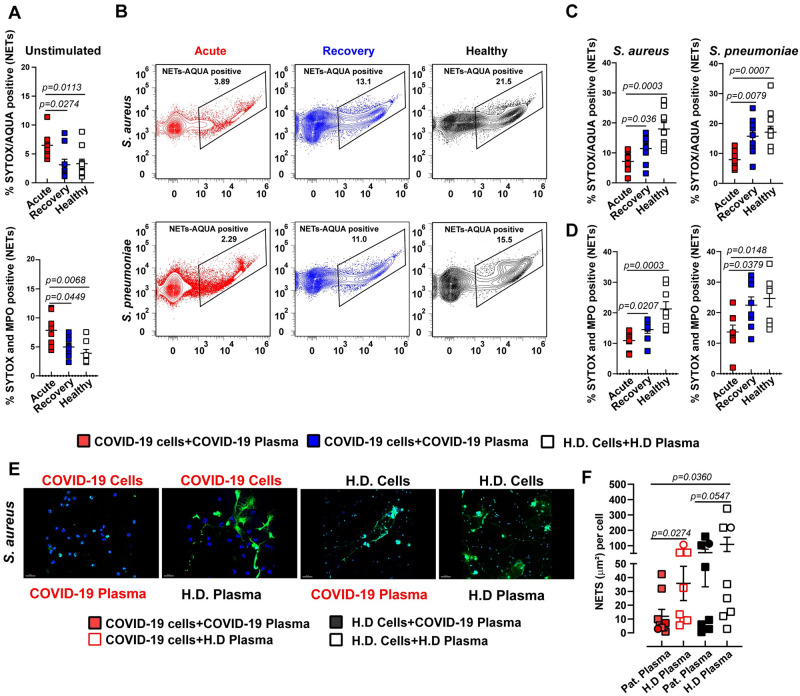
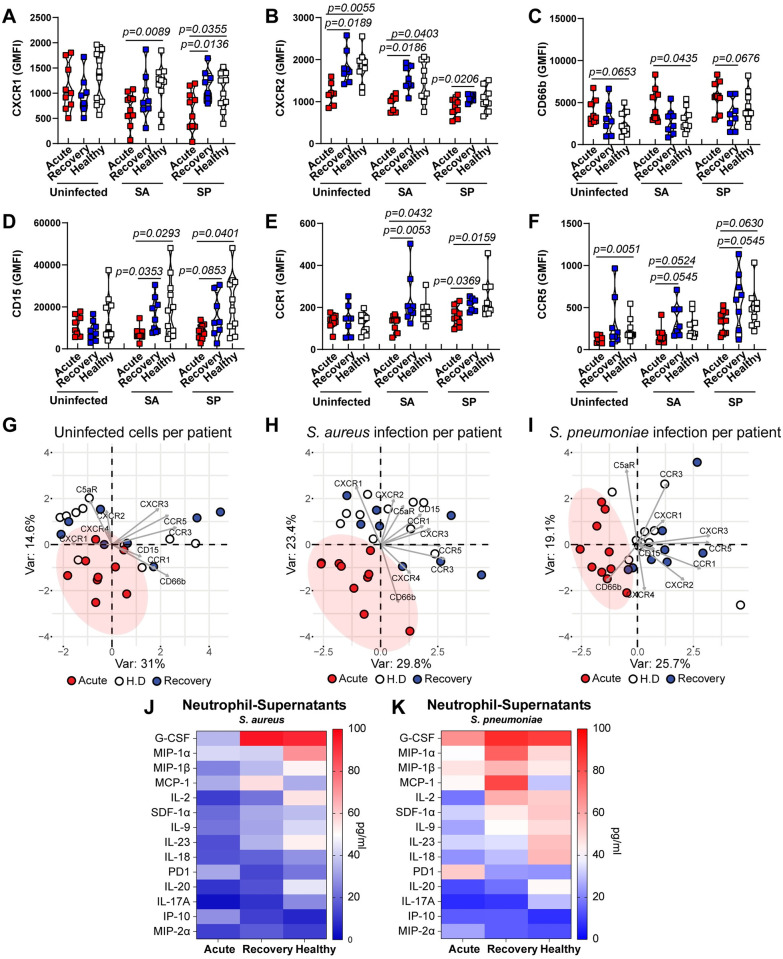
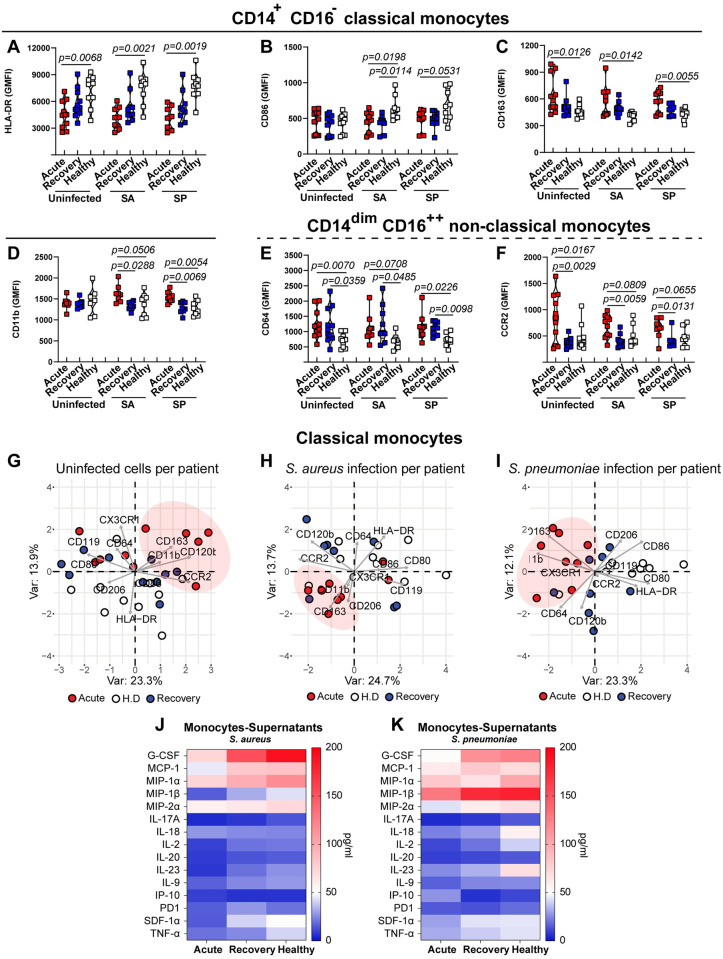
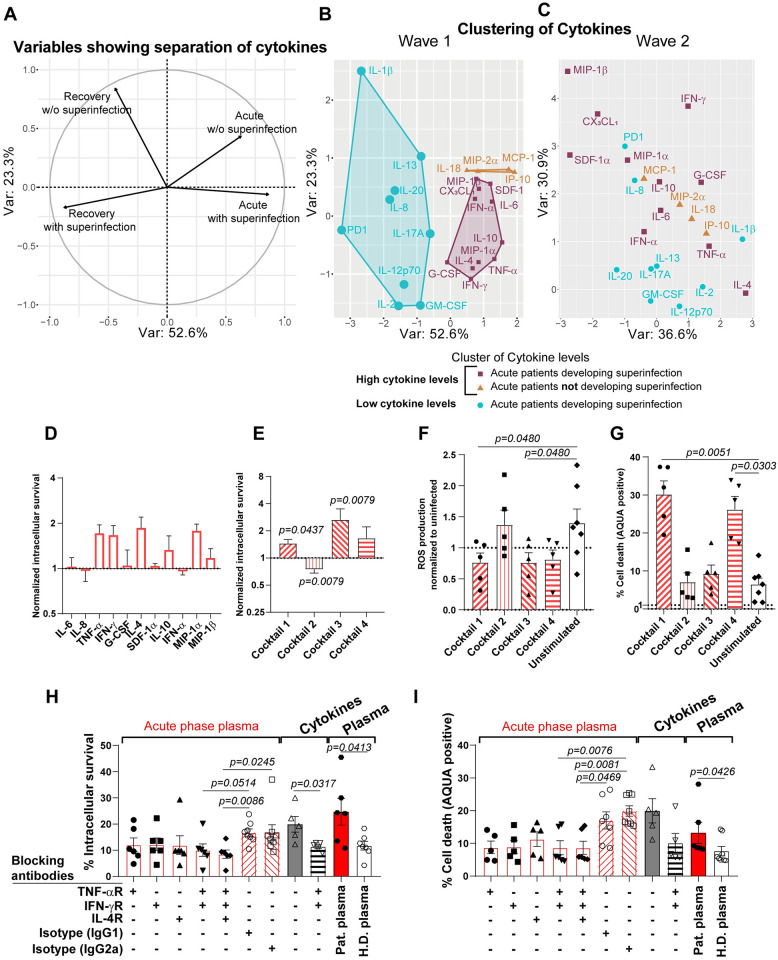
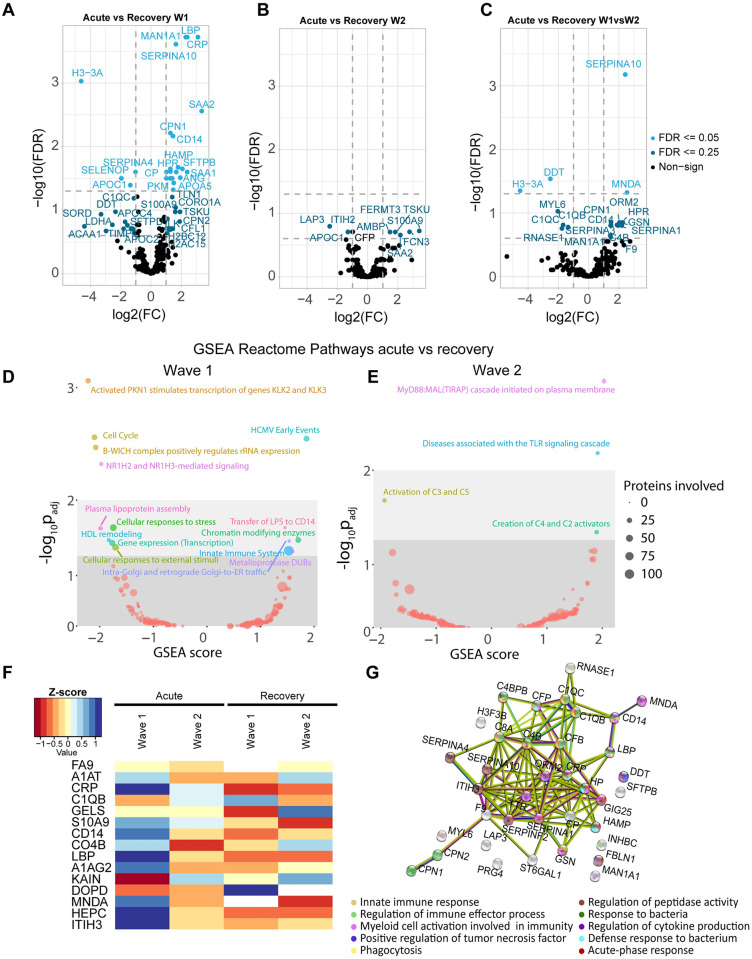
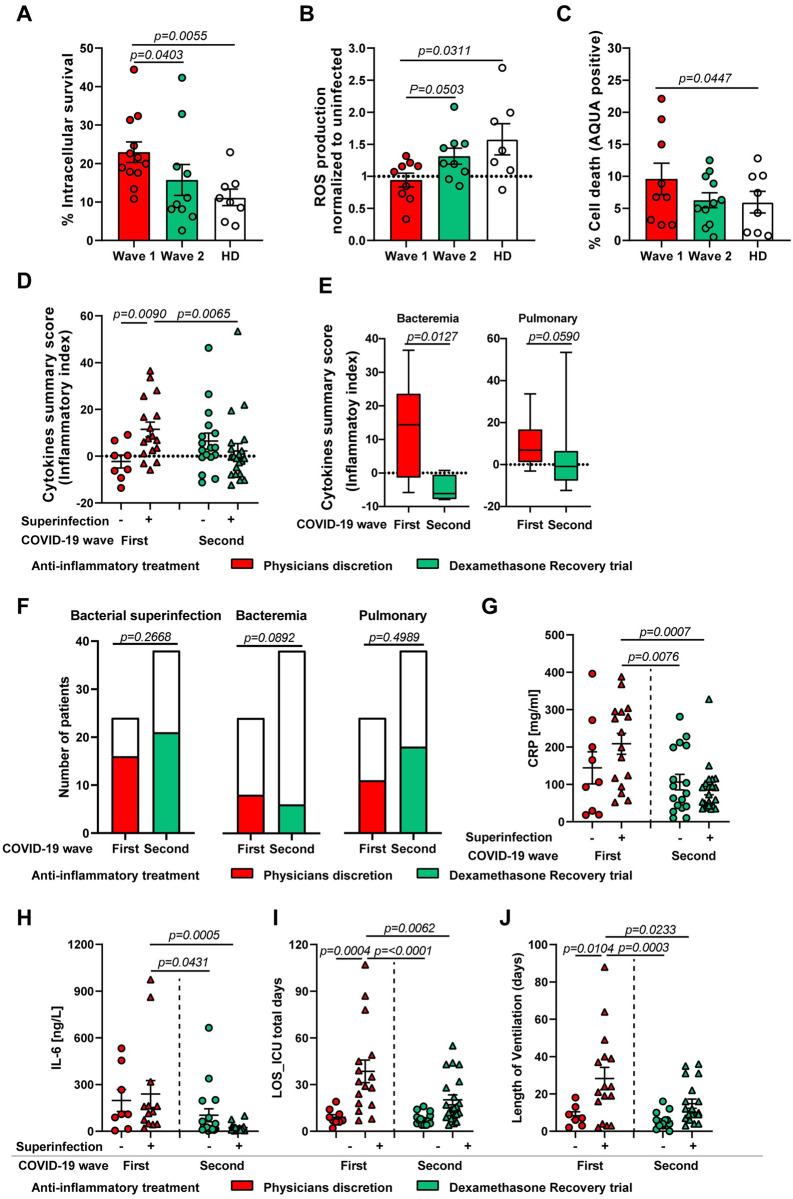
COVID-19 displays diverse disease severities and symptoms including acute systemic inflammation and hypercytokinemia, with subsequent dysregulation of immune cells. Bacterial superinfections in COVID-19 can further complicate the disease course and are associated with increased mortality. However, there is limited understanding of how SARS-CoV-2 pathogenesis and hypercytokinemia impede the innate immune function against bacterial superinfections. We assessed the influence of COVID-19 plasma hypercytokinemia on the functional responses of myeloid immune cells upon bacterial challenges from acute-phase COVID-19 patients and their corresponding recovery-phase. We show that a severe hypercytokinemia status in COVID-19 patients correlates with the development of bacterial superinfections. Neutrophils and monocytes derived from COVID-19 patients in their acute-phase showed an impaired intracellular microbicidal capacity upon bacterial challenges. The impaired microbicidal capacity was reflected by abrogated MPO and reduced NETs production in neutrophils along with reduced ROS production in both neutrophils and monocytes. Moreover, we observed a distinct pattern of cell surface receptor expression on both neutrophils and monocytes, in line with suppressed autocrine and paracrine cytokine signaling. This phenotype was characterized by a high expression of CD66b, CXCR4 and low expression of CXCR1, CXCR2 and CD15 in neutrophils and low expression of HLA-DR, CD86 and high expression of CD163 and CD11b in monocytes. Furthermore, the impaired antibacterial effector function was mediated by synergistic effect of the cytokines TNF-α, IFN-γ and IL-4. COVID-19 patients receiving dexamethasone showed a significant reduction of overall inflammatory markers in the plasma as well as exhibited an enhanced immune response towards bacterial challenge ex vivo. Finally, broad anti-inflammatory treatment was associated with a reduction in CRP, IL-6 levels as well as length of ICU stay and ventilation-days in critically ill COVID-19 patients. Our data provides insights into the transient functional dysregulation of myeloid immune cells against subsequent bacterial infections in COVID-19 patients and describe a beneficial role for the use of dexamethasone in these patients.


Conflict of interest statement

The authors have declared that no competing interests exist.

Figures

Fig 1
Fig 1. Characterization of inflammatory mediators in COVID-19 plasma and its association with bacterial superinfection.
(A) PCA of healthy donors (white, n = 17), acute- (red, n = 25) and rec- (blue, n = 19) phase COVID-19 patients grouping the plasma cytokine levels and status of secondary bacterial infections (superinfection). Patients who developed or had bacterial superinfection at the time of sampling are depicted as triangle and patients without (w/o) superinfection as circle symbols. (B) PCA of healthy donors (white, n = 17) and acute-phase patients (red, n = 25). Patients who developed bacterial superinfection are depicted as triangle and patients without (w/o) superinfection as circle symbols. (C) PCA of healthy donors (white, n = 17), and rec-phase patients (blue, n = 19). Patients with superinfection are depicted as triangle and patients without superinfection as circle symbols. (D) Normalized cytokine values (sum of Z-scores) in the plasma of acute (red), rec (blue) patients with or without (w/o) bacterial superinfection and healthy donors (white). Data presented as box plots with box indicating interquartile range and error bars indicating highest and lowest value. For panel D, p values were determined by using Mann-Whitney test.
Fig 2
Fig 2. Impaired intracellular bactericidal capacity of innate immune cells in acute-phase COVID-19 patients.
(A-D) Intracellular killing capacity of COVID-19 patient (acute-phase: red and rec-phase: blue) or healthy donor neutrophils (A and C) and monocytes (B and D) (n = 8–10) pre-exposed to 10% patient plasma (solid symbols) or healthy donor plasma (open symbols) for 3 h and subsequently infected with SP (A and B) or SA (C and D) at MOI 10. Neutrophils and monocytes were isolated freshly from blood and stimulated with the respective plasma conditions. Each symbol represents cells from one human subject, stimulated with either COVID-19 or healthy donor plasma from one donor. P values were determined by using Wilcoxon signed-rank test without adjustment for multiple testing.
Fig 3
Fig 3. Impaired neutrophil effector response against bacterial challenge in acute COVID-19 patients.
Functional characterization of COVID-19 patient’s (acute-phase: red and rec-phase: blue) or healthy donor’s neutrophils pre-exposed to 10% COVID-19 plasma (solid symbols) or healthy plasma (open symbols) for 3 h and subsequently challenged with either SA or SP at MOI 1. (A and B). Neutrophil functionality was assessed by quantification of ROS in acute- (A) and rec-phase patients (B) (n = 7–8), intracellular MPO (C) (right: acute-phase) (left: rec-phase) and cell viability (D) (right: acute-phase) (left: rec-phase) (n = 7–9) and compared to healthy donors. Each symbol represents cells from one human subject, exposed to either COVID-19 or healthy donor plasma from one donor. In C and D, data are presented as the mean value ± SEM. For panels A and B, p values were determined by using Wilcoxon signed-rank test, for panel C and D by Mann-Whitney test.
Fig 4
Fig 4. Abrogated classical NETs production in COVID-19 patients upon secondary bacterial challenge.
(A) Flow cytometry analysis of SYTOX and AQUA positive neutrophils (top) and MPO-SYTOX positive neutrophils (bottom) isolated from fresh blood from acute- or rec-phase COVID-19 patients or healthy donors exposed to 10% autologous plasma for 3 h (n = 6–8). (B-D) SYTOX and AQUA positive neutrophils (top) and MPO-SYTOX positive neutrophils (bottom) from acute- or rec-phase COVID-19 patients or healthy donors pre-exposed to 10% autologous plasma for 3 h and subsequently challenged with SA or SP at MOI 1 for 1 h (n = 6–8). (E) Representative confocal images of NETs formation by neutrophils from acute-phase COVID-19 patients or healthy donors pre-stimulated with 10% acute-phase COVID-19 or healthy plasma and subsequently challenged with SA at MOI 10 for 1.5 h. Neutrophils were stained by HOECHST (nuclei: blue) and SYTOX (extracellular DNA: green). (F) Quantification of NETs using fluorescence microscopy (squares, n = (226–8898)) and confocal microscopy (circles, n = (19–113)) nuclei per point (n = 7–8). Each symbol represents cells from a single COVID-19 patient or healthy donor exposed to either COVID-19 or healthy donor plasma from one donor. In A, C, D, and F, data are presented as the mean value ± SEM. For panels A, C, D and F, p values were determined by using Mann-Whitney test.
Fig 5
Fig 5. Expression of surface markers and secretion of cytokines in neutrophils upon bacterial challenge.
(A-F) Expression of key surface markers of neutrophils from acute or rec-phase COVID-19 patients or healthy donors pre-exposed to 10% autologous plasma for 3 h and subsequently either challenged with SA or SP at MOI 1 or left unchallenged (n = 8–10). (G-I) PCA of cell surface phenotype of COVID-19 patients acute- (red) or rec-phase (blue) and healthy donors’ (white) neutrophils at the basal level without bacterial challenge (G), upon SA infection (H) or SP infection (I). Each symbol represents cells from a single COVID-19 patient or healthy donor exposed to either COVID-19 or healthy donor plasma. (J and K). Heat map of cytokines secreted by neutrophils from COVID-19 patients (acute- and rec-phase) and healthy controls after bacterial challenge with SA (J) or SP (K) (n = 3–4). For panels A-F, p values were determined by using Mann-Whitney test.
Fig 6
Fig 6. Phenotypic characterization of surface markers and secreted cytokines in monocytes upon bacterial challenge.
(A-F) Expression of key surface markers of classical (A-D) and non-classical monocytes (E and F) from acute- or rec-phase COVID-19 patients or healthy donors pre-exposed to 10% autologous plasma for 3h and subsequently challenged with either SA or SP at MOI 1 or left unchallenged (n = 9–11). (G-I) PCA of cell surface phenotype of COVID-19 patients acute- (red) or rec-phase (blue) and healthy donors’ (white) classical monocytes at the basal level without bacterial challenge (G), upon SA infection (H) or SP infection (I). Each symbol represents cells from a single COVID-19 patient or healthy donor exposed to either COVID-19 or healthy donor plasma from one donor. (J and K) Heat map of cytokines secreted by monocytes from COVID-19 patients (acute-phase and rec-phase) and healthy controls after bacterial challenge with SA (J) or SP (K) (n = 2–3). For panels A-F, p values were determined by using Mann-Whitney test.
Fig 7
Fig 7. Plasma cytokine levels quantification of COVID-19 patients according to superinfection status and functional cytokine analysis.
(A) PCA of cytokine levels in COVID-19 patients with secondary bacterial infections (superinfection) vs COVID-19 patients without superinfection, showing the separation axis between acute- and rec-phase. (B and C) PCA of plasma cytokine level comparison between acute- and rec-phase of wave 1 and wave 2 patients highlighting a cluster of elevated levels of cytokines in COVID-19 patients with superinfection (purple), cluster with elevated levels of cytokines in COVID-19 patients without superinfection (orange) and cluster with similarly low levels in acute- and rec-phase in patients without superinfection (cyan). Axes in both graphs are the same and based on the direction and orientation of variables as shown in panel A. Anti-inflammatory treatment received by the patients either at physician’s discretion (B) or following the RECOVERY trial protocol with dexamethasone (C). Analysis was only done on patients not suffering from superinfection at time of sampling. (D and E) Intracellular killing capacity of healthy donor neutrophils (n = 5–7) pre-exposed to the indicated single (D) or combination of cytokines for 4 h (E) and subsequently infected with SA at MOI 10. Values are normalized to unstimulated neutrophils. (F and G) ROS production (F) and cell death (G) of healthy donor neutrophils (n = 5–7) pre-exposed to different cytokine cocktails for 4h and subsequently infected with SA at MOI 1. Cocktail 1, TNF-α and IFN-γ; cocktail 2, IL-6, IL-8, G-CSF and IFN-α; cocktail 3, IL-4, IL-10 and IFN-γ; cocktail 4, IL-4, IL-6, IL-8, IL-10, TNF-α, IFN-α, IFN-γ, G-CSF, SDF-1α, MIP-1α and MIP-1β. (H-I) Intracellular bacterial survival (H) and cell death (I) of healthy donor neutrophils (n = 5–8) pre-treated with receptor blockers or isotype controls and exposed to 10% acute-phase COVID-19 plasma (“Acute-phase plasma”, n = 6 plasmas). Employment of receptor blockers or isotype controls, pre-exposed to TNF-α and IFN-γ (“Cytokines”) with or without receptor blockers and 10% acute-phase COVID-19 or 10% healthy donor plasma (“Plasma”, n = 6 plasmas) for 4 h and subsequently infected with SA at MOI 10 (H) or 1 (I). Each symbol represents cells from one healthy donor. For graphs presented in (E-G) p values were determined by using Mann-Whitney test, (H-I) by using Kruskal-Walis test with Dunn’s multiple comparison test and Mann-Whitney test.
Fig 8
Fig 8. Plasma-protein profile evaluation for COVID-19 patients in acute- and their corresponding rec-phase between wave 1 and wave 2.
(A-C) Volcano plots depicting the changes in plasma protein intensities based on the patient condition (acute- vs rec-phase) in COVID-19 wave 1 (A), wave 2 (B) or between acute- vs rec-phase in wave 1 compared to acute- vs rec-phase in wave 2 (C). A minimum change of two folds and an FDR of 0.05 and 0.25 was considered for statistical significance. (D-E) Gene set enrichment analysis (GSEA) was done to depict changes in the expression of proteins involved in different cellular pathways using the Reactome across conditions (acute-phase vs rec-phase) in COVID-19 wave 1 (D) and wave 2 (E). The diameter of the circles depicts the number of proteins involved in the illustrated process and the color indicate a specific pathway. (F) A heatmap of the Z score of signal intensities depicting the changes of the top 15 proteins measured in the plasma samples and with a known role in immune response to infections across conditions (acute-phase vs rec-phase) from COVID-19 patients during wave 1 and wave 2. (G) An interaction map was constructed to depict the signal intensity changes of proteins between acute- vs rec-phase in wave 1 compared to acute- vs rec-phase in wave 2 using the STRING database. The color of the spheres illustrates the functional group they belong to, while the color of the connecting strings shows the type of interaction as given by STRING.
Fig 9
Fig 9. Quantification of inflammatory mediators in plasma and its association with bacterial superinfection compared between the first and second COVID-19 wave.
(A-C) Intracellular bacterial survival (A), ROS production (B) and cell death (C) of healthy donor neutrophils (n = 6) pre-exposed to either 10% of wave 1 acute-phase (n = 9–12), wave 2 acute-phase (n = 8–10) or healthy donor plasma (n = 7–8) for 3 h and subsequently infected with SA at MOI 10 (A) or 1 (B and C). (D and E). Normalized cytokine values (sum of Z-scores) depicted as cytokine summary score (inflammatory index) in the plasma of acute-phase COVID-19 patients between first and second wave with or without superinfection. The cytokine summary score from first wave is also presented in Fig 1D (D) and stratification by type of superinfection, i.e. bacteraemia (left) or pulmonary infection (right) between first wave (red box) and second wave (green box) (E). Data presented as whisker plots with box indicating interquartile range and error bars indicating highest and lowest value. (F and G) Contingency graph showing the difference in proportion of total bacterial superinfection, bacteraemia status and pulmonary infection status (F) in critically ill COVID-19 patients during first wave and the second wave. (G-J) Clinical as well as laboratory parameters that are part of the routine diagnostics including, CRP (G) and IL-6 levels (H) as well as length of ICU stay (I) and ventilation (J) of acute-phase COVID-19 patients between first and second wave with or without superinfection. For panels A-C, each symbol represents cells from one healthy donor treated with 10% plasma, for panels D, G-J, each symbol represents one human subject. For panels A-E and G-J, p values were determined by using Mann-Whitney test, for panel F by using Chi-square test.

References

    1. Huang H, Cai S, Li Y, Li Y, Fan Y, Li L, et al.. Prognostic Factors for COVID-19 Pneumonia Progression to Severe Symptoms Based on Earlier Clinical Features: A Retrospective Analysis. Front Med (Lausanne). 2020;7:557453. doi: 10.3389/fmed.2020.557453 - DOI - PMC - PubMed
    1. Wu Z, McGoogan JM. Characteristics of and Important Lessons From the Coronavirus Disease 2019 (COVID-19) Outbreak in China: Summary of a Report of 72 314 Cases From the Chinese Center for Disease Control and Prevention. JAMA. 2020;323(13):1239–42. doi: 10.1001/jama.2020.2648 - DOI - PubMed
    1. Guan WJ, Ni ZY, Hu Y, Liang WH, Ou CQ, He JX, et al.. Clinical Characteristics of Coronavirus Disease 2019 in China. N Engl J Med. 2020;382(18):1708–20. doi: 10.1056/NEJMoa2002032 - DOI - PMC - PubMed
    1. Shi S, Qin M, Shen B, Cai Y, Liu T, Yang F, et al.. Association of Cardiac Injury With Mortality in Hospitalized Patients With COVID-19 in Wuhan, China. JAMA Cardiol. 2020;5(7):802–10. doi: 10.1001/jamacardio.2020.0950 - DOI - PMC - PubMed
    1. Zhou F, Yu T, Du R, Fan G, Liu Y, Liu Z, et al.. Clinical course and risk factors for mortality of adult inpatients with COVID-19 in Wuhan, China: a retrospective cohort study. Lancet. 2020;395(10229):1054–62. doi: 10.1016/S0140-6736(20)30566-3 - DOI - PMC - PubMed

Publication types