

Dynamic reconfiguration of frequency-specific cortical coactivation patterns during psychedelic and anesthetized states induced by ketamine
- PMID: 35007718
- PMCID: PMC8903080
- DOI: 10.1016/j.neuroimage.2022.118891
Dynamic reconfiguration of frequency-specific cortical coactivation patterns during psychedelic and anesthetized states induced by ketamine
Abstract
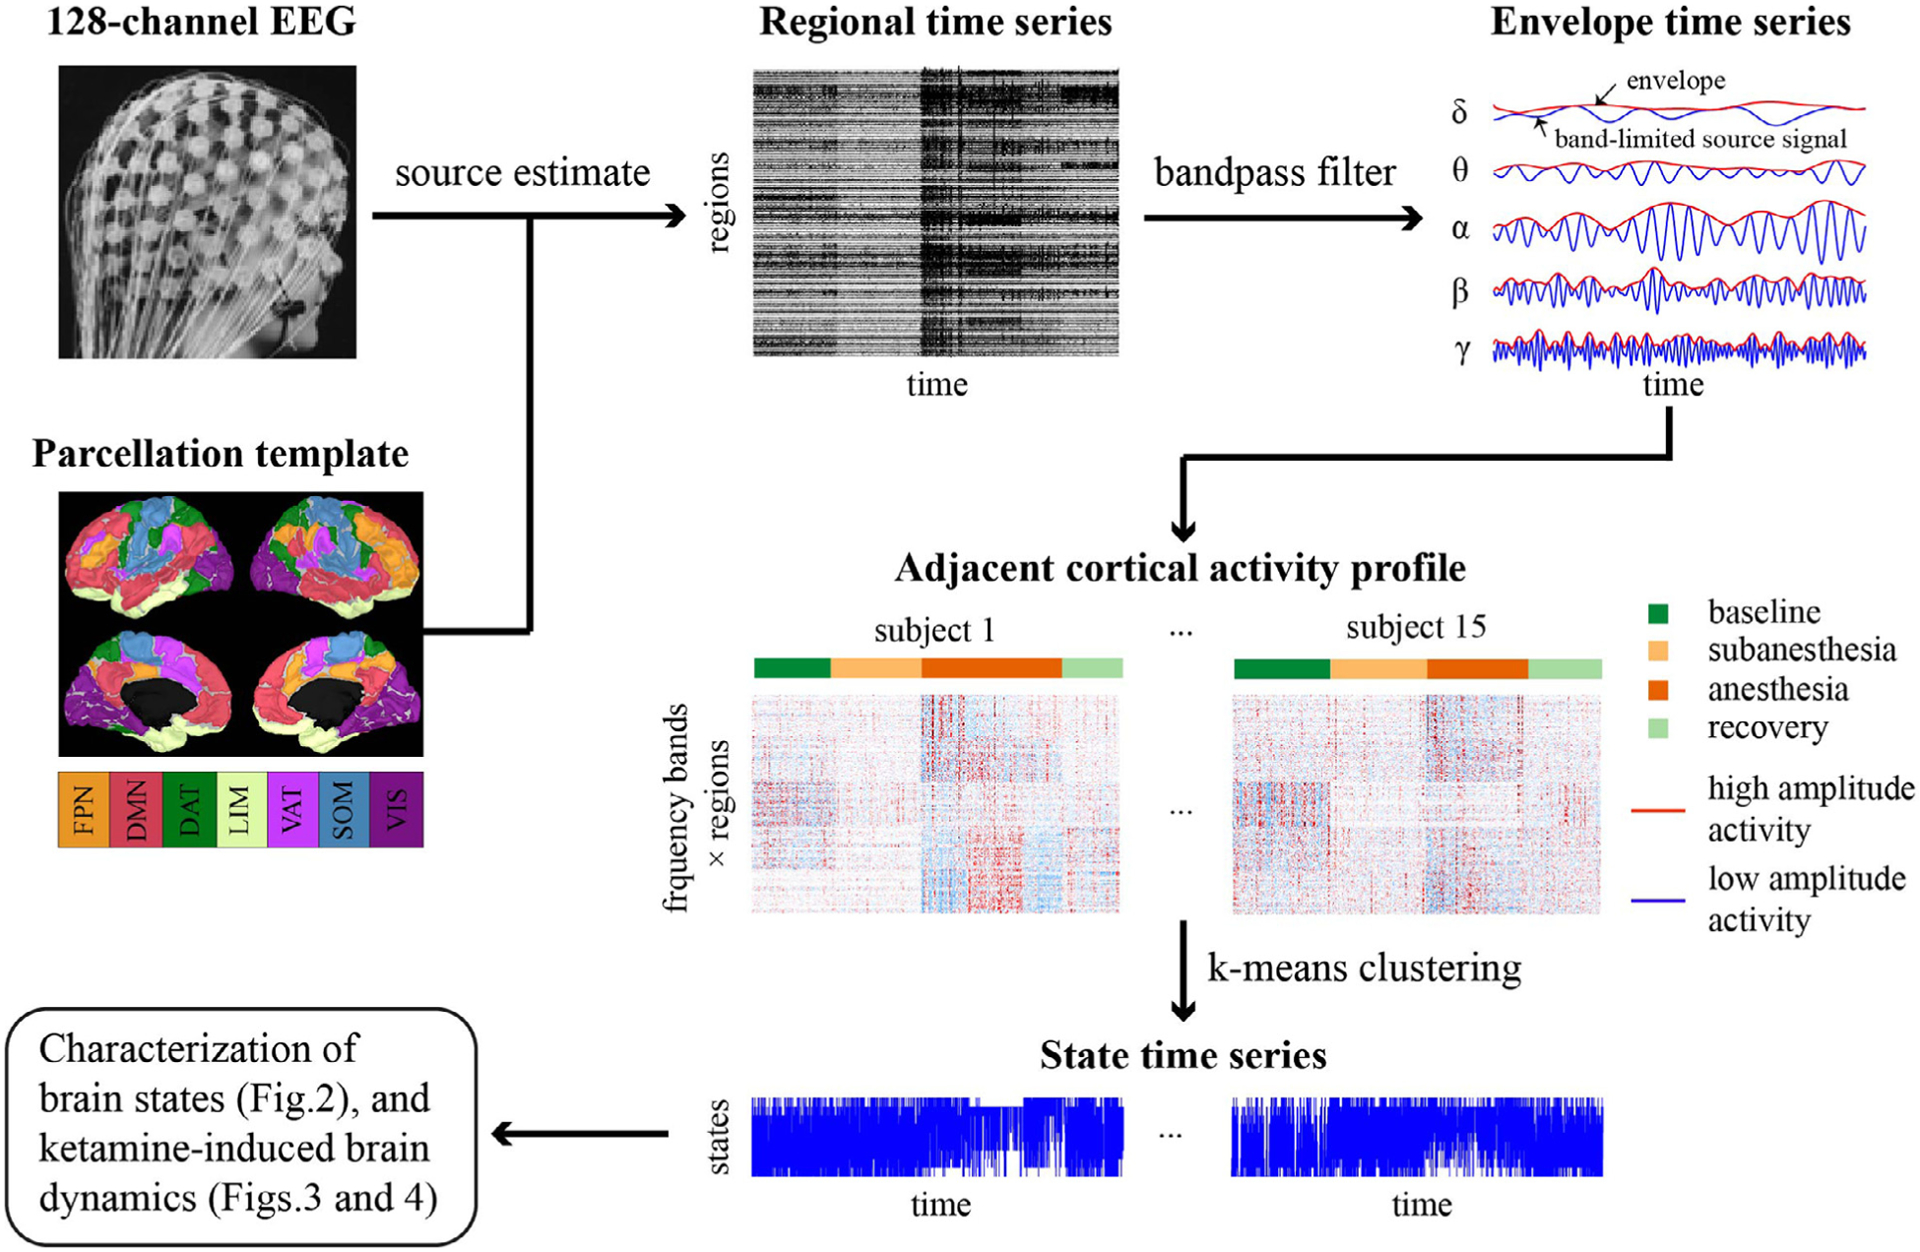
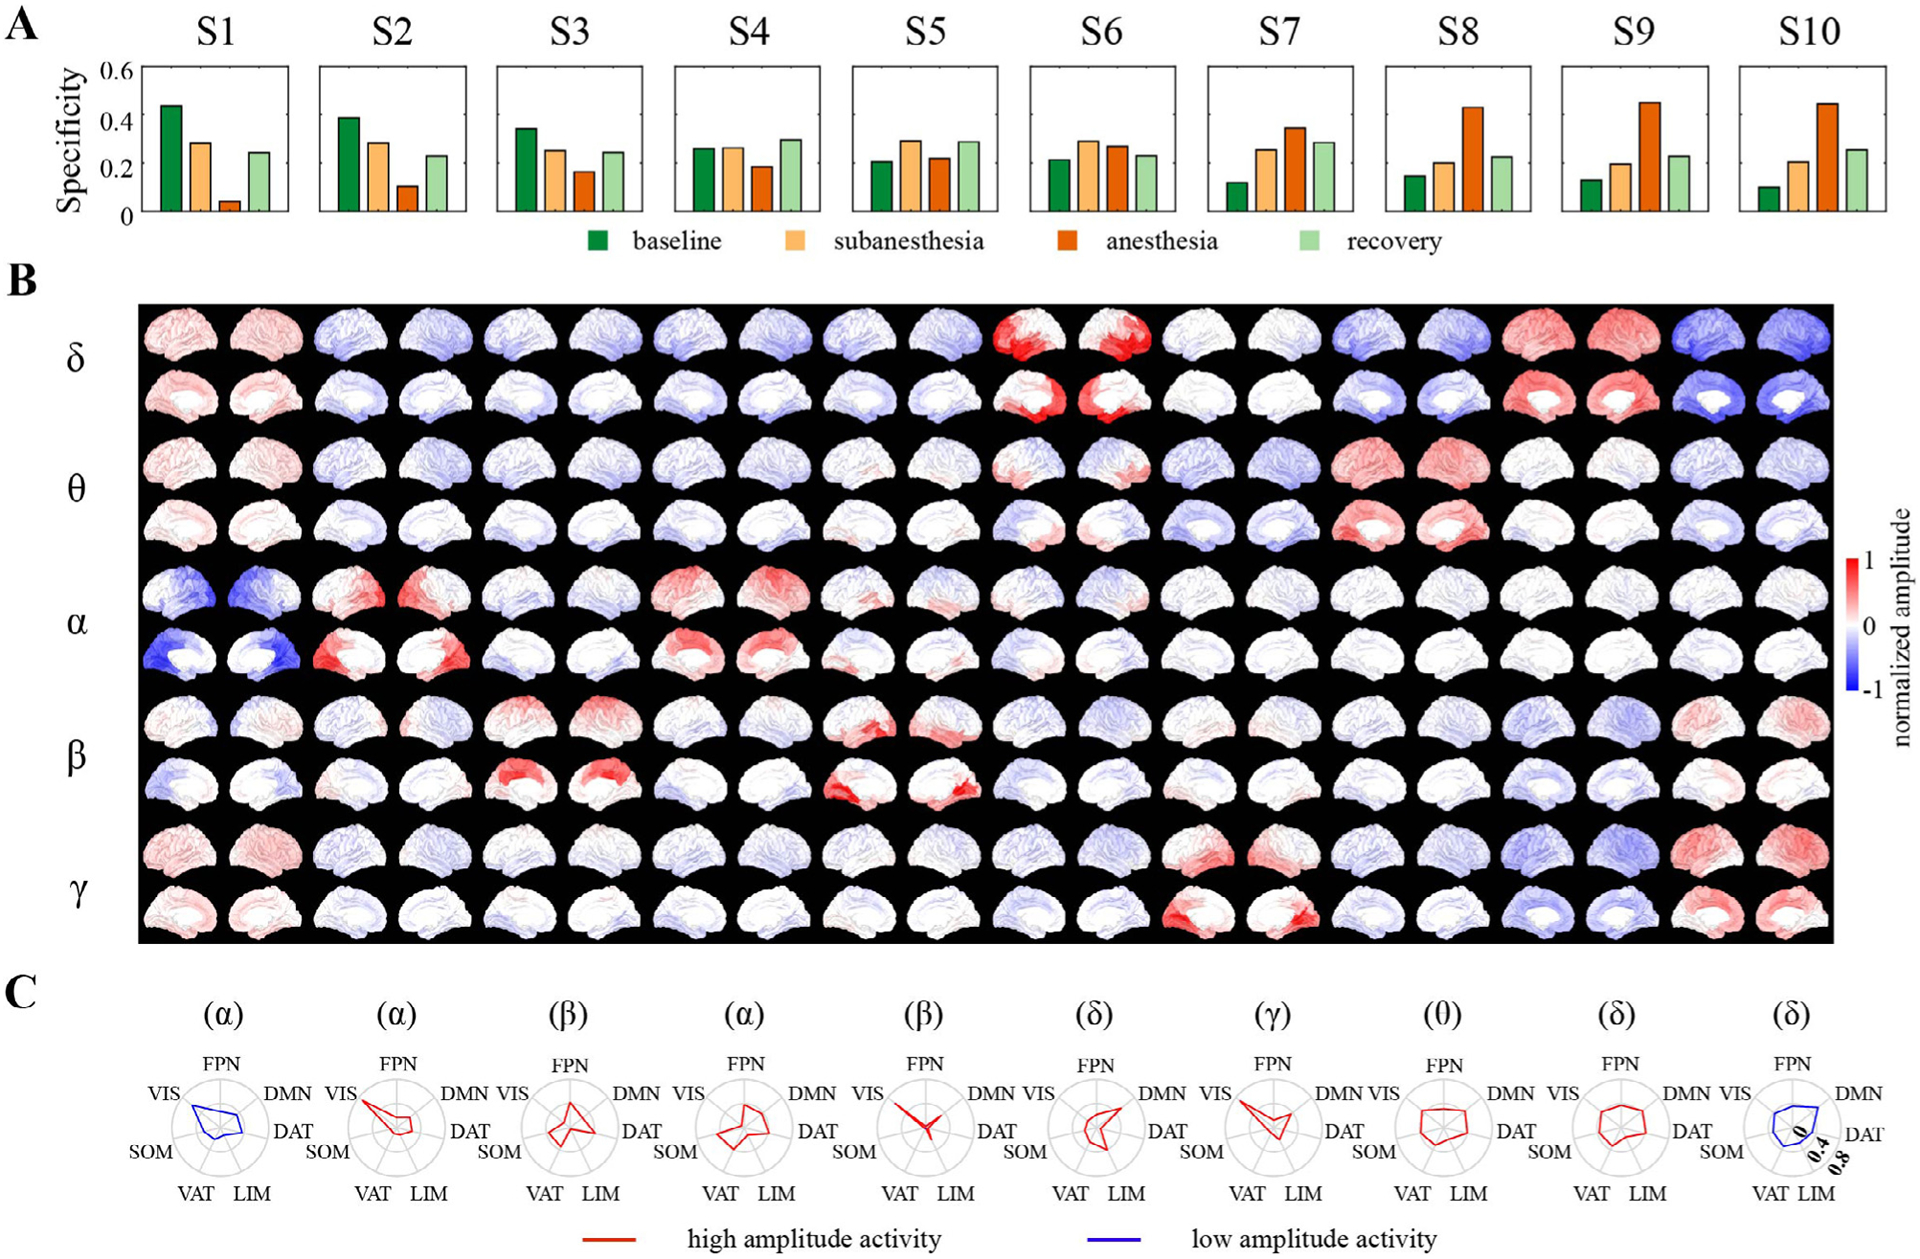
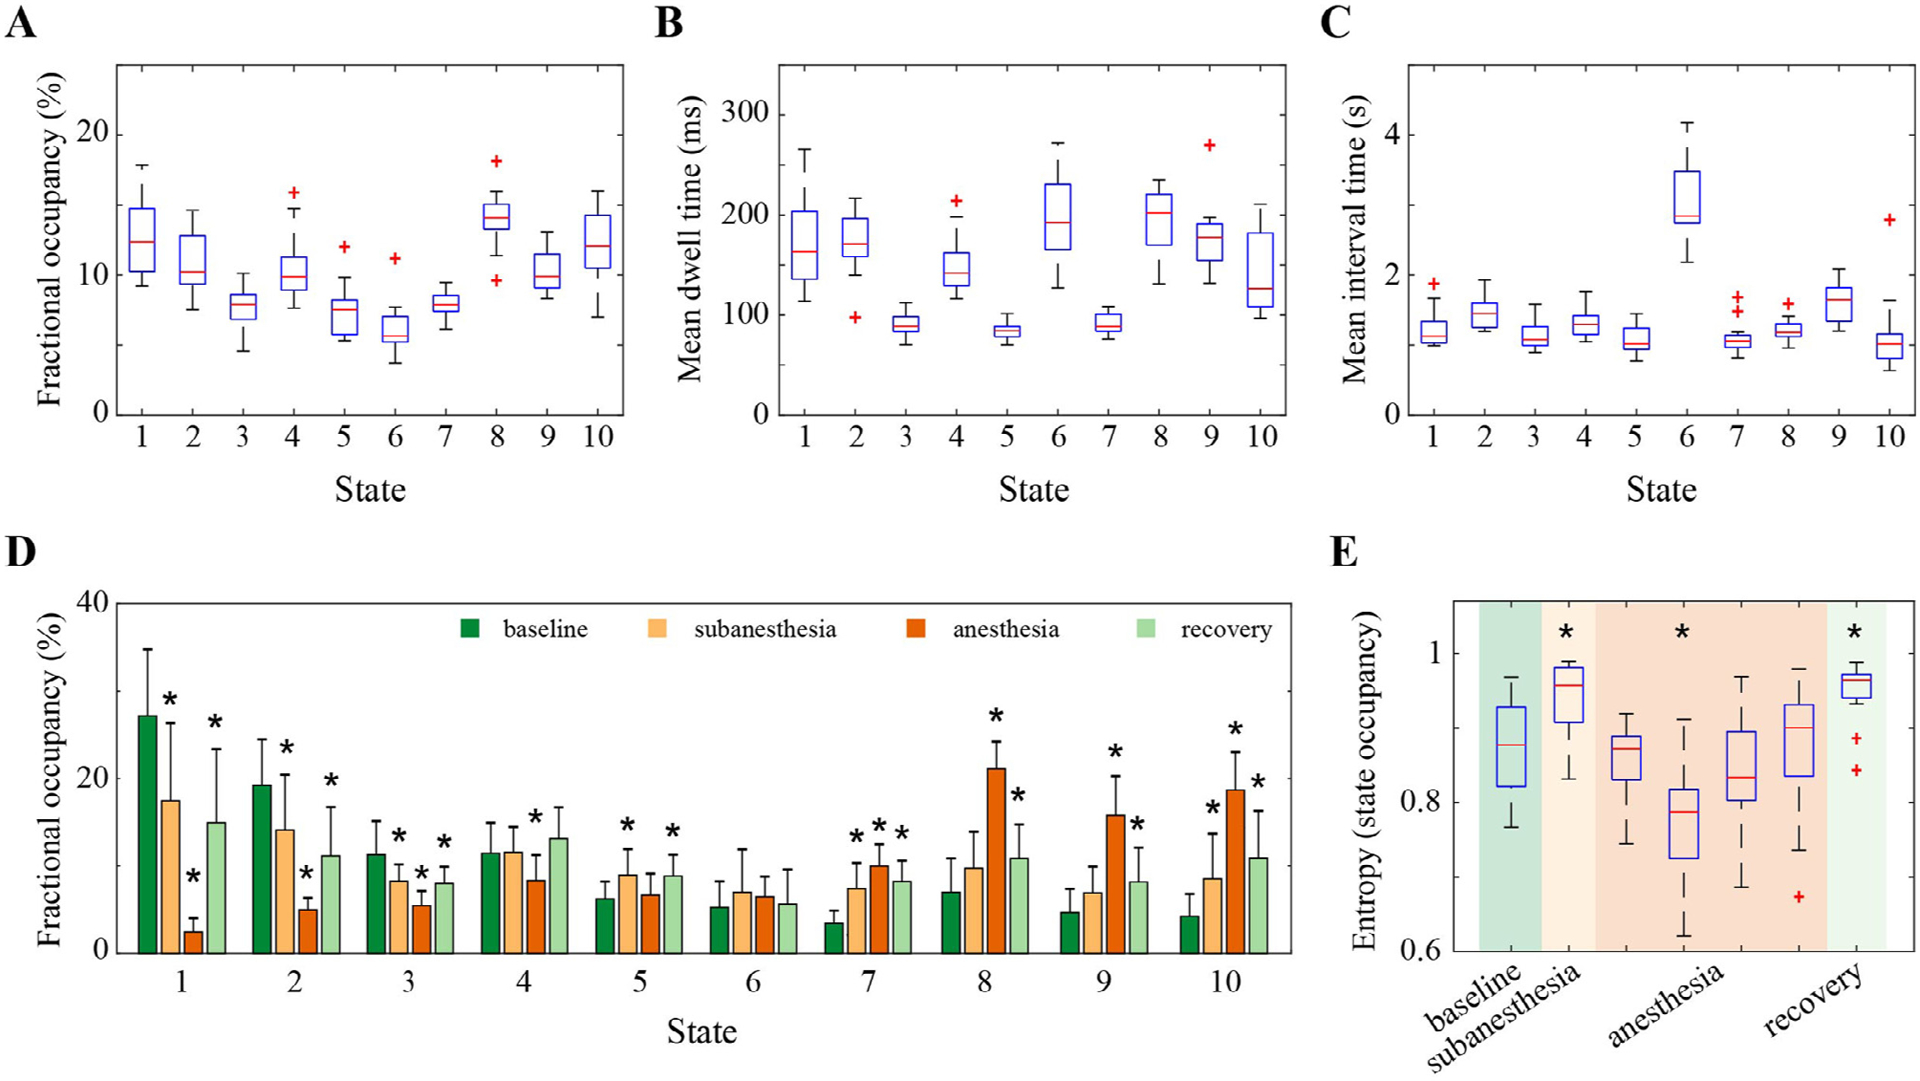
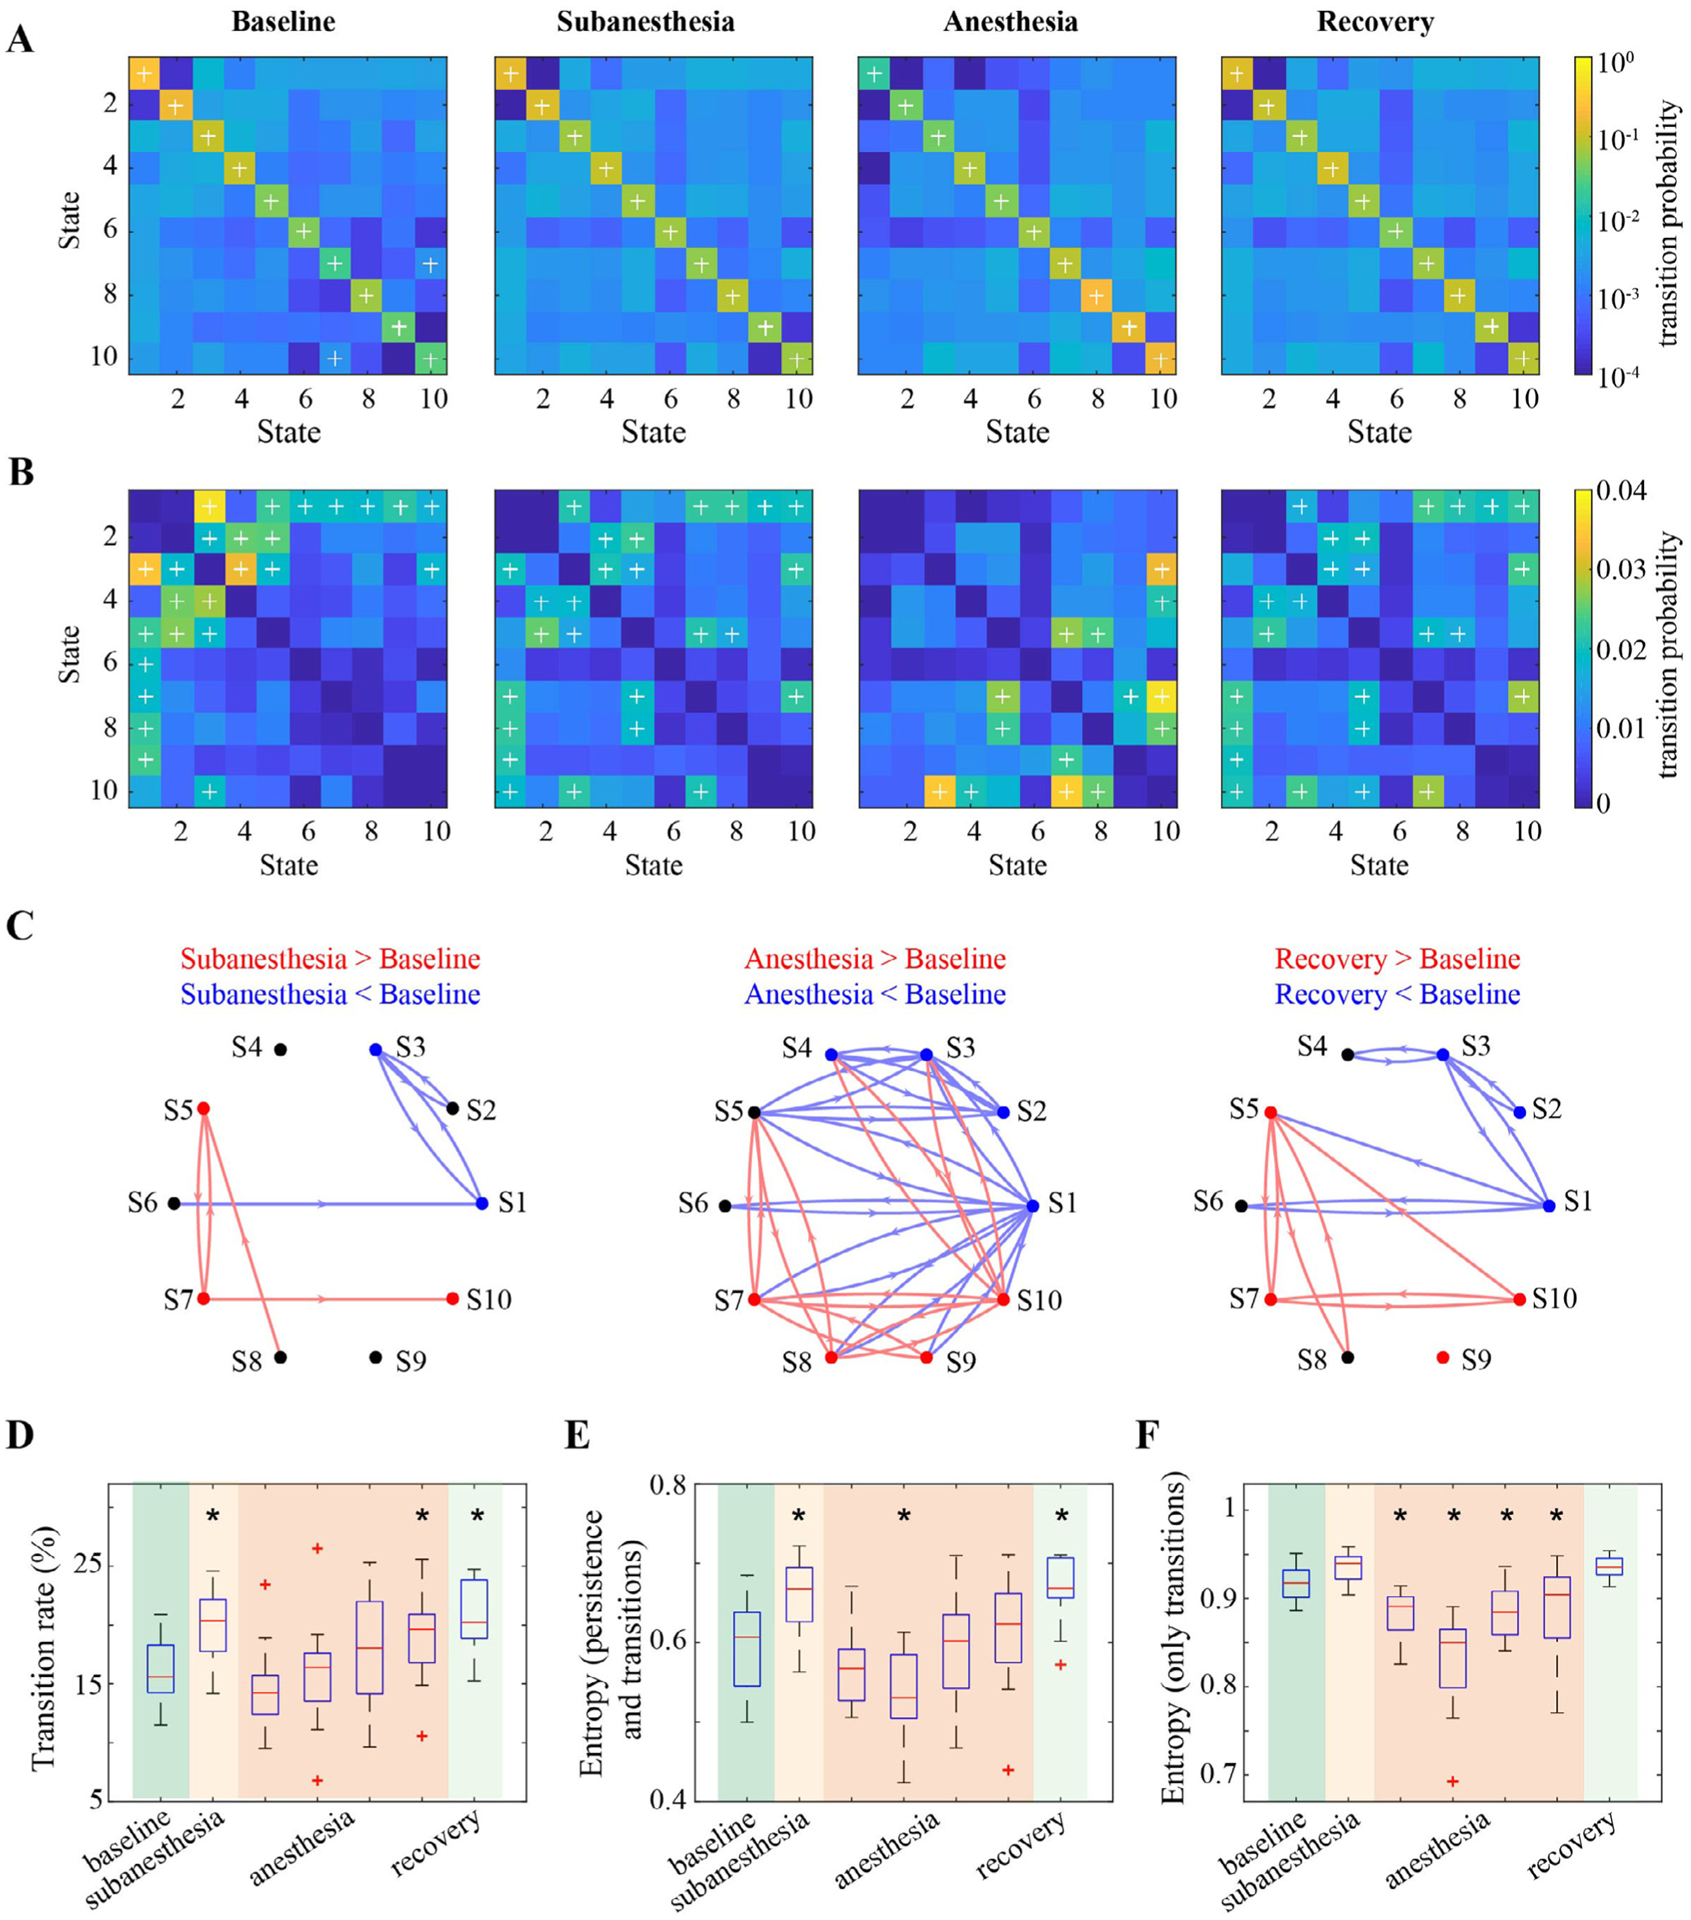
Recent neuroimaging studies have demonstrated that spontaneous brain activity exhibits rich spatiotemporal structure that can be characterized as the exploration of a repertoire of spatially distributed patterns that recur over time. The repertoire of brain states may reflect the capacity for consciousness, since general anesthetics suppress and psychedelic drugs enhance such dynamics. However, the modulation of brain activity repertoire across varying states of consciousness has not yet been studied in a systematic and unified framework. As a unique drug that has both psychedelic and anesthetic properties depending on the dose, ketamine offers an opportunity to examine brain reconfiguration dynamics along a continuum of consciousness. Here we investigated the dynamic organization of cortical activity during wakefulness and during altered states of consciousness induced by different doses of ketamine. Through k-means clustering analysis of the envelope data of source-localized electroencephalographic (EEG) signals, we identified a set of recurring states that represent frequency-specific spatial coactivation patterns. We quantified the effect of ketamine on individual brain states in terms of fractional occupancy and transition probabilities and found that ketamine anesthesia tends to shift the configuration toward brain states with low spatial variability. Furthermore, by assessing the temporal dynamics of the occurrence and transitions of brain states, we showed that subanesthetic ketamine is associated with a richer repertoire, while anesthetic ketamine induces dynamic changes in brain state organization, with the repertoire richness evolving from a reduced level to one comparable to that of normal wakefulness before recovery of consciousness. These results provide a novel description of ketamine's modulation of the dynamic configuration of cortical activity and advance understanding of the neurophysiological mechanism of ketamine in terms of the spatial, temporal, and spectral structures of underlying whole-brain dynamics.
Keywords: Electroencephalography; General anesthesia; Ketamine; Psychedelic.
Copyright © 2022 The Author(s). Published by Elsevier Inc. All rights reserved.
Conflict of interest statement
Declaration of Competing Interest The authors declare that there is no conflict of interest.
Figures
Similar articles
-
Cortical dynamics during psychedelic and anesthetized states induced by ketamine.Neuroimage. 2019 Aug 1;196:32-40. doi: 10.1016/j.neuroimage.2019.03.076. Epub 2019 Apr 5. Neuroimage. 2019. PMID: 30959192 Free PMC article.
-
Cortical high-frequency oscillations (≈ 110 Hz) in cats are state-dependent and enhanced by a subanesthetic dose of ketamine.Behav Brain Res. 2025 Jan 5;476:115231. doi: 10.1016/j.bbr.2024.115231. Epub 2024 Aug 30. Behav Brain Res. 2025. PMID: 39218075 Review.
-
Consciousness and Complexity during Unresponsiveness Induced by Propofol, Xenon, and Ketamine.Curr Biol. 2015 Dec 7;25(23):3099-105. doi: 10.1016/j.cub.2015.10.014. Epub 2015 Nov 19. Curr Biol. 2015. PMID: 26752078
-
[The characteristics of the spatial organization of the human EEG in ketamine-altered consciousness].Zh Vyssh Nerv Deiat Im I P Pavlova. 1998 Mar-Apr;48(2):195-205. Zh Vyssh Nerv Deiat Im I P Pavlova. 1998. PMID: 9644799 Russian.
-
The Neural Circuits Underlying General Anesthesia and Sleep.Anesth Analg. 2021 May 1;132(5):1254-1264. doi: 10.1213/ANE.0000000000005361. Anesth Analg. 2021. PMID: 33857967 Free PMC article. Review.
Cited by
-
The role of NMDARs in the anesthetic and antidepressant effects of ketamine.CNS Neurosci Ther. 2024 Apr;30(4):e14464. doi: 10.1111/cns.14464. Epub 2023 Sep 7. CNS Neurosci Ther. 2024. PMID: 37680076 Free PMC article. Review.
-
Ketamine-induced static and dynamic functional connectivity changes are modulated by opioid receptors and biological sex in rats.Neuropsychopharmacology. 2025 Apr 19. doi: 10.1038/s41386-025-02108-0. Online ahead of print. Neuropsychopharmacology. 2025. PMID: 40253549
-
Electrophysiological Correlates of Lucid Dreaming: Sensor and Source Level Signatures.J Neurosci. 2025 May 14;45(20):e2237242025. doi: 10.1523/JNEUROSCI.2237-24.2025. J Neurosci. 2025. PMID: 40258661
-
Transient brain-wide coactivations and structured transitions revealed in hemodynamic imaging data.Neuroimage. 2022 Oct 15;260:119460. doi: 10.1016/j.neuroimage.2022.119460. Epub 2022 Jul 19. Neuroimage. 2022. PMID: 35868615 Free PMC article.
-
The Administration of Ketamine Is Associated with Dose-Dependent Stabilization of Cortical Dynamics in Humans.J Neurosci. 2025 May 14;45(20):e1545242025. doi: 10.1523/JNEUROSCI.1545-24.2025. J Neurosci. 2025. PMID: 40204440
References
-
- Atasoy S, Vohryzek J, Deco G, Carhart-Harris RL, Kringelbach ML, Calvey T, 2018. Chapter 4 - common neural signatures of psychedelics: frequency-specific energy changes and repertoire expansion revealed using connectome-harmonic decomposition. In: Progress in Brain Research. Elsevier, pp. 97–120. - PubMed
-
- Baillet S, Mosher JC, Leahy RM, 2001. Electromagnetic brain mapping. IEEE Signal Process. Mag 18, 14–30.
Publication types
MeSH terms
Substances
Grants and funding
LinkOut - more resources
Full Text Sources
Research Materials
