Review
. 2021 Oct;19(5):689-706.
doi: 10.1016/j.gpb.2021.08.012. Epub 2022 Jan 8.

Quantitative Proteomics Using Isobaric Labeling: A Practical Guide

Affiliations
Review

Quantitative Proteomics Using Isobaric Labeling: A Practical Guide

Xiulan Chen et al. Genomics Proteomics Bioinformatics. 2021 Oct.

Abstract

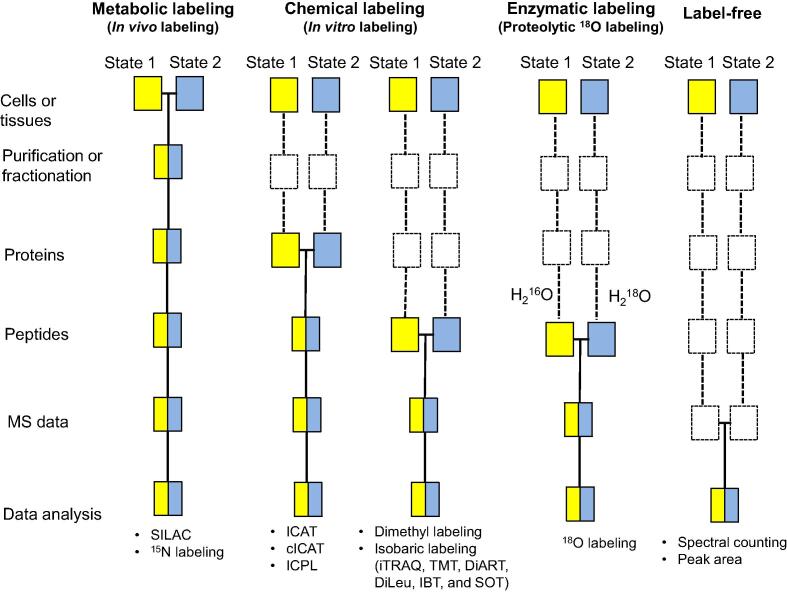
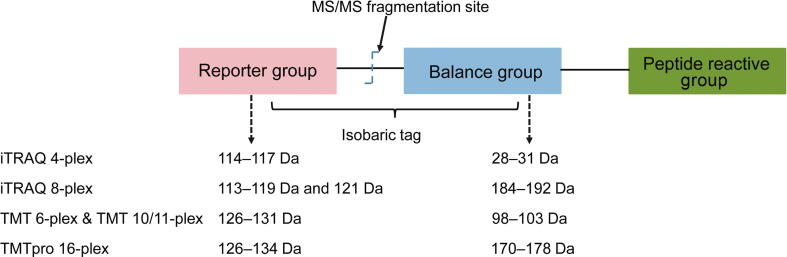
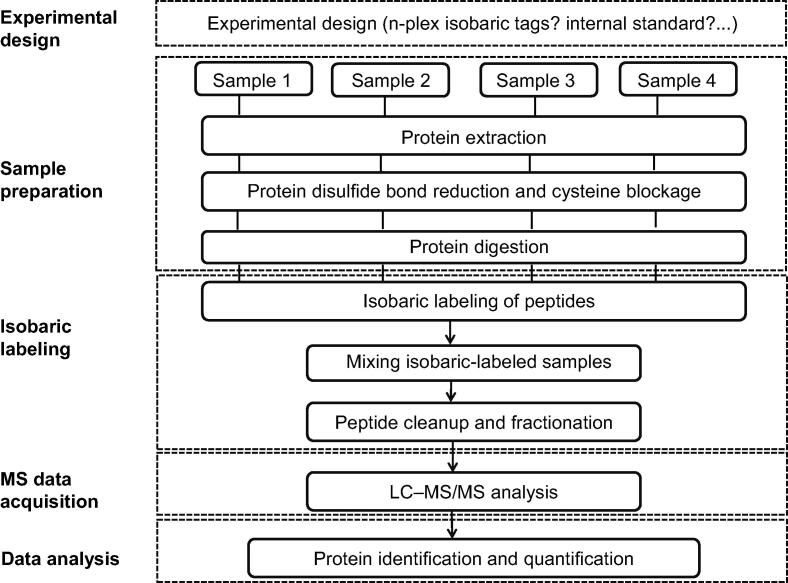
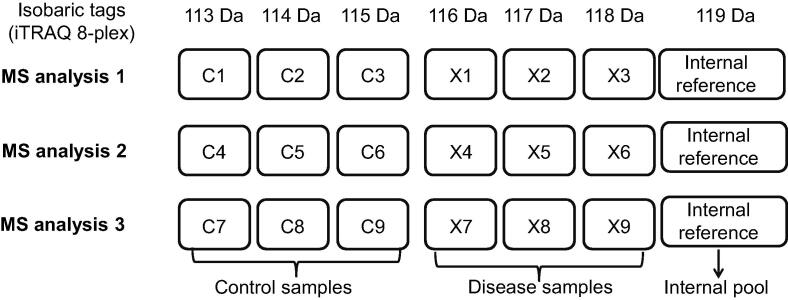
In the past decade, relative proteomic quantification using isobaric labeling technology has developed into a key tool for comparing the expression of proteins in biological samples. Although its multiplexing capacity and flexibility make this a valuable technology for addressing various biological questions, its quantitative accuracy and precision still pose significant challenges to the reliability of its quantification results. Here, we give a detailed overview of the different kinds of isobaric mass tags and the advantages and disadvantages of the isobaric labeling method. We also discuss which precautions should be taken at each step of the isobaric labeling workflow, to obtain reliable quantification results in large-scale quantitative proteomics experiments. In the last section, we discuss the broad applications of the isobaric labeling technology in biological and clinical studies, with an emphasis on thermal proteome profiling and proteogenomics.

Keywords: Isobaric labeling; Mass spectrometry; Quantitative proteomics; TMT; iTRAQ.


Figures

Figure 1
Figure 1
MS-based quantitative proteomics strategies Blue and yellow boxes represent two experimental conditions (shown as State 1 and State 2 in the scheme). Horizontal lines between the boxes indicate that samples from two conditions are pooled together for following procedures. Dashed lines indicate the points at which experimental variation and, thus quantification errors can occur (adapted with permission from [3], [4]). MS, mass spectrometry; SILAC, stable isotope labeling by amino acids in cell culture; ICAT, isotope-coded affinity tags; cICAT, cleavable isotope-coded affinity tags; ICPL, isotope-coded protein label; iTRAQ, isobaric tags for relative and absolute quantitation; TMT, tandem mass tags; DiART, deuterium isobaric amine-reactive tags; DiLeu, N,N-dimethyl leucine; IBT, 10-plex isobaric tags; SOT, a sulfoxide-based isobaric labeling reagent.
Figure 2
Figure 2
Chemical structures of isobaric mass tags and their corresponding reporter m/z values The isobaric mass tags consist of three parts: a peptide reactive group for labeling peptides by targeting the N-terminal amino groups and the ɛ-amino groups of the lysine residues of peptides; a reporter group for obtaining quantitative information on the labeled peptides; a mass balance group for balancing the mass differences between the reporter ion groups. iTRAQ 4-plex reagents have reporter ions of 114–117 Da, and their corresponding balance groups have masses of 28–31 Da, making the total mass of each tag 145 Da. The masses of the reporter ions and the mass balance groups for the iTRAQ 8-plex reagents are 113–121 Da (except 120 Da) and 184–192 Da, respectively, making the total mass of each tag 305 Da. TMT 6-plex and TMT 10/11-plex tags have the same mass of 229 Da. TMT 6-plex reagents have reporter ions of 126–131 Da, and TMT 10/11-plex tags expand the TMT 6-plex tags with 4/5 tag variants with 6.32 mDa mass difference in the reporter ions. The TMTpro 16-plex reagents have reporter ions of 126–134 Da, and the first 11 reporter ions are the same as those in the TMT 11-plex reagents. The total mass of each tag in TMTpro 16-plex reagents is 304 Da. The total mass of the TMTpro 16-plex tags is larger than that of the TMT 10/11-plex tags, possibly due to the use of 9 heavy atoms in the former and 5 heavy atoms in the latter.
Figure 3
Figure 3
Overview ofatypicalisobaric labeling workflow.
Figure 4
Figure 4
iTRAQ/TMT labeling strategy for clinical proteomics C1–C9, control samples, X1–X9, disease samples, Internal reference, internal pooled sample prepared by combining equal amounts of all samples (both control and disease samples). The iTRAQ 8-plex reagents are here used as an example.

Similar articles

Cited by

References

    1. Bensimon A., Heck A.J., Aebersold R. Mass spectrometry-based proteomics and network biology. Annu Rev Biochem. 2012;81:379–405. - PubMed
    1. Gouw J.W., Krijgsveld J., Heck A.J. Quantitative proteomics by metabolic labeling of model organisms. Mol Cell Proteomics. 2010;9:11–24. - PMC - PubMed
    1. Bantscheff M., Schirle M., Sweetman G., Rick J., Kuster B. Quantitative mass spectrometry in proteomics: a critical review. Anal Bioanal Chem. 2007;389:1017–1031. - PubMed
    1. Bantscheff M., Lemeer S., Savitski M.M., Kuster B. Quantitative mass spectrometry in proteomics: critical review update from 2007 to the present. Anal Bioanal Chem. 2012;404:939–965. - PubMed
    1. Zhu W., Smith J.W., Huang C.M. Mass spectrometry-based label-free quantitative proteomics. J Biomed Biotechnol. 2010;2010:1–6. - PMC - PubMed

Publication types

MeSH terms