. 2022 Mar 8;6(5):1454-1463.
doi: 10.1182/bloodadvances.2021006523.

Eculizumab precision-dosing algorithm for thrombotic microangiopathy in children and young adults undergoing HSCT

Affiliations

Eculizumab precision-dosing algorithm for thrombotic microangiopathy in children and young adults undergoing HSCT

Kana Mizuno et al. Blood Adv. .

Abstract

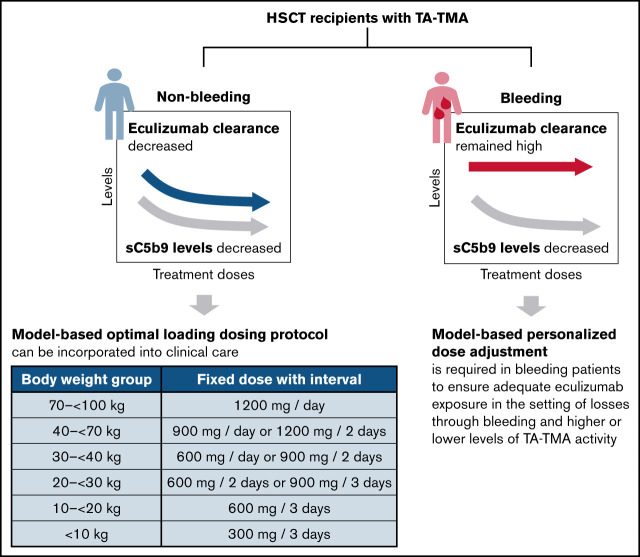
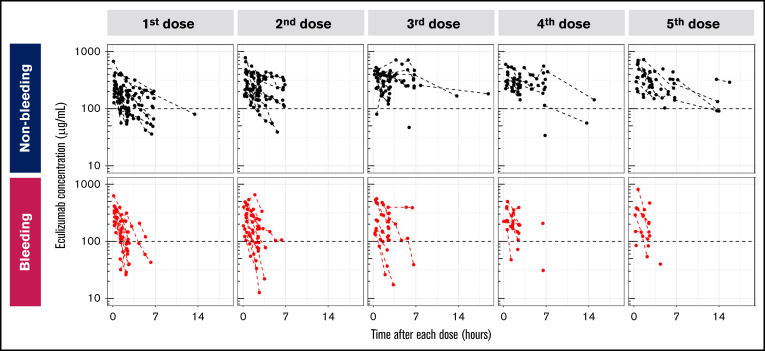
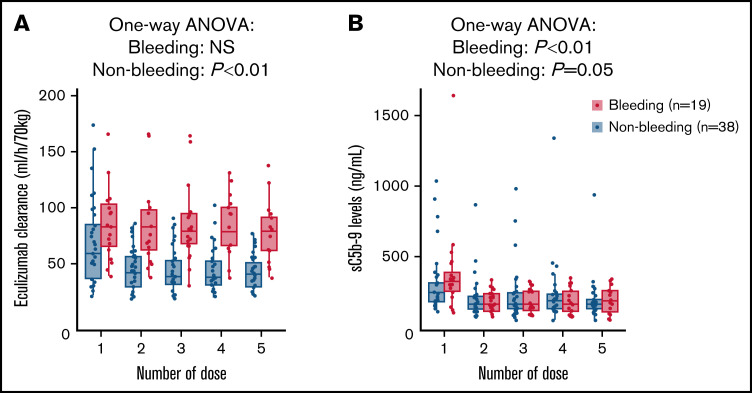
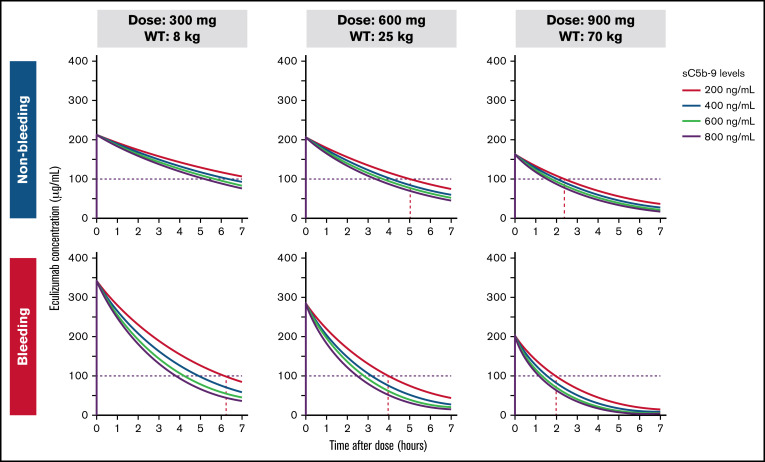
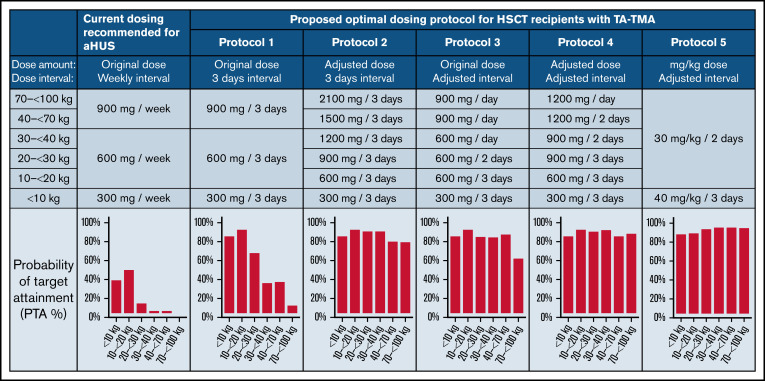
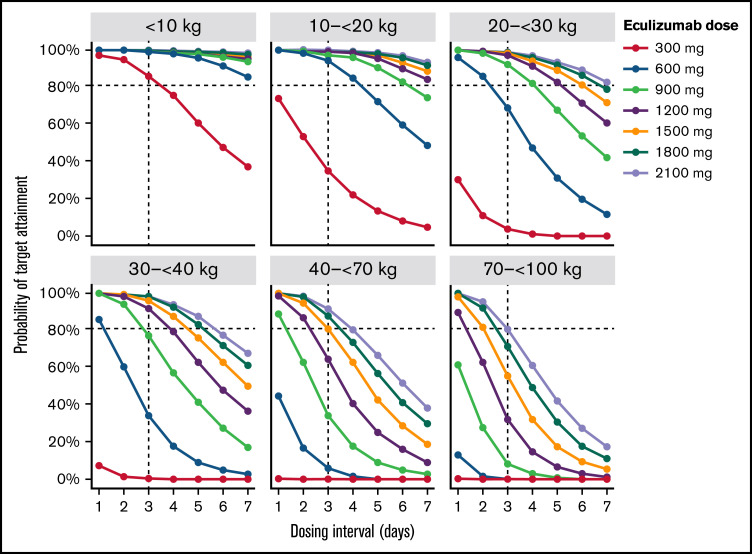
Transplant-associated thrombotic microangiopathy (TA-TMA) is a fatal posttransplant complication of hematopoietic stem cell transplantation. We recently reported that survival for TA-TMA has been improved by early intervention with eculizumab, a complement C5 inhibitor, guided by pharmacokinetic/pharmacodynamic (PK/PD) model-informed precision dosing. However, patients with gastrointestinal bleeding showed poor survival, even when treated with more frequent doses. Our objective was to develop separate models in bleeding and nonbleeding patients with TA-TMA and to propose precision dosing algorithms. Eculizumab PK/PD was analyzed in 19 bleeding and 38 nonbleeding patients (0.5-29.9 years of age). A complement activation biomarker (sC5b-9) and body weight were identified as significant determinants of eculizumab clearance regardless of bleeding. Eculizumab clearance after the first dose was higher in bleeding than in nonbleeding patients (83.8 vs 61.3 mL/h per 70 kg; P = .07). The high clearance was maintained over treatment doses in bleeding patients, whereas nonbleeding patients showed a time-dependent decrease in clearance. sC5b-9 levels were highest before the first dose and decreased over time, regardless of bleeding complications. A Monte Carlo Simulation analysis showed that the current dosing protocols recommended for atypical hemolytic uremic syndrome had <15% probability of attaining the target concentration of >100 μg/mL eculizumab in nonbleeding patients. We identified an intensified loading protocol to reach 80% target attainment. Our data clearly showed the need for individualized dosing for patients with significant bleeding and for ongoing dose adjustments to optimize outcomes. The developed models will be incorporated into a clinical decision guideline for precision dosing to improve outcomes in children and young adults with TA-TMA.


Figures

None
Graphical abstract
Figure 1.
Figure 1.
Eculizumab concentration-time profiles in patients with TA-TMA, with or without bleeding complications. The y-axis shows observed concentrations of eculizumab, and the x-axis shows time after each dose. The black circles represent the data for nonbleeding patients (n = 38) and the red circles represent the data for bleeding patients (n = 19). The data collected from the same patients are connected by dotted lines.
Figure 2.
Figure 2.
Eculizumab clearance and sC5b-9 change over the doses of therapy. PK and PD changes across treatment doses were evaluated using individual eculizumab clearance estimates (A) and predose sC5b-9 levels (B). Eculizumab individual clearance values at each week were estimated by the Bayesian estimation method with consideration of interoccasion variability and adjusted by an allometrically scaled body weight of 70 kg. Because the study included a wide age range (0.5-29.9 years), the effect of an increase in body size on eculizumab clearance was taken into account by adjusting it by allometric scaling to a body weight of 70 kg to allow for a comparison across pediatric and young adult patients with different body sizes as previously described. Eculizumab clearance estimates and changes in sC5b-9 level over time were analyzed by 1-way analysis of variance (R, ver. 3.0.3).
Figure 3.
Figure 3.
Simulation of eculizumab concentration-time profiles. Eculizumab concentration-time profiles over 7 days after the first dose were simulated based on our developed models for nonbleeding and bleeding patients shown in Table 2. The population PK parameter estimates were used for the simulations. Eculizumab concentration-time curves are shown in different colors and represent different predose sC5b-9 levels ranging from 200 to 800 ng/mL. The horizontal dotted pink line represents the suggested eculizumab target concentration of 100 μg/mL.
Figure 4.
Figure 4.
Simulation of optimal dosing algorithms for nonbleeding patients with TA-TMA. The y-axis shows the probability of target attainment determined as the proportion of patients who achieved eculizumab concentrations above the target, and the y-axis shows each body weight cohort. A total of 12 000 age-body weight–matched subjects was randomly sampled from the CDC-NHANES database. Six body weight cohorts were defined as follows: <10 kg, 10 to <20 kg, 20 to <30 kg, 30 to <40 kg, 40 to <70, and 70 to <100 kg. Realistic predose sC5b-9 levels were generated by simulation, to be matched to the observed sC5b-9 distribution. A Monte Carlo Simulation analysis was conducted to predict eculizumab trough concentrations for each dosing scenario according to NONMEM. The original dose used for protocols 1 and 3 is the current dose amount (in milligrams) by weight group approved for aHUS, but administered in intensified dose intervals. Protocols 2 and 4 evaluated the optimal dose (in milligrams) that achieved 80% target attainment considering a dosage strength of 300 mg per vial.
Figure 5.
Figure 5.
Probability of target attainment for various dosing schedules. The x-axis shows eculizumab dosing intervals ranged from 1 to 7 days. The y-axis shows the probability that the percent of target attainment would reach eculizumab the target trough concentration ≥100 μg/mL. The probability of target attainment was predicted for dosing protocols with different dose amount ranged from 300 to 2100 mg and are shown with different colored lines. PTA% close to 100% could be achieved by increasing the dose by 300 mg (1 vial) in each body weight cohort of protocol 4 (Figure 4).

Similar articles

Cited by

References

    1. Jodele S, Davies SM, Lane A, et al. . Diagnostic and risk criteria for HSCT-associated thrombotic microangiopathy: a study in children and young adults. Blood. 2014;124(4):645-653. - PMC - PubMed
    1. Jodele S, Licht C, Goebel J, et al. . Abnormalities in the alternative pathway of complement in children with hematopoietic stem cell transplant-associated thrombotic microangiopathy. Blood. 2013;122(12):2003-2007. - PMC - PubMed
    1. Jodele S, Laskin BL, Dandoy CE, et al. . A new paradigm: Diagnosis and management of HSCT-associated thrombotic microangiopathy as multi-system endothelial injury. Blood Rev. 2015;29(3):191-204. - PMC - PubMed
    1. Jodele S. Complement in pathophysiology and treatment of transplant-associated thrombotic microangiopathies. Semin Hematol. 2018;55(3):159-166. - PubMed
    1. Zhang R, Zhou M, Qi J, et al. . Efficacy and safety of eculizumab in the treatment of transplant-associated thrombotic microangiopathy: a systematic review and meta-analysis. Front Immunol. 2021;11:564647. - PMC - PubMed

Publication types

MeSH terms

Substances