. 2021 Dec 21;14(1):5.
doi: 10.3390/cancers14010005.

Microfluidic-Assisted Preparation of Targeted pH-Responsive Polymeric Micelles Improves Gemcitabine Effectiveness in PDAC: In Vitro Insights

Affiliations

Microfluidic-Assisted Preparation of Targeted pH-Responsive Polymeric Micelles Improves Gemcitabine Effectiveness in PDAC: In Vitro Insights

Rosa Maria Iacobazzi et al. Cancers (Basel). .

Abstract

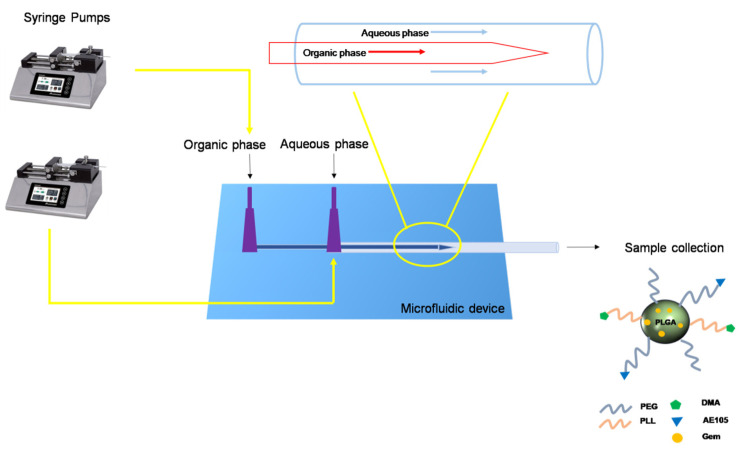
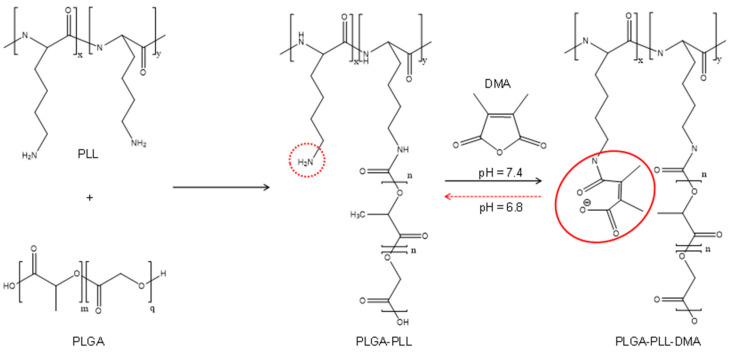
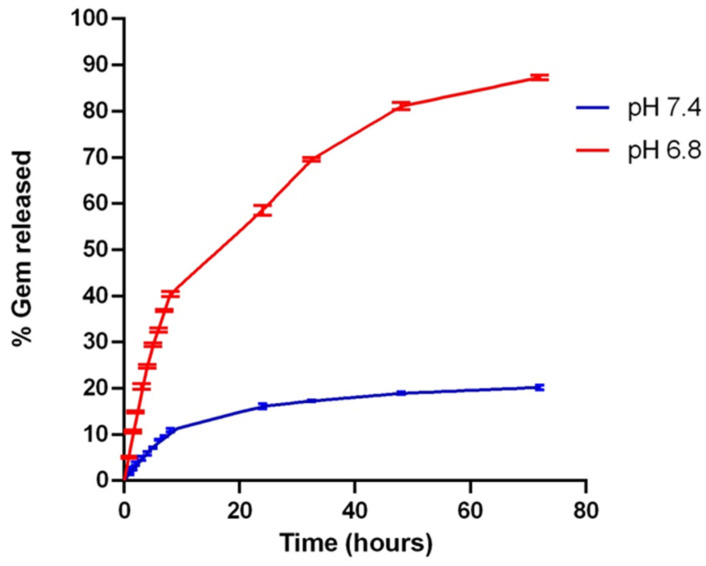
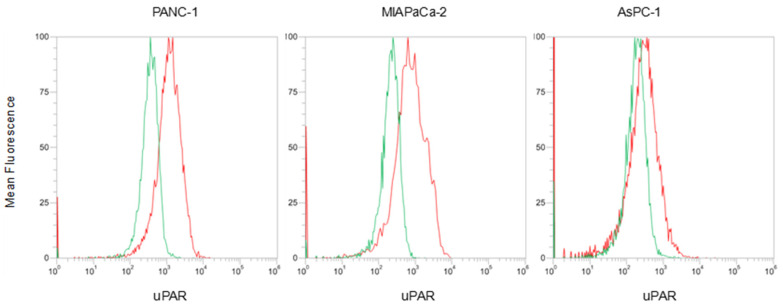
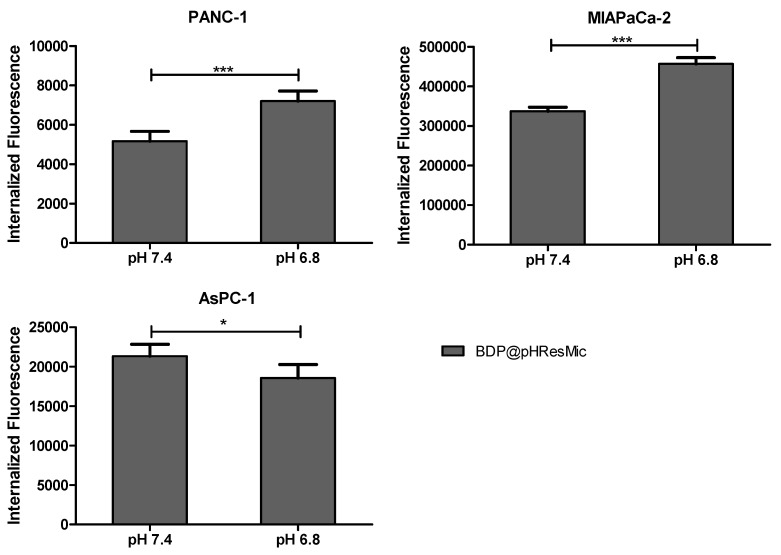
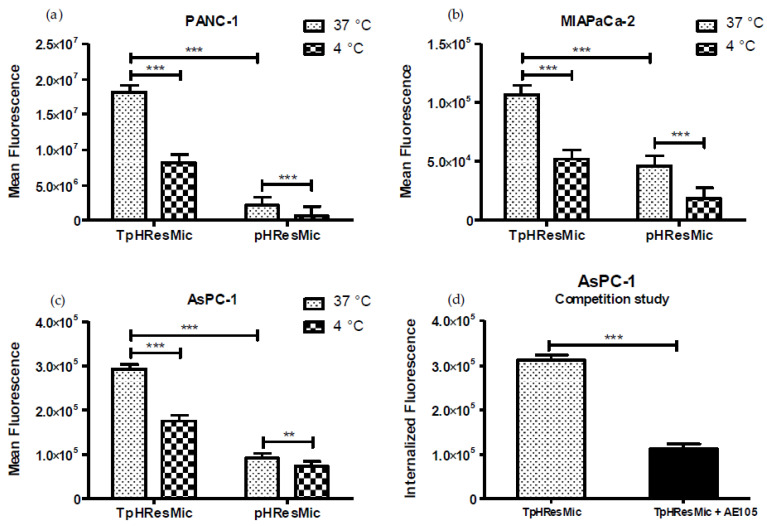
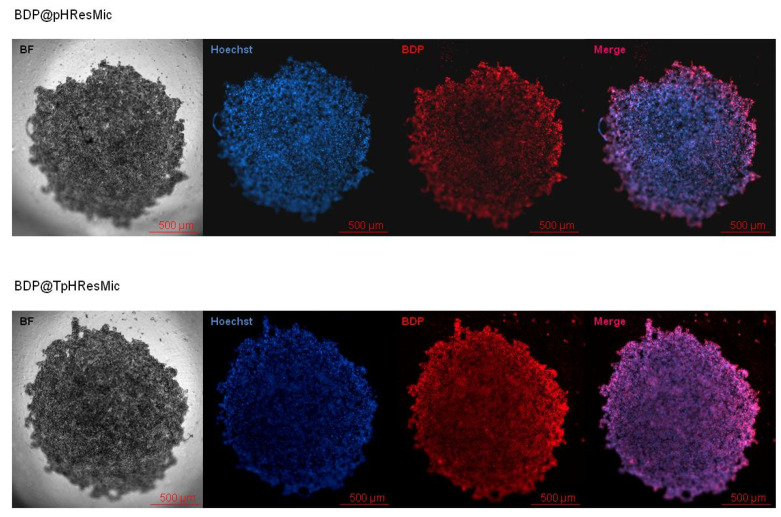
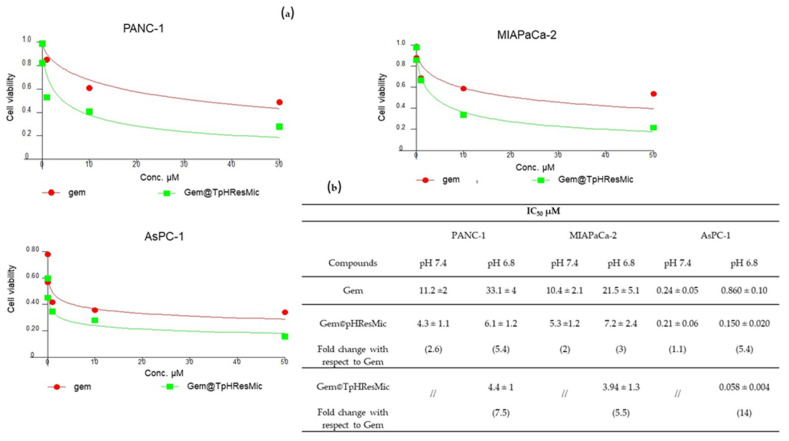
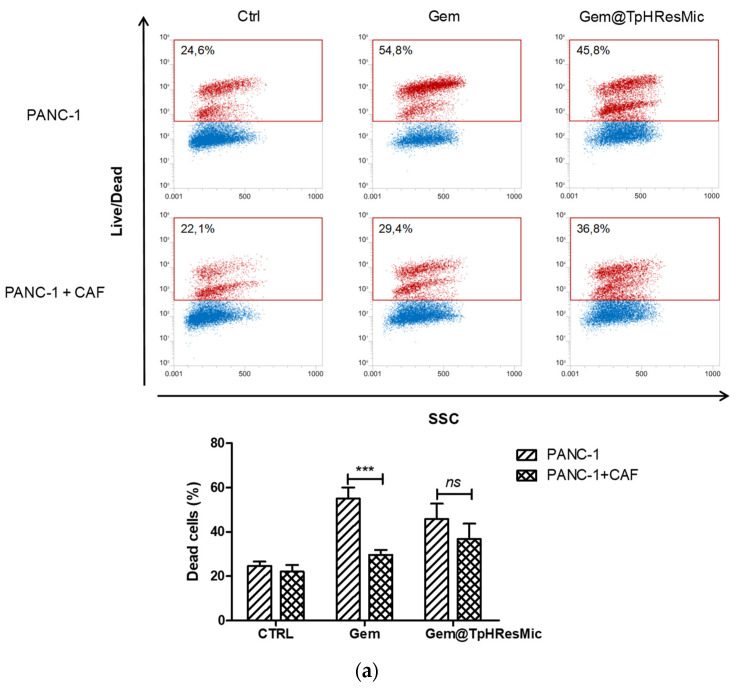
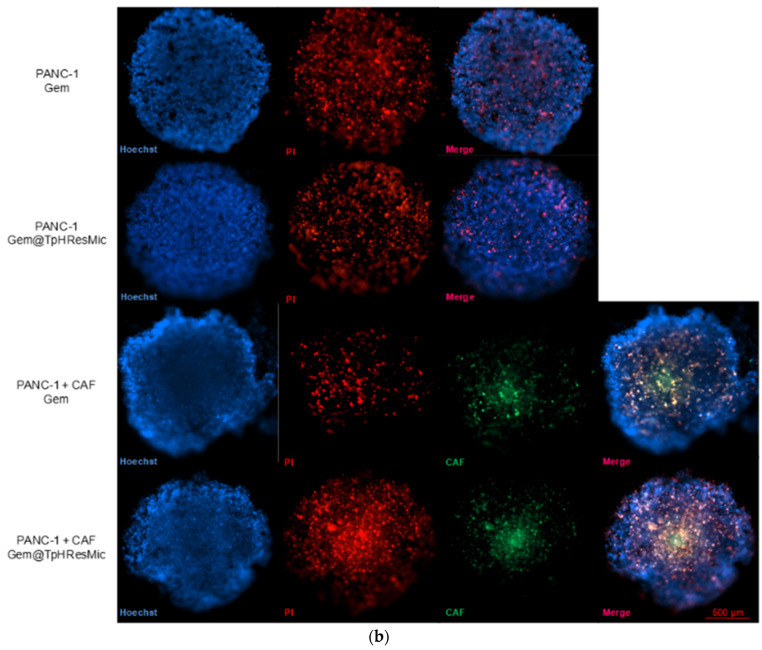
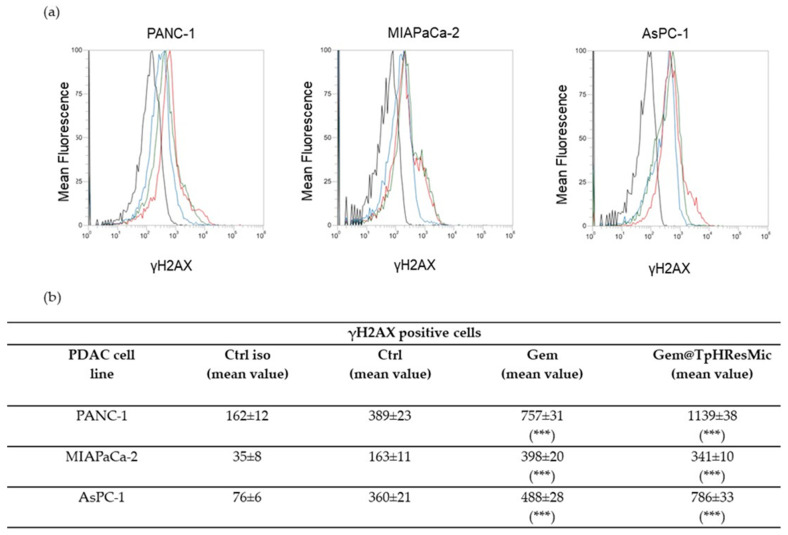
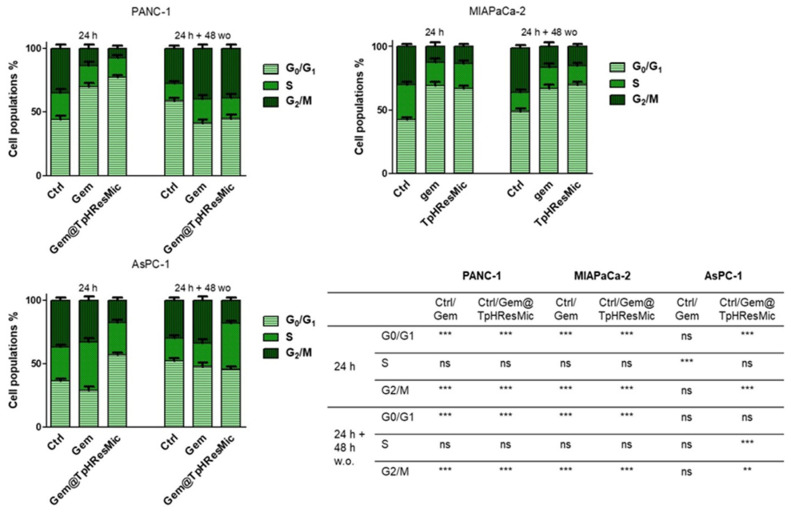
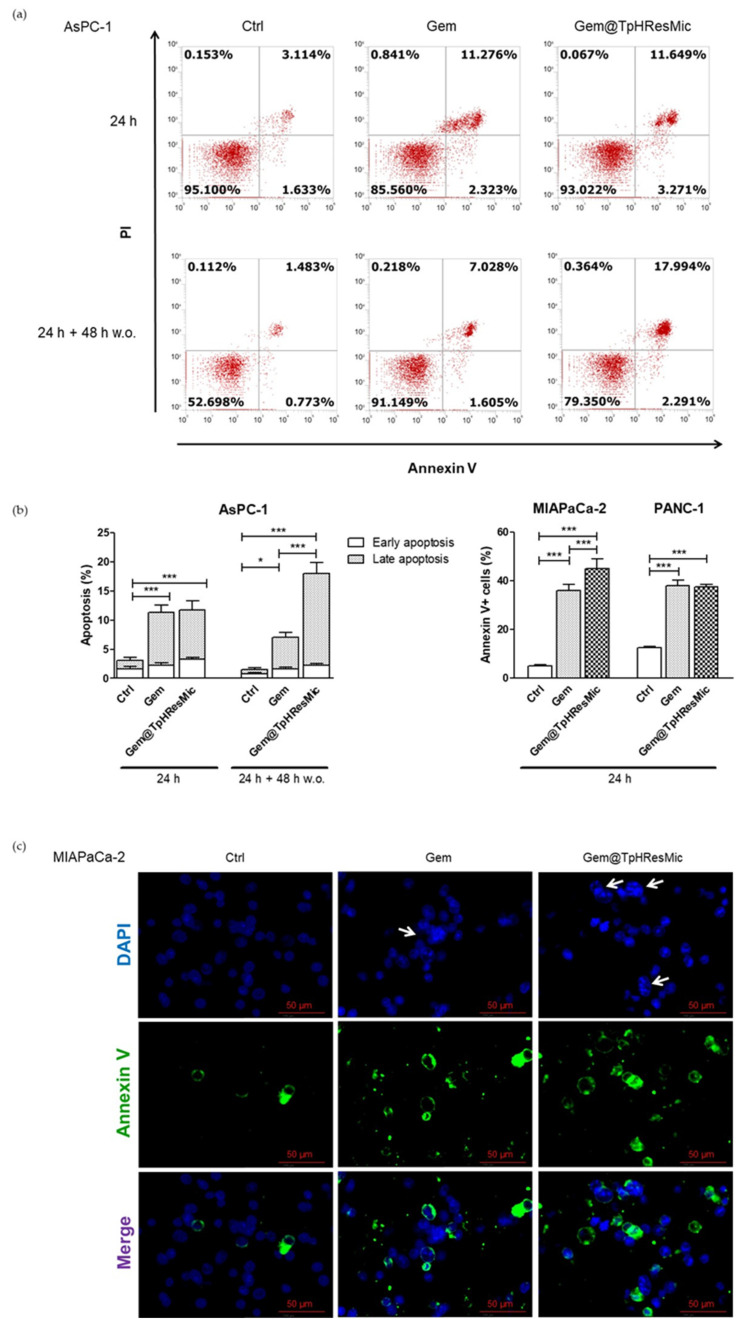
Pancreatic ductal adenocarcinoma (PDAC) represents a great challenge to the successful delivery of the anticancer drugs. The intrinsic characteristics of the PDAC microenvironment and drugs resistance make it suitable for therapeutic approaches with stimulus-responsive drug delivery systems (DDSs), such as pH, within the tumor microenvironment (TME). Moreover, the high expression of uPAR in PDAC can be exploited for a drug receptor-mediated active targeting strategy. Here, a pH-responsive and uPAR-targeted Gemcitabine (Gem) DDS, consisting of polymeric micelles (Gem@TpHResMic), was formulated by microfluidic technique to obtain a preparation characterized by a narrow size distribution, good colloidal stability, and high drug-encapsulation efficiency (EE%). The Gem@TpHResMic was able to perform a controlled Gem release in an acidic environment and to selectively target uPAR-expressing tumor cells. The Gem@TpHResMic displayed relevant cellular internalization and greater antitumor properties than free Gem in 2D and 3D models of pancreatic cancer, by generating massive damage to DNA, in terms of H2AX phosphorylation and apoptosis induction. Further investigation into the physiological model of PDAC, obtained by a co-culture of tumor spheroids and cancer-associated fibroblast (CAF), highlighted that the micellar system enhanced the antitumor potential of Gem, and was demonstrated to overcome the TME-dependent drug resistance. In vivo investigation is warranted to consider this new DDS as a new approach to overcome drug resistance in PDAC.

Keywords: active drug targeting; controlled release; drug delivery; drug resistance; pH-responsiveness; pancreatic ductal adenocarcinoma; tumor microenvironment; uPAR.


Conflict of interest statement

The authors declare no conflict of interest.

Figures

Figure 1
Figure 1
Schematic representation of the microfluidic platform for the production of micelles.
Figure 2
Figure 2
Scheme of synthesis of the PLGA-PLL-DMA copolymer. The continuous red line ring evidences the formation of β-carboxyamide bond which can be hydrolyzed at pH 6.8 in NH2 (red dotted line ring) and DMA.
Figure 3
Figure 3
Scattered light intensity graph (in kilo counts per second—Kcps) obtained for the various concentrations of PLGA-PEG, PLGA-PLL-DMA, and the mixture 1:1 (w/w) of PLGA-PEG/PLGA-PLL-DMA prepared in deionized water. The intersection of the two lines corresponds to the critical micellar concentration.
Figure 4
Figure 4
Stability studies of pHResMic (a) and TpHResMic (b): hydrodynamic diameter and PdI index in PBS pH 7.4 at 37 °C after 72 h. Mean ± SD are reported, n = 3.
Figure 5
Figure 5
In vitro release profiles of Gem from TpHResMic in PBS at 37 °C at two different pH (6.8 and 7.4). Results are reported as mean ± SD, n = 3.
Figure 6
Figure 6
FCM histograms showing the evaluation of uPAR expression on membrane of PDAC cells. Green—cellular autofluorescence; red—uPAR-positive cells.
Figure 7
Figure 7
Histogram plots showing the results of uptake studies of pHResMic on 2D model of PDAC cells. The histograms report the amounts of internalized BDP@pHResMic, expressed as the difference between mean fluorescence at 37 °C and at 4 °C registered values, obtained after 1 h incubation of cells with micelles at pH 7.4 or pH 6.8. Histogram bars represent the mean ± SD of three independent experiments. (* p < 0.05, *** p < 0.001).
Figure 8
Figure 8
(ac) Uptake studies of the targeted (TpHResMic) and no targeted micelles (pHResMic) on 2D model of PDAC cells. The histogram plots report the mean fluorescence values obtained after incubation for 1 h of PDAC cells with BDP@TpHResMic and BDP@pHResMic at pH 6.8 medium and at 37 °C or 4 °C, and refer to three independent experiments. (d) The histogram plots report the mean ± SD of the fluorescence values obtained in the competition study of the targeted BDP@TpHResMic, with AE105 peptide in AsPC−1 cell line. (** p < 0.01, *** p < 0.001).
Figure 9
Figure 9
Fluorescence uptake studies on 3D model of PANC−1 cells. The upper panel shows the bright field (BF) image of the spheroid, the fluorescence intensities of Hoechst (blue—nuclei), BDP (red—BDP@pHResMic), and a merge of them; the lower panel shows the bright field (BF) image of the spheroid, the fluorescence intensities of Hoechst (blue—nuclei), BDP (red—BDP@TpHResMic), and a merge of them. Scale bar 500 μm.
Figure 10
Figure 10
(a) Dose/effect plots of the mean of three different cell viability experiments, conducted in PDAC cell lines incubated for 24 h + 48 h w.o. with free Gem or Gem@TpHResMic. (b) IC50 values of PDAC cell lines treated with all treatment conditions; the data are reported as the mean of three independent experiments.
Figure 11
Figure 11
(a) Representative FCM dot plots of viability analysis conduct on PANC−1 and PANC−1/CAF spheroids after treatment with Gem@TpHResMic or free Gem. The histograms plots show the % of dead cells in all conditions, reported as the mean ± SD of three independent experiments. (b) Representative fluorescence images of viability evaluation in PANC−1 or PANC−1/CAF spheroids (blue—nuclei; green—CAF; red—dead cells). *** p < 0.001. Scale bar 500 μm.
Figure 11
Figure 11
(a) Representative FCM dot plots of viability analysis conduct on PANC−1 and PANC−1/CAF spheroids after treatment with Gem@TpHResMic or free Gem. The histograms plots show the % of dead cells in all conditions, reported as the mean ± SD of three independent experiments. (b) Representative fluorescence images of viability evaluation in PANC−1 or PANC−1/CAF spheroids (blue—nuclei; green—CAF; red—dead cells). *** p < 0.001. Scale bar 500 μm.
Figure 12
Figure 12
(a) Representative FCM histograms showing the γH2AX positive PDAC cells after treatment for 24 h at pH 6.8 with free Gem or Gem@TpHResMic (black line—isotype ctrl; blue line—ctrl; green line—Gem; red line—Gem@TpHResMic). (b) Mean values of γH2AX-positive PDAC cells in all treatment conditions are reported as the mean ± SD of the three independent experiments (*** p < 0.001 as respect to untreated cells; Ctrl—untreated cells).
Figure 13
Figure 13
Cell cycle perturbation of PDAC cells by free Gem and Gem@TpHResMic at pH 6.8 after 24 h and 24 h + 48 h w.o. The modulation of cell cycle phases was evaluated by FCM analysis after staining the cells with propidium iodide. The bar graphs show % cell population distributions in G0/G1, S, or G2/M phases, reported as the mean ± SD of the three independent experiments, and the statistical significances are reported in the table (** p < 0.01, *** p < 0.001).
Figure 14
Figure 14
Evaluation of induction of apoptosis in PDAC cell lines treated with Gem and Gem@TpHResMic. (a) Representative dot plots showing FCM analysis in AsPC−1 cell line. (b) Bar graphs summarizing the results of the assays, as the mean ± SD of the three independent experiments (* p < 0.05, *** p < 0.001). (c) Representative IF images of the MIAPaCa-2 cell line, showing nuclei features (white arrows show polynucleated cells) and Annexin V-positive cells (blue—DAPI-stained nuclei; green—Annexin V).

Similar articles

Cited by

References

    1. AIOM. [(accessed on 15 September 2021)]. Available online: https://www.aiom.it/wp-content/uploads/2020/10/2020_LG_AIOM_Pancreas.pdf.
    1. Siegel R.L., Miller K.D., Jemal A. Cancer Statistics, 2020. CA A Cancer J. Clin. 2020;70:7–30. doi: 10.3322/caac.21590. - DOI - PubMed
    1. Porcelli L., Iacobazzi R.M., Di Fonte R., Serratì S., Intini A., Solimando A.G., Brunetti O., Calabrese A., Leonetti F., Azzariti A., et al. CAFs and TGF-β Signaling Activation by Mast Cells Contribute to Resistance to Gemcitabine/Nabpaclitaxel in Pancreatic Cancer. Cancers. 2019;11:330. doi: 10.3390/cancers11030330. - DOI - PMC - PubMed
    1. Qin C., Yang G., Yang J., Ren B., Wang H., Chen G., Zhao F., You L., Wang W., Zhao Y. Metabolism of Pancreatic Cancer: Paving the Way to Better Anticancer Strategies. Mol. Cancer. 2020;19:50. doi: 10.1186/s12943-020-01169-7. - DOI - PMC - PubMed
    1. Chen X., Zhou W., Liang C., Shi S., Yu X., Chen Q., Sun T., Lu Y., Zhang Y., Guo Q., et al. Codelivery Nanosystem Targeting the Deep Microenvironment of Pancreatic Cancer. Nano Lett. 2019;19:3527–3534. doi: 10.1021/acs.nanolett.9b00374. - DOI - PubMed