. 2021 Dec 23;14(1):59.
doi: 10.3390/cancers14010059.

Spontaneous Physical Activity in Obese Condition Favours Antitumour Immunity Leading to Decreased Tumour Growth in a Syngeneic Mouse Model of Carcinogenesis

Affiliations

Spontaneous Physical Activity in Obese Condition Favours Antitumour Immunity Leading to Decreased Tumour Growth in a Syngeneic Mouse Model of Carcinogenesis

Delphine Le Guennec et al. Cancers (Basel). .

Abstract

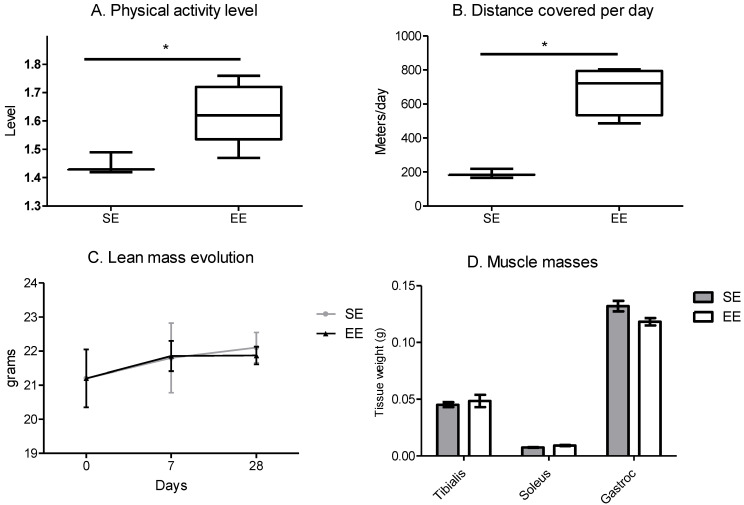
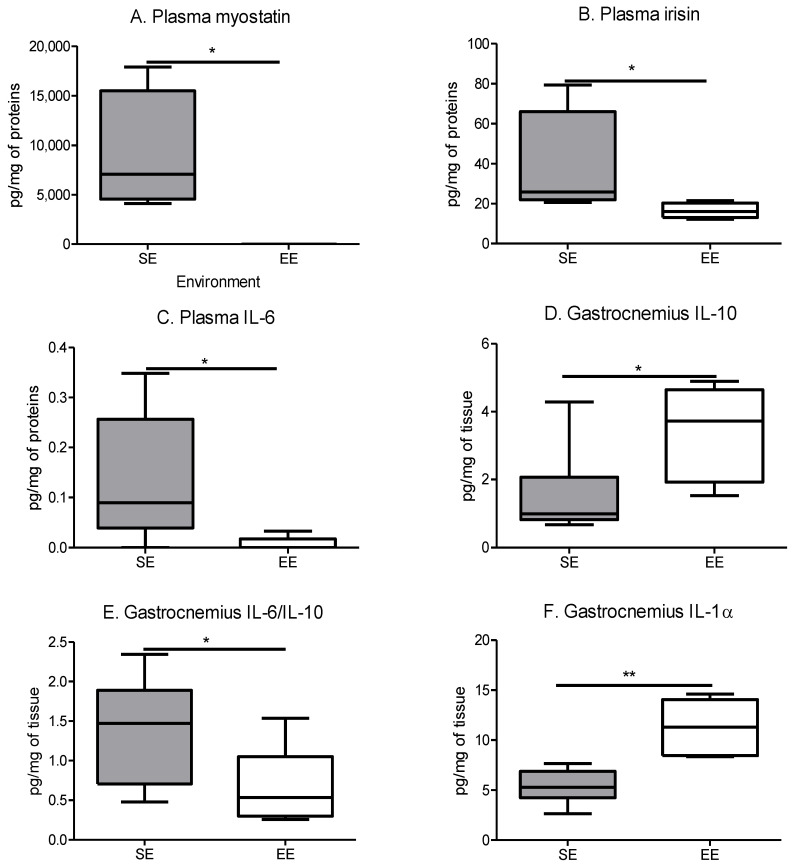
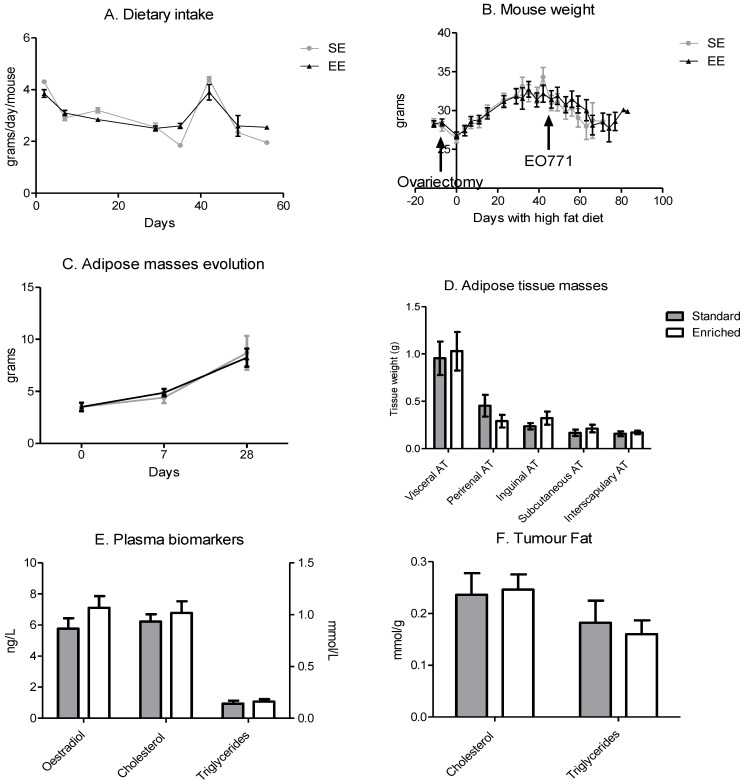
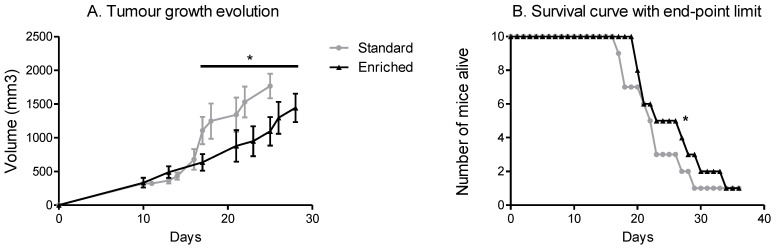
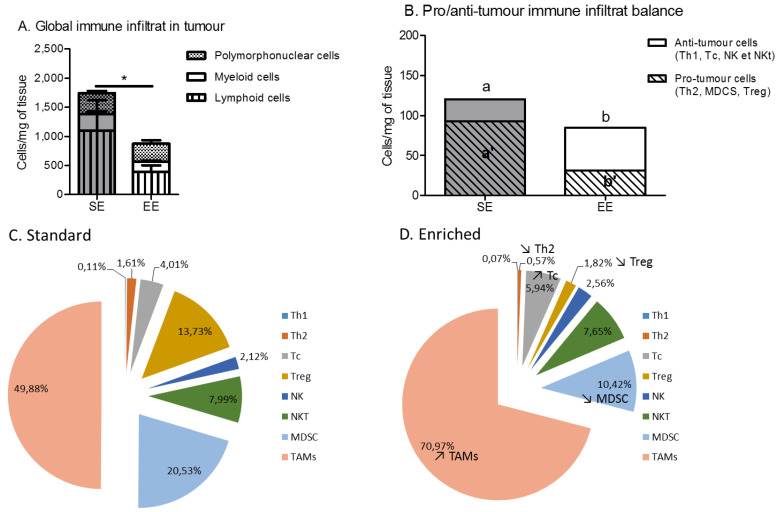
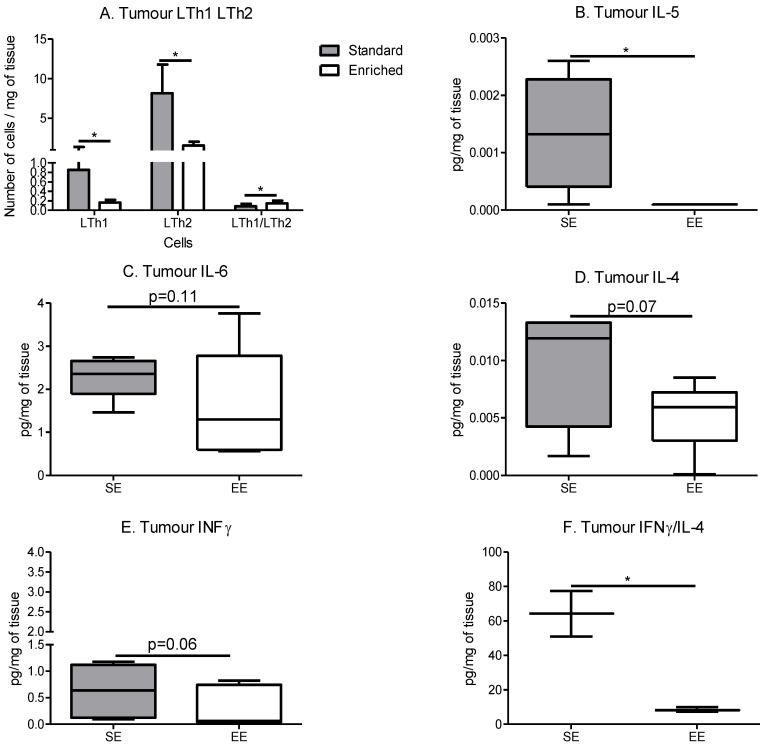
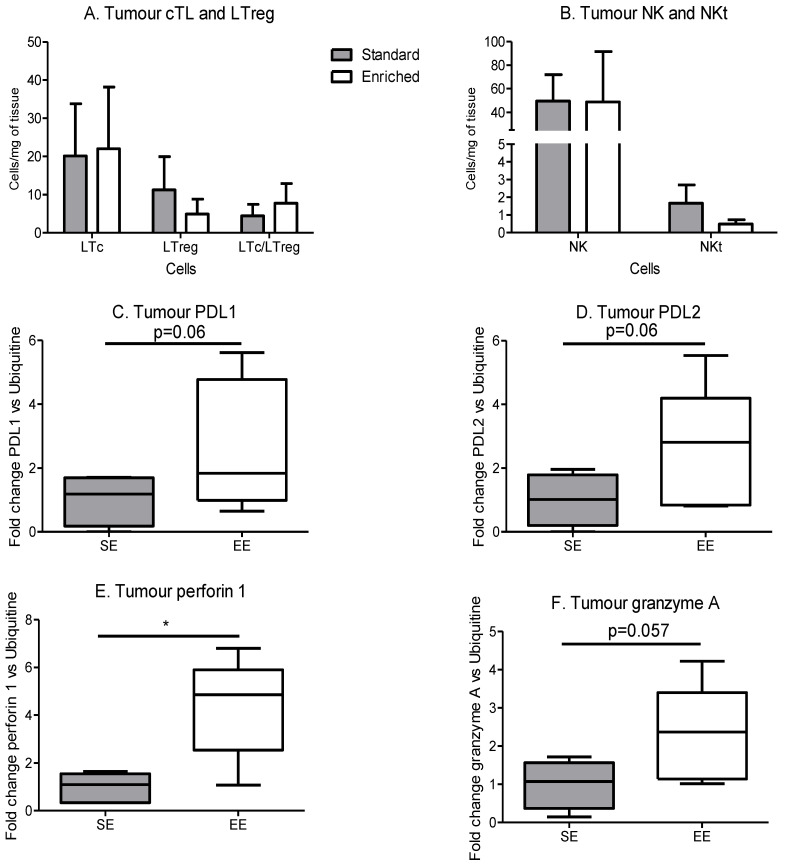
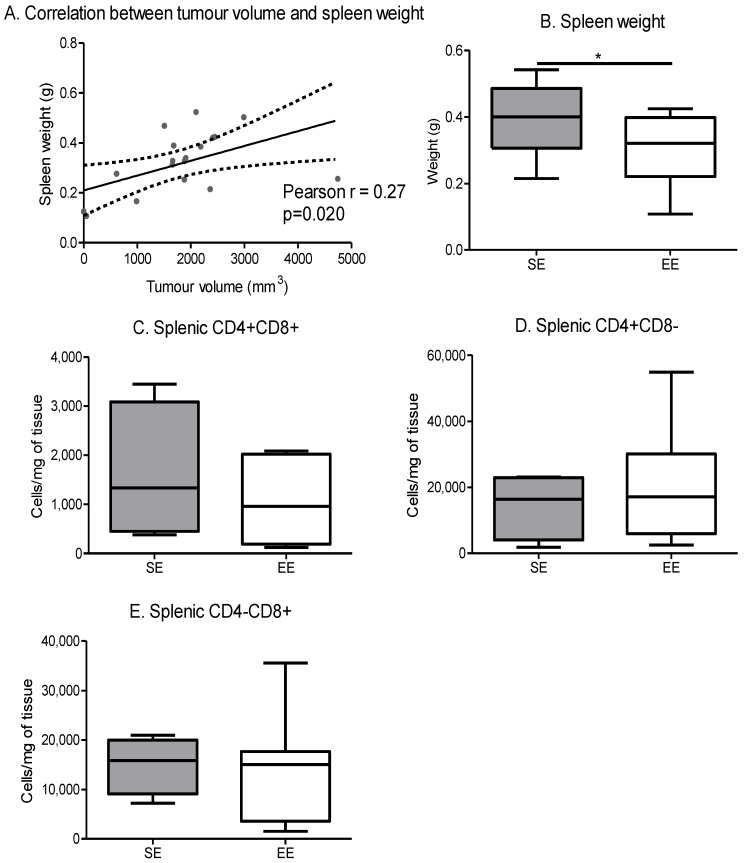
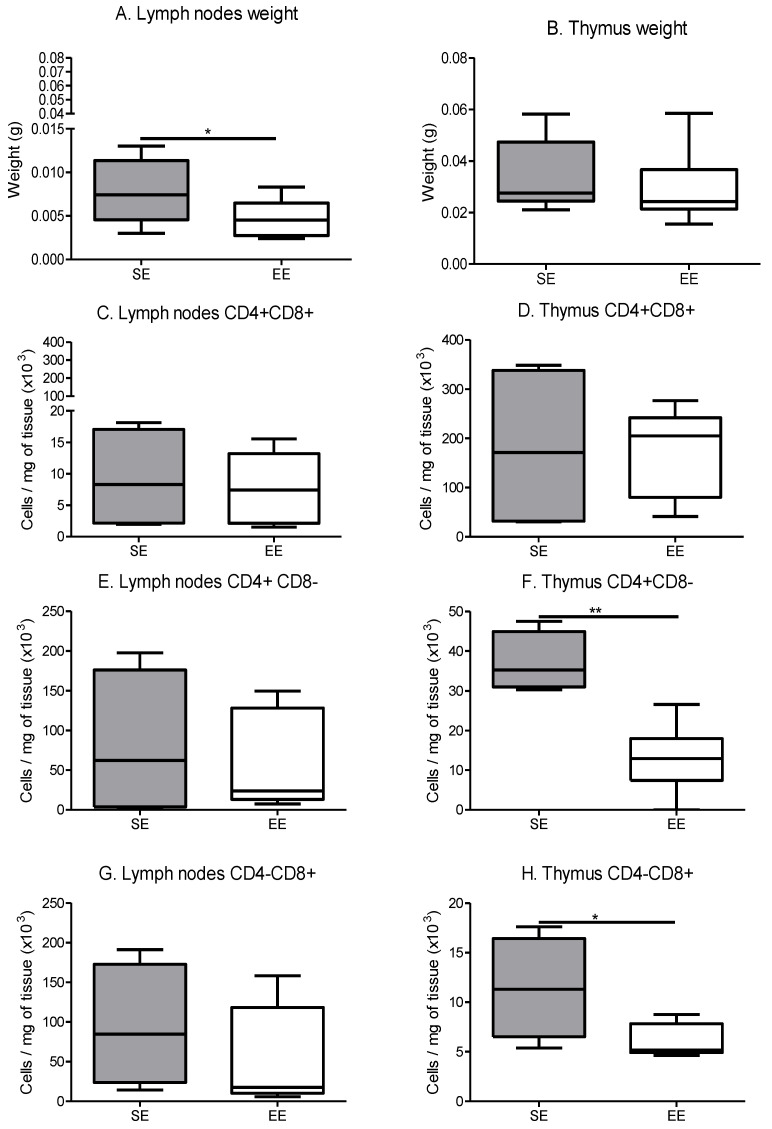
Our goal was to evaluate the effect of spontaneous physical activity on tumour immunity during aging. Elderly (n = 10/group, 33 weeks) ovariectomized C57BL/6J mice fed a hyperlipidic diet were housed in standard (SE) or enriched (EE) environments. After 4 weeks, orthotopic implantation of syngeneic mammary cancer EO771 cells was performed to explore the immune phenotyping in the immune organs and the tumours, as well as the cytokines in the tumour and the plasma. EE lowered circulating myostatin, IL-6 and slowed down tumour growth. Spleen and inguinal lymph node weights reduced in relation to SE. Within the tumours, EE induced a lower content of lymphoid cells with a decrease in Th2, Treg and MDCS; and, conversely, a greater quantity of Tc and TAMs. While no change in tumour NKs cells occurred, granzyme A and B expression increased as did that of perforin 1. Spontaneous physical activity in obese conditions slowed tumour growth by decreasing low-grade inflammation, modulating immune recruitment and efficacy within the tumour.

Keywords: immunosenescence; lymphocytes T helper; mammary carcinogenesis; obesity; perforin 1; physical activity; sedentary lifestyle.


Conflict of interest statement

None of the authors has any conflict of interest to report. The authors are responsible for the content and writing of the paper.

Figures

Figure 1
Figure 1
Enriched environment increases spontaneous physical activity with no change in lean mass. (A) level of physical activity per day per mouse, analysed by TSE system, correspond to total energy expenditure divided by the minimum energy expenditure expressed for a mouse. (means of 5 days follow-up at week 4) (B) distance covered per day per mouse, analysed by TSE system, results are in meters. (means of 5 days follow-up at week 4) (C) time course of lean mass per mouse analysed by EchoMRI. (means of 10 mice/group/days) (D) muscle masses of the posterior legs at sacrifice in grams (means of the two legs per 10 mice/group). Results are mean ± SEM. Data were analysed by Mann–Whitney t-test. Representative data are shown: * p < 0.05, SE vs. EE.
Figure 2
Figure 2
The enriched environment modifies myokine secretions like imposed physical activity. (A) Plasma myostatin concentration. (B) Plasma irisin concentration. (C) Plasma IL-6 concentration. (D) Quantity of IL-10 in gastrocnemius. (E) Ratio of IL-6/IL-10 in gastrocnemius. (F) Quantity of IL-1α in gastrocnemius. Results are in pg/mg of tissue and mean ± SEM (n = 5 mice muscle or plasma samples/group). Data were analysed by Mann–Whitney t-test. Representative data are shown: * p < 0.05, ** p < 0.01, SE vs. EE.
Figure 3
Figure 3
Dietary intakes are equivalent, and the high-fat diet induces an adipose mass gain. (A) Dietary intake per day per mouse, results are in grams per day per mouse. (means of 10 mice/group/days) (B) Mouse weight during experimentation. Day 0 corresponds to the beginning of the high-fat diet. The surgeries are indicated by an arrow on the graph. Results are in grams. (means of 10 mice/group/days) (C) Time course of adipose masses per mouse analysed by EchoMRI. (means of 10 mice/group/days) (D) adipose tissue masses at sacrifice in grams (means of 10 mice/group) (E) Quantity of oestradiol, cholesterol and triglycerides. (n = 5 mice plasma samples/group) (F) Quantity of cholesterol and triglycerides. (n = 5 mice tumour samples/group). Data are mean ± SEM. Data were analysed by ANOVA repeated measures.
Figure 4
Figure 4
Spontaneous physical activity slows down tumour growth and increases survival. (A) Tumour growth evolution depending on the environment, results are in volume (mm3) with an individual calliper measure. (B). Time course of survival with end-point limit. The end-point limit is a 2 cm3 tumour, as required by the rules of ethics. Mean ± SEM (n = 10 mice/group), Data were analysed by ANOVA repeated measures or by Mantel–Cox as appropriate. Representative data are shown: * p < 0.05, SE vs. EE.
Figure 5
Figure 5
Spontaneous physical activity induces a decrease in the immune infiltrate to the benefit of anti-inflammatory and cytotoxic cells. (A) Global immune infiltrate in the tumours, results are in cells per mg of tumour (B) Pro-/anti-tumour immune infiltrate balance in tumour with results in cells per mg of tumour. (C) Immune phenotyping of the immune infiltrate in tumour of standard group, with results in % of immune live cells. (D) Immune phenotyping of the immune infiltrate in tumour of enriched group, with results in % of immune live cells. Data are expressed as mean ± SEM (n = 5 mice tumour phenotyping analysis/group). Data were analysed by Mann–Whitney t-test. Representative data are shown: * p < 0.05, SE vs. EE. Representative data are shown for a and b, and means without a common letter on a same line are significantly different, SE vs. EE.
Figure 6
Figure 6
Spontaneous physical activity induces an immune anti-inflammatory microenvironment in the tumours. (A) Tumour lymphocytes T-helper infiltrate, results are in cells per mg of tumour. (n = 5 mice tumour phenotyping analysis/group) (B) Quantity of IL-5 in tumour, results are in pg/mg of tissue. (C) Quantity of IL-6 in tumour, results are in pg/mg of tissue. (D) Quantity of IL-4 in tumour, results are in pg/mg of tissue. (E) Quantity of IFN-γ in tumour, results are in pg/mg of tissue. (F) Ratio of IFN-γ/IL-4 in tumour, results are a ratio of IFN-γ (in pg/mg of tissue) divided by IL-4 in (in pg/mg of tissue). Cytokine determination is performed on 5 mice tumour samples/group. Data are mean ± SEM. Data were analysed by Mann–Whitney t-test. Representative data are shown: * p < 0.05, SE vs. EE.
Figure 7
Figure 7
Spontaneous physical activity increases immune efficacy without changes in cTL and NKs. (A) Tumour lymphocytes T cytotoxic and regulator infiltrate, results are in cells per mg of tumour. (B) Tumour NK and NKt infiltrate, results are in cells per mg of tumour. (C) Expression of PDL1 in tumour microenvironment, results are in relative expression of mRNA by RT-qPCR, normalized with ubiquitin. (D) Expression of PDL2 in tumour microenvironment, results are in relative expression of mRNA by RT-qPCR, normalized with ubiquitin. (E) Expression of perforin 1 in tumour microenvironment, results are in relative expression of mRNA by RT-qPCR, normalized with ubiquitin. (F) Expression of granzyme A in tumour microenvironment, results are in relative expression of mRNA by RT-qPCR, normalized with ubiquitin. Phenotyping is performed on 5 mice tumour/group. mRNA expression is performed on 5 mice tumour samples/group. Data are expressed as mean ± SEM. Data were analysed by Mann–Whitney t-test. Representative data are shown: * p < 0.05, SE vs. EE.
Figure 8
Figure 8
Spontaneous physical activity decreases spleen weight in correlation with tumour volume. (A) Correlation between tumour volume and spleen weight independent of environment, data were analysed by Pearson’s correlation test (n = 10 mice/group) (B) Spleen weight depending on the environment, results are grams (n = 10 mice/group) (C) Spleen CD4+ CD8+ maturation, results are in cells per mg of tissue. (D) Spleen CD4+ CD8− maturation, results are in cells per mg of tissue. (E) Spleen CD4− CD8+ maturation, results are in cells per mg of tissue. Phenotyping is performed on 5 mice spleen/group. Data are mean ± SEM. Data were analysed by Mann–Whitney t-test. Representative data are shown: * p ˂ 0.05, SE vs. EE.
Figure 9
Figure 9
Immune lymphocytes maturation in secondary immune organs. (A) Lymph node weight depending on the environment, results are grams. (n = 10 mice/group) (B) Thymus weight depending on the environment, results are grams. (n = 10 mice/group) (C) Lymph node CD4+ CD8+ maturation, results are in cells per mg of tissue. (D) Thymus CD4+ CD8+ maturation, results are in cells per mg of tissue. (E) Lymph node CD4+ CD8− maturation, results are in cells per mg of tissue. (F) Thymus CD4+ CD8− maturation, results are in cells per mg of tissue. (G) Lymph node CD4− CD8+ maturation, results are in cells per mg of tissue (H) Thymus CD4− CD8+ maturation, results are in cells per mg of tissue. Phenotyping is performed on 5 mice tissue/group. Data are expressed as mean ± SEM. Data were analysed by Mann–Whitney t-test. Representative data are shown: * p ˂ 0.05, ** p < 0.01, SE vs. EE.

Similar articles

Cited by

References

    1. Weyh C., Krüger K., Strasser B. Physical Activity and Diet Shape the Immune System during Aging. Nutrients. 2020;12:622. doi: 10.3390/nu12030622. - DOI - PMC - PubMed
    1. Leeners B., Geary N., Tobler P.N., Asarian L. Ovarian hormones and obesity. Hum. Reprod. Update. 2017;23:300–321. doi: 10.1093/humupd/dmw045. - DOI - PMC - PubMed
    1. Kershaw E.E., Flier J.S. Adipose tissue as an endocrine organ. J. Clin. Endocrinol. Metab. 2004;89:2548–2556. doi: 10.1210/jc.2004-0395. - DOI - PubMed
    1. Jia M., Dahlman-Wright K., Gustafsson J.-Å. Estrogen receptor alpha and beta in health and disease. Best Pract. Res. Clin. Endocrinol. Metab. 2015;29:557–568. doi: 10.1016/j.beem.2015.04.008. - DOI - PubMed
    1. Barros R.P.A., Gabbi C., Morani A., Warner M., Gustafsson J.-A. Participation of ERalpha and ERbeta in glucose homeostasis in skeletal muscle and white adipose tissue. Am. J. Physiol. Endocrinol. Metab. 2009;297:E124–E133. doi: 10.1152/ajpendo.00189.2009. - DOI - PubMed